Monitoring Lake water quality
Monitoring lake water quality (6.0)
Why monitoring is important (6.1)
As noted in Section 3.4, although the Lakeshore Capacity Model makes reliable predictions when properly applied, it should be validated by water quality monitoring. Monitoring water quality in a lake over time will allow municipalities to follow trends, determine whether the lake systems are behaving as predicted and detect any unforeseen problems as they emerge.
The following sections provide an overview of monitoring. More detailed information on what and how to monitor is available from MOE.27 Historical information on a lake’s water quality may also exist at MOE (e.g., through the Lake Partner Program, see Section 6.3) or at the local conservation authority. For more about acquiring such information, see Appendix B, Lakeshore capacity assessment resources.
What should be monitored? (6.2)
The most useful estimate of trophic status, considering ease of collection and temporal variability, is total phosphorus (TP). For the purpose of using the Lakeshore Capacity Model, the optimal method of assessing the trophic status of a lake is to collect several years of TP data at spring overturn. Alternately, a lake can be characterized by using whole-lake, volume-weighted, ice-free means of TP (Table 5). Epilimnetic TP data (i.e., samples taken from the warm, wind-circulated upper layer of a thermally stratified lake) aren't as suitable for use in the Lakeshore Capacity Model.
In lakes that support populations of lake trout, dissolved oxygen is a critical measure. Levels of dissolved oxygen are usually at their minimum just before fall turnover and monitoring usually focuses on this time period. To better understand seasonal changes, spring profiles can also be taken to determine the degree of mixing. Several years of data, taken at multiple depths, are needed to make sure that atypical profiles aren't being used to represent long-term average conditions.
| Indicator | Derivation | Sample method | Samples per year - 95% confident of being within 10% mean | Samples per year - 95% confident of being within 20% mean | Number of years - 95% confident of being within 10% mean | Number of years - 95% confident of being within 20% mean | Time |
|---|---|---|---|---|---|---|---|
| TP(so)* | usually single sample | 5 m composite | 11 | 11 | 10 | 2 | during spring turnover prior to thermal stratification |
| TP(if)* | average of all samples collected for ice-free period | composites when lake is mixed volume weighted during stratification | 9-13 (bi-weekly) |
4-5 (monthly) |
5 | 1 | between ice out and freeze up |
| TP(epi)* | average of all samples collected during stratification | epilimnetic composite | 19 | 5 | 7 | 2 | during thermal stratification |
| Chl a(ss)* | average of all samples collected during stratification (e.g. through self help programs) |
euphotic zone composites | less than for Chl a(if); should use Chl a(if) if spring/fall blooms expected |
less than for Chl a(if); should use Chl a(if) if spring/fall blooms expected |
less than for Chl a(if); should use Chl a(if) if spring/fall blooms expected |
less than for Chl a(if); should use Chl a(if) if spring/fall blooms expected |
during thermal stratification |
| Chl a(if)* | average of all samples collected for ice-free period | euphotic zone composites | 10 | 5 | >5 | 2-5 | between ice out and freeze up |
| Oxygen | usually profile data | oxygen meter with some Winkler test samples to confirm | sample frequency based on final use of data | sample frequency based on final use of data | sample frequency based on final use of data | sample frequency based on final use of data | key period just prior to fall de-stratification |
| Secchi | individual observations | Secchi disc | 11-17 (weekly) |
3-4 (monthly) |
2-5 | 1 | ice-free period |
* so = spring overturn;
if = ice free;
epi = epilimnetic;
ss = summer stratified.
1 usually only enough time for one visit.
Lake Partner Program (6.3)
The Ministry of the Environment’s Lake Partner Program works in partnership with the Federation of Ontario Cottagers' Associations, the Lake of the Woods District Property Owners Association and many other organizations to foster lake stewardship by increasing the public’s awareness of the links between phosphorus and water clarity in Ontario lakes.
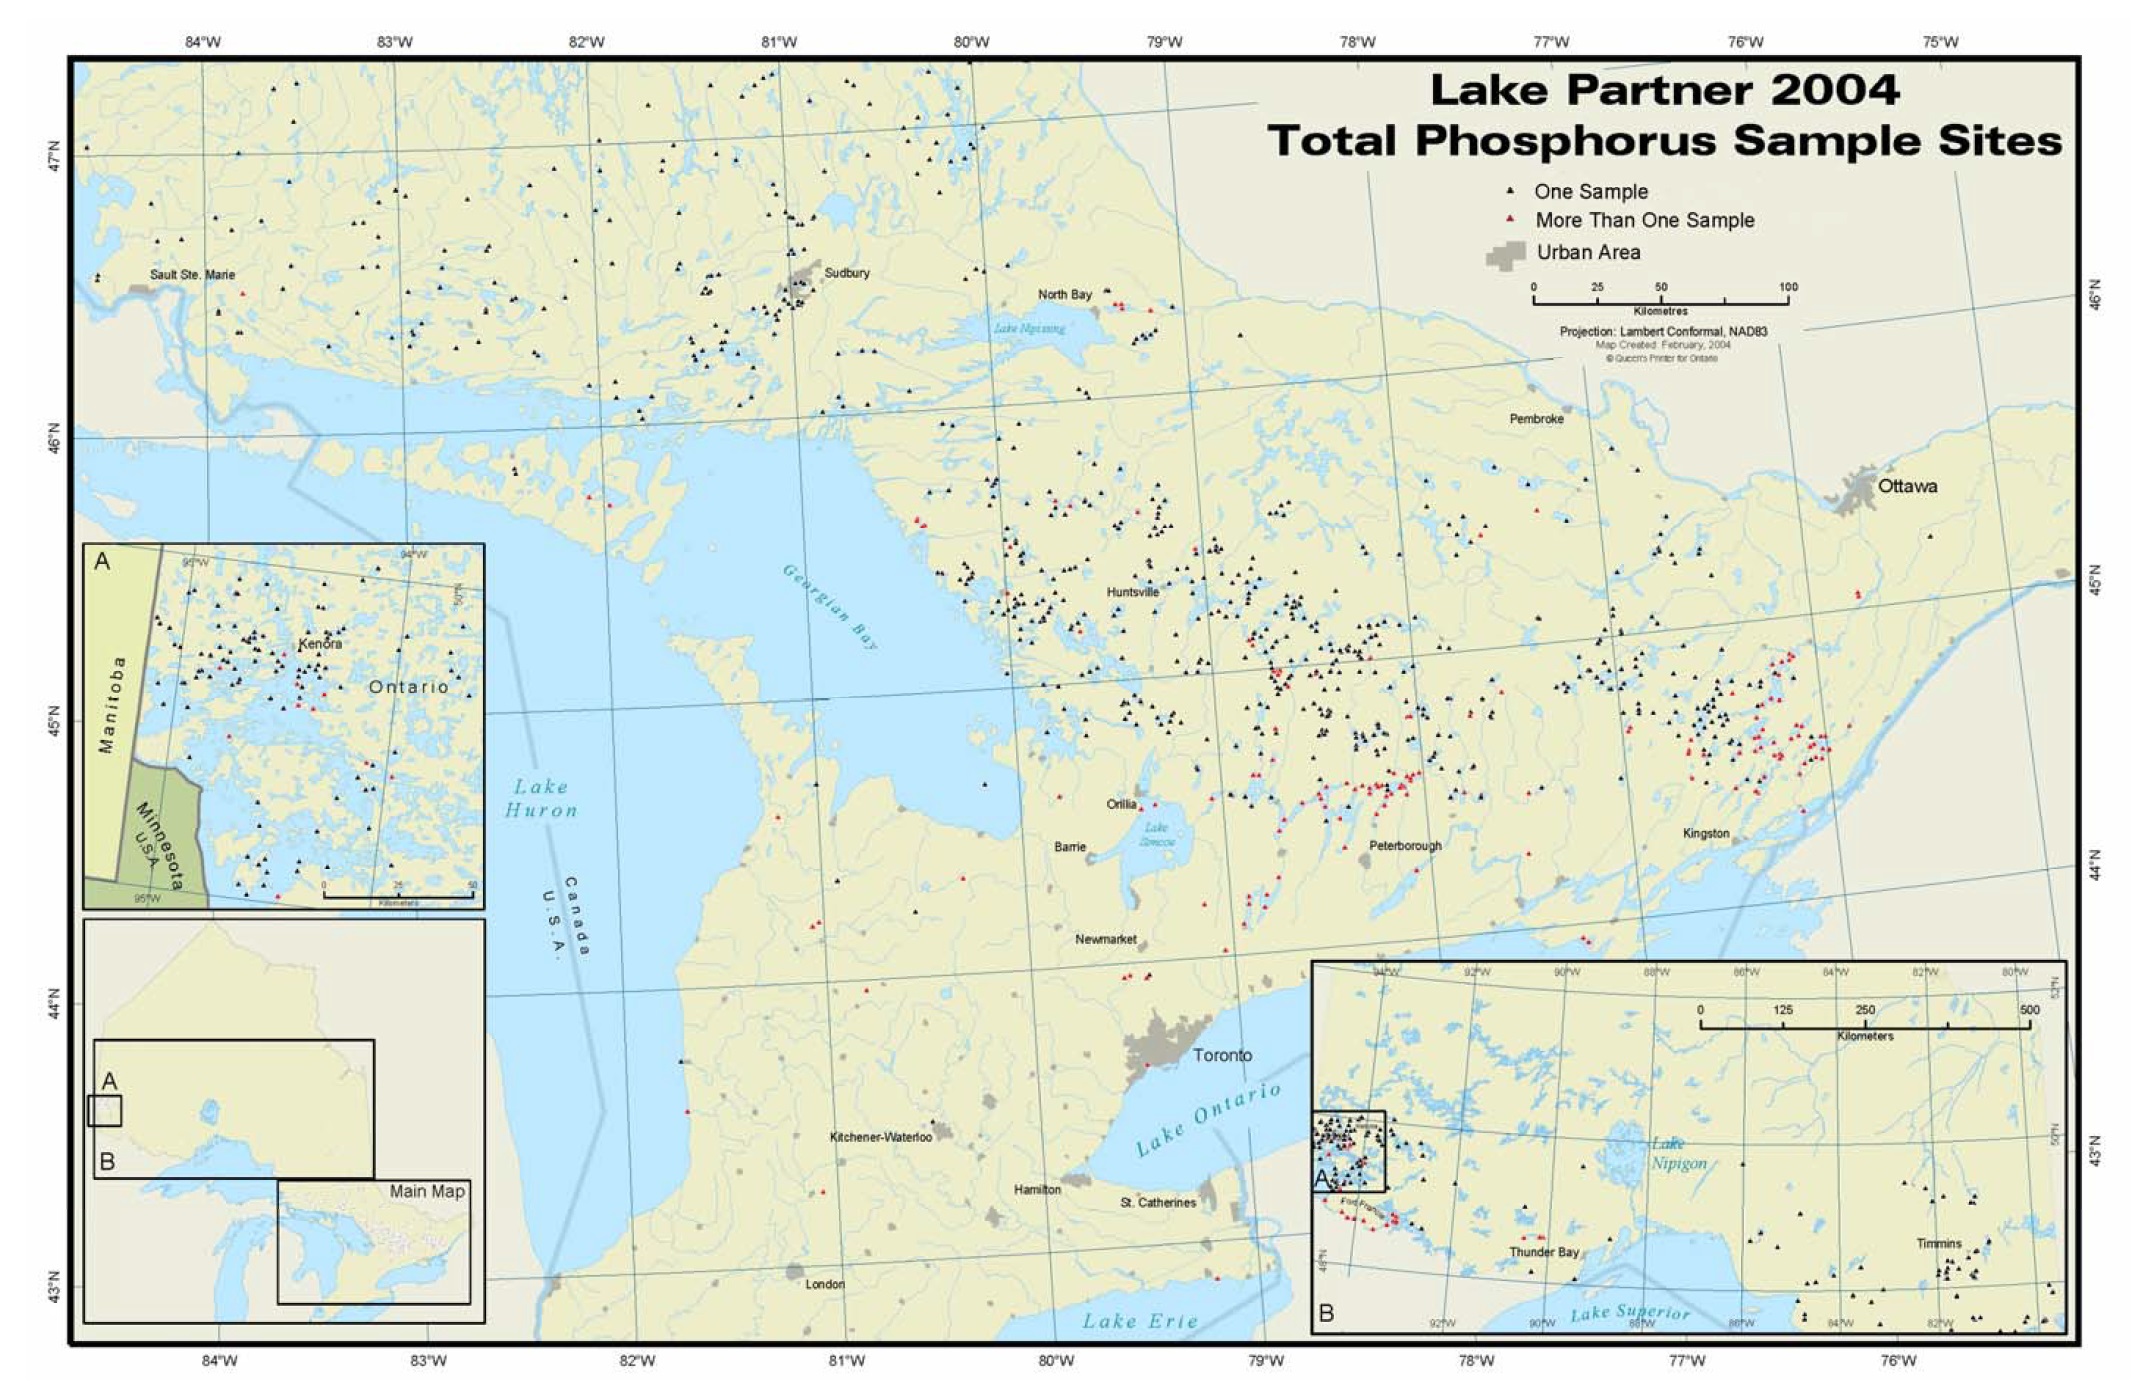
The program uses volunteers to collect total phosphorus (TP) and water clarity data for lakes throughout Ontario and cooperates with many science partners (including other MOE departments and municipalities) to provide accurate TP monitoring for specific lakes of interest. The program has been quite successful: in 2004, water quality information was collected from more than 1,000 locations scattered throughout the major cottage areas of the province (Figure 4).
Lakes on the Precambrian Shield are sampled once each spring for TP, while water clarity is measured monthly with a Secchi disc during the ice-free period (May through October). Off-shield lakes are sampled monthly for both TP and water clarity during the ice-free period.
The TP samples are analysed by MOE to an average precision of approximately 0.7 µg/L, which is sensitive enough to detect between-year differences in spring turnover concentrations for individual lakes. The numbers are also precise enough to test the performance of the Lakeshore Capacity Model or for use as input to hypolimnetic oxygen models.
The Lake Partner Program is based out of the Ministry’s Dorset Environmental Science Centre. Annual reports for the program are made available to volunteers, science partners and the public in hard copy or electronically via the ministry’s website (See Lake Partner Program Map). Inquiries about the Lake Partner Program can be made by calling 1-800-470-8322 or by emailing lakepartner@ontario.ca.
Figure 4. Lake Partner Program: Sample locations in 2004
How chemical analysis should be done (6.5)
Phosphorus occurs naturally in many forms. Both organic and inorganic phosphorus are present as dissolved, colloidal and particulate fractions in lake water samples. The analysis of total phosphorus (TP) in a lake water sample is the best test to yield precise results for phosphorus.
Total phosphorus can be accurately measured even at low microgram per litre (µg/L) levels if certain precautions are taken. To obtain acceptable phosphorus results, it is best to use the classic colourimetric method: reduced phospho-antimonyl-molybdate (heteropolyblue) complexing reaction with subsequent colourimetric measurement. This reaction is specific to the orthophosphate form and is stable and relatively interference-free (when arsenate and silicate concentrations are both less than 10 µg/L). Phosphorus analysis by inductively-coupled plasma emission isn't recommended because the level of detection is generally 50 µg/L or greater. This isn't sensitive enough for modeling the trophic status of Precambrian Shield lakes.
The colourimetric method is amenable to automation, making large numbers of analyses possible. It is straightforward and quick, giving reliable results if done by a trained analyst. Sample pre-treatment is further simplified through the use of an autoclave and acid digestion with persulfate oxidation. This digestion converts all phosphorus fractions (total phosphorus) to orthophosphate.
The optimal method of TP analysis for the purpose of the Lakeshore Capacity Model also includes the collection of duplicate lake water samples directly into the autoanalyzer tubes to minimize container effects.
The laboratory at MOE's Dorset Environmental Science Centre specializes in low-level phosphorus analysis and can be contacted for information on this procedure. The ministry’s Laboratory Services Branch can also be contacted to provide information on methods to determine both total and soluble phosphorus at higher concentrations for a nominal fee (about $35 currently). Contacts for the ministry are listed in Appendix B. There are also several commercial labs in the province that can carry out TP analysis using the colourimetric method.
27 Ontario Ministry of Environment and Energy. 1992. Measuring the trophic status of lakes: sampling protocols. Queen’s Printer for Ontario.
28 Ontario Ministry of Environment and Energy. 1992. Measuring the trophic status of lakes: sampling protocols. Queen=s Printer for Ontario.