Chapter 1: Demographic Trends and Projections 2020
Introduction
This chapter describes anticipated changes in Ontario’s population over the next quarter century. These changes are broadly consistent with demographic trends that have taken place in the province over the last 50 years. Based on these demographic trends, there are five key implications for the future:
- Continued population growth
- Population growth driven by immigration
- Concentration of population growth in the largest urban areas
- Rapid increase in the number and proportion of seniors; and
- A period of slower growth among the core-age population
The demographic outlook reflects the latest population projections published by the Ontario Ministry of Finance.
1. Continued Population Growth
Since 1971, Ontario’s population has almost doubled, from 7.8 million to 14.6 million in 2019. Over this time period, the provincial population grew at an average pace of 1.3 per cent, or 140,000 annually. Ontario’s share of the Canadian population also rose, from 35.7 per cent in 1971 to 38.8 per cent in 2019.
Provincial population growth has accelerated in recent years, starting in the summer of 2016. In 2018–19 alone, Ontario’s population increased by 248,000 (1.7 per cent). This is much faster than the average annual growth of 121,000 (0.9 per cent) observed in the preceding decade (2006 to 2016). The population of the province grew faster due to increased immigration, a rapidly growing number of non-permanent residents including international students, and positive interprovincial migration.
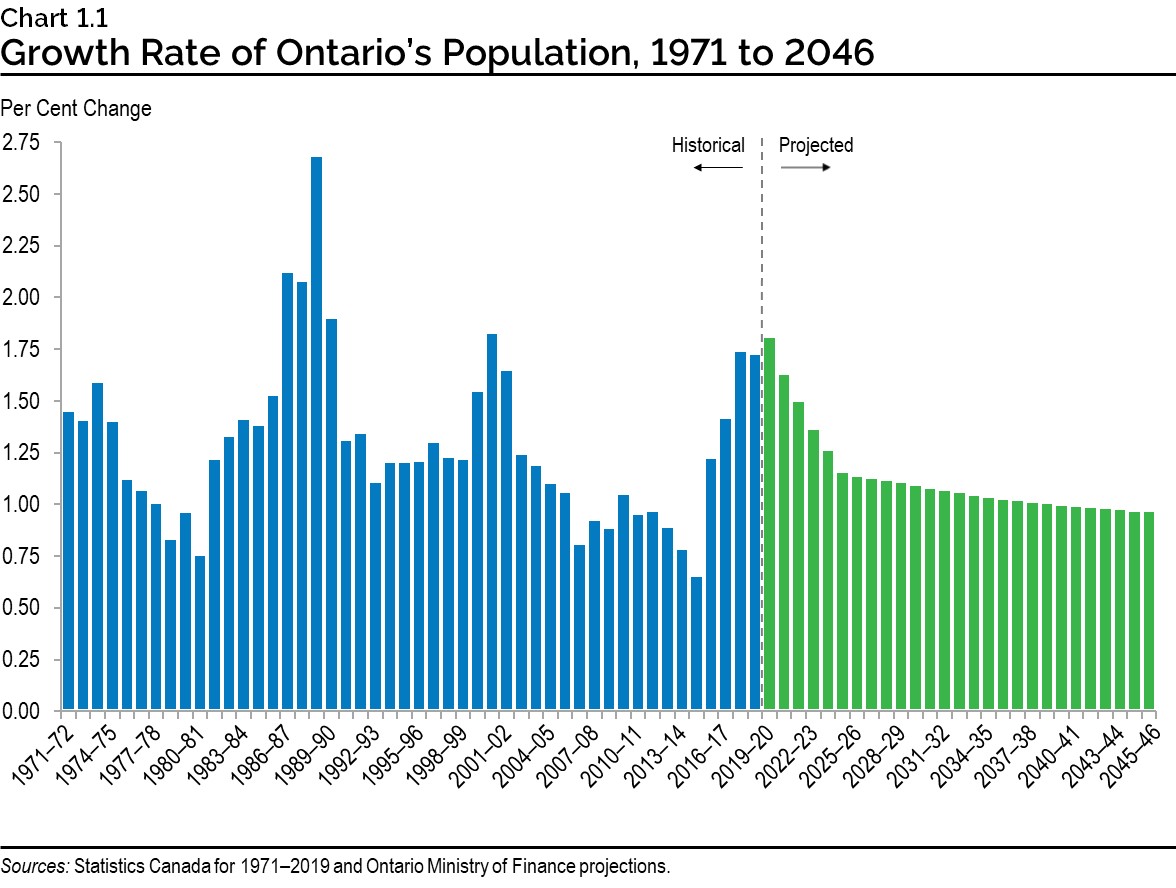
Ontario’s population is projected to continue growing but at a moderating pace, from 1.8 per cent in 2019–20 declining over time to 1.0 per cent by 2045–46.
Ontario’s Population Growth in Perspective
Compared to other advanced economies, Ontario’s and Canada’s populations have been growing at a relatively fast pace over the last 20 years. This is mainly due to immigration. Other countries with high immigration rates, such as Australia and New Zealand, also grew faster than most other developed countries over the last two decades.

2. Immigration-Driven Population Growth
The share of annual population growth coming from natural increase, which is births minus deaths, has been declining over the last 50 years. Accordingly, low fertility rates, an aging population and rising immigration have resulted in an increasing contribution of net migration to provincial population growth. Net migration is the sum of all arrivals minus departures in a given time period. For Ontario, this includes both net international and net interprovincial migration.
In the 1970s, about one-third of population growth was coming from net migration and two-thirds from natural increase. The situation has reversed. Over the last 10 years, natural increase accounted for 28 per cent of population growth in Ontario, and net migration for 72 per cent.
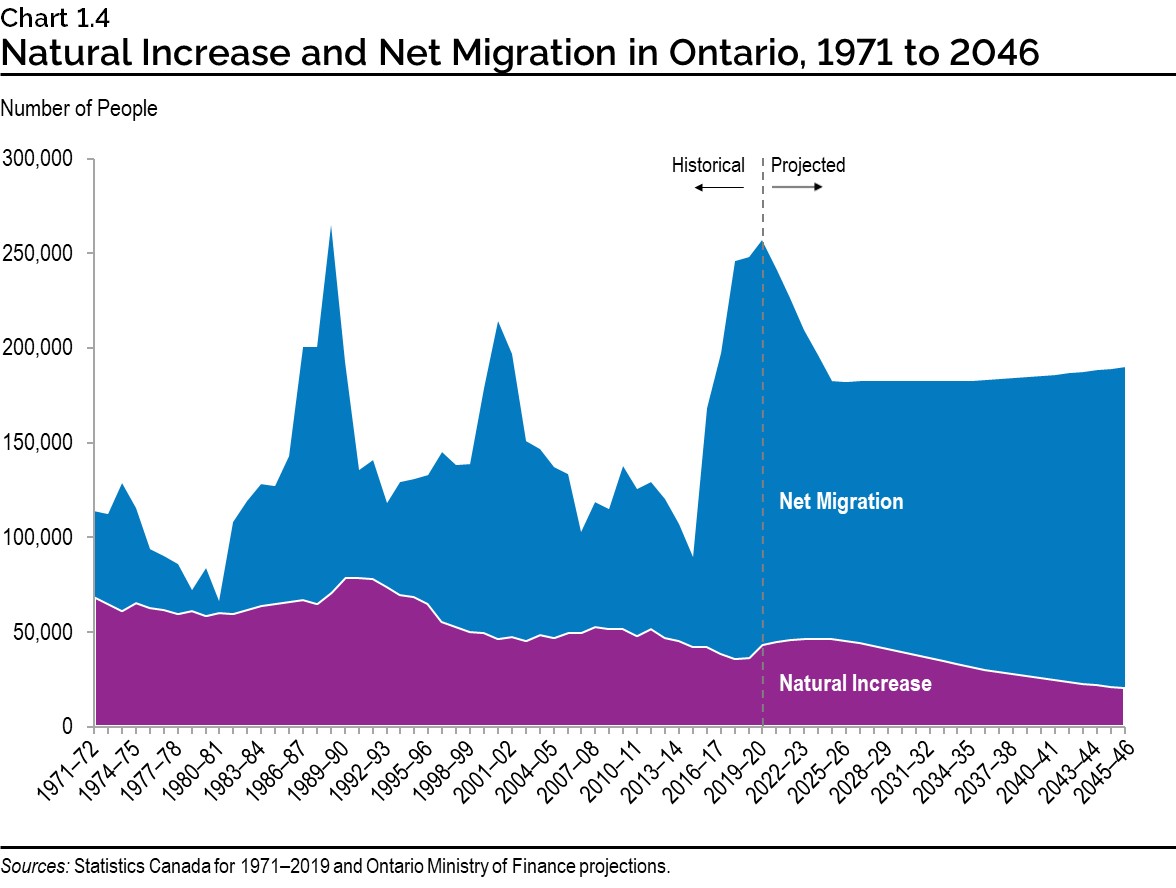
This trend is expected to continue over the projection period to 2046, as fertility rates are forecasted to remain steady, the population to continue aging and immigration rates to remain stable. By 2045–46, only 11 per cent of Ontario’s population growth is projected to come from natural increase, with net migration becoming by far the main source of population growth (89 per cent).
Immigration is the largest component of net migration. During calendar year 2019, 153,413 immigrants settled in Ontario, accounting for 45 per cent of all immigrants to Canada. This number of immigrants is equivalent to the entire population of the city of Barrie. Before the COVID‑19 outbreak (refer to the discussion at the end of this chapter), national immigration levels were expected to increase in the short term, consistent with the federal immigration plan. For Canada as a whole, the immigration target was set to rise from 341,000 in 2020 to 361,000 in 2022.

Over the remainder of the projections, which were prepared prior to the COVID‑19 outbreak, annual immigration to Ontario is projected to remain strong and to increase gradually as the provincial population grows. From 2019 to 2046, 4.4 million new immigrants are projected to settle in Ontario.
Age Distribution of Immigrants
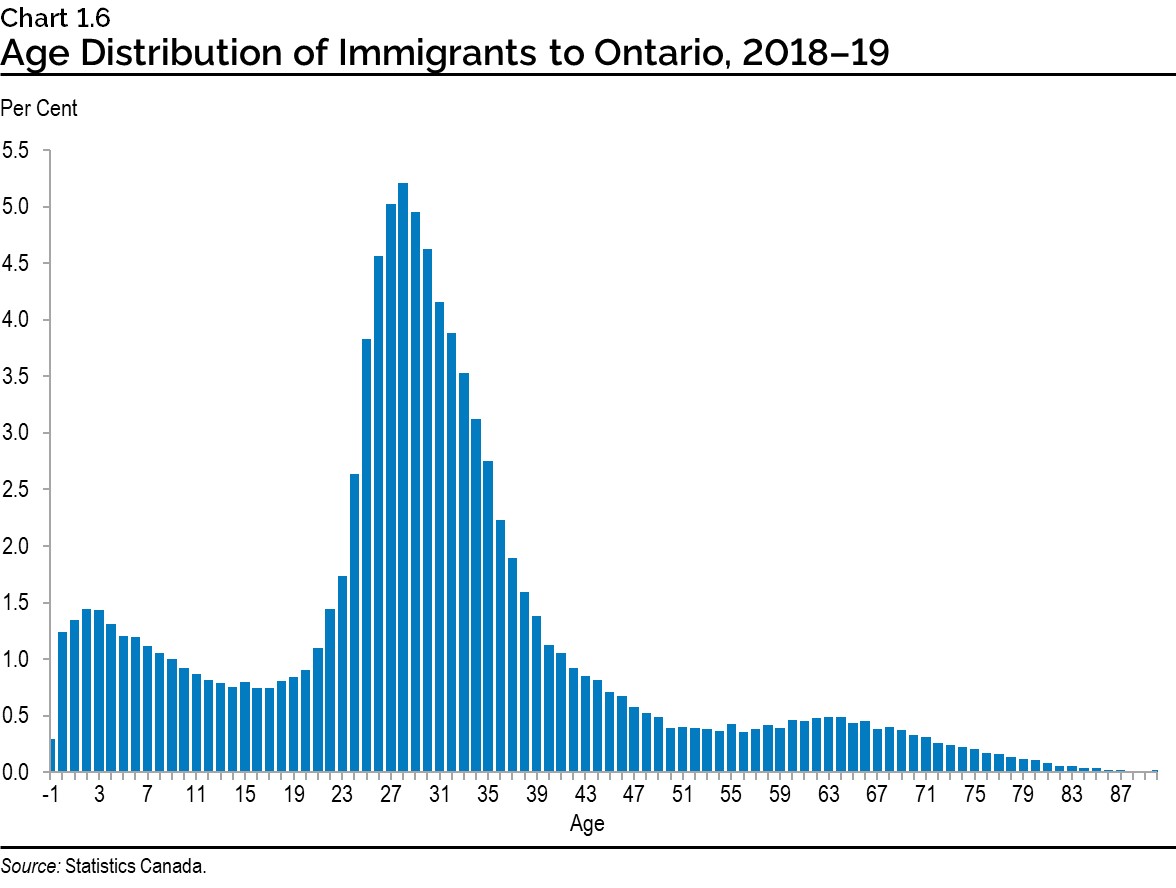
Immigrants to Ontario are relatively young compared to the resident population. In 2018–19, two-thirds (67 per cent) of all immigrants who settled in the province were between the ages of 18 and 44. The median age of 2018–19 newcomers was 29 years, compared to 40 years for the resident population.
Over the projection period to 2046, other migration components will also have an impact on the pace of population growth in the province. Almost 800,000 people in Ontario are projected to emigrate from the province to other countries. Additionally, Ontario is projected to see a modest net gain of almost 30,000 people through interprovincial migration from the rest of Canada.
Interprovincial Migration
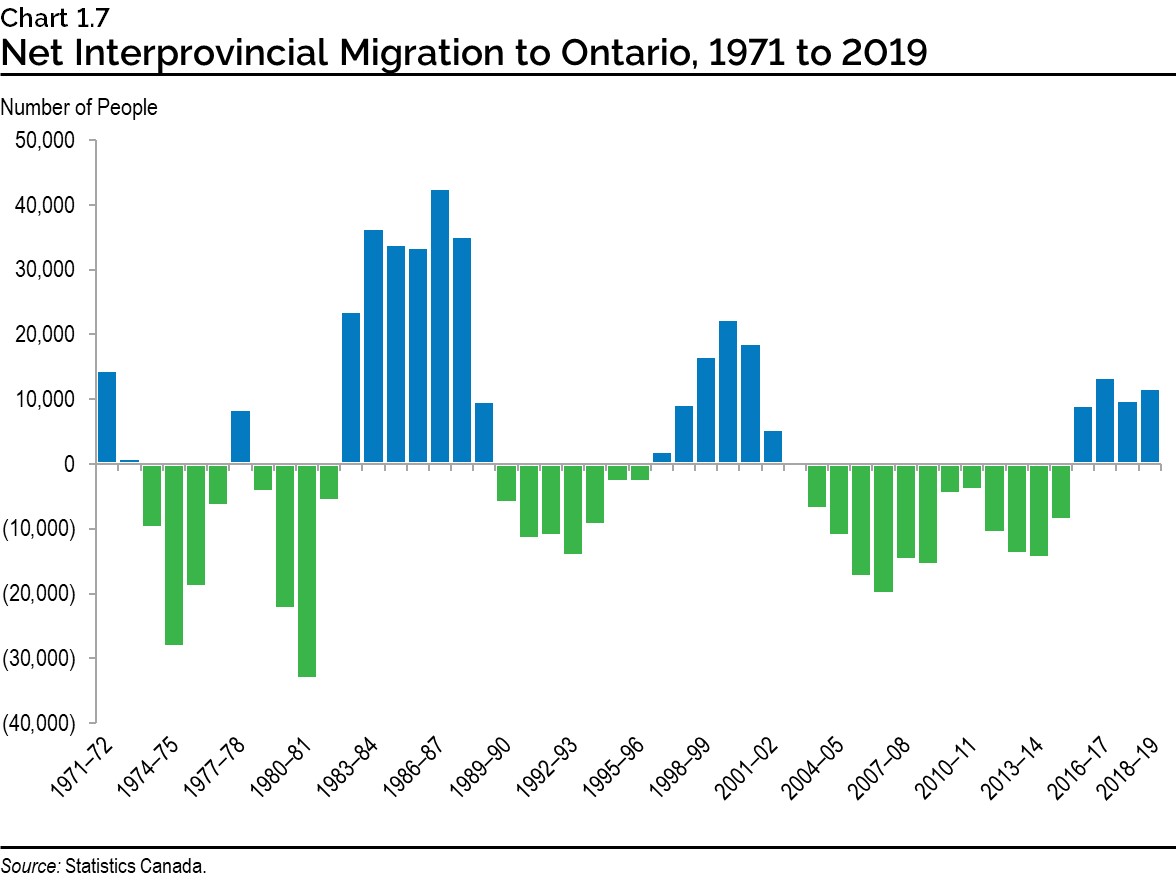
In any given year, net gains or losses of people to and from other provinces can have a significant impact on annual population growth in the province. However, over longer time periods the contribution of interprovincial migration to Ontario’s population growth has been minor. This is because periods of annual net gains usually alternate with periods of yearly net losses, in a pattern closely tied to economic cycles.
3. Population Growth Concentrating in the Largest Urban Areas
As outlined previously, provincial population growth has increasingly been driven by immigration. Immigrants mostly chose to settle in the largest urban centres, which has resulted in relatively stronger population growth in the largest cities, particularly the Greater Toronto Area (GTA).
Over the last 20 years, 80 per cent of all immigrants to Ontario initially settled in the GTA, 8 per cent in Central Ontario, 6 per cent in the East, 5 per cent in the Southwest and less than 1 per cent in the North. Since four out of five newcomers to Canada are below the age of 40, regions selected by more immigrants have experienced slower population aging. Their younger populations have also resulted in more births, which contributed to slow the decline in natural increase. These trends are projected to continue.
At the same time, smaller towns and rural areas where natural increase had previously been the main or sole source of population growth are seeing their population growth slow, and in some cases decline. In 2018–19, deaths exceeded births (negative natural increase) in 29 of the 49 census divisions in the province, up from 13 census divisions 20 years ago. Among regions, only the North experienced natural decrease in 2018–19 with deaths exceeding births. By 2045–46 the GTA is the only region where natural increase is projected to remain positive.
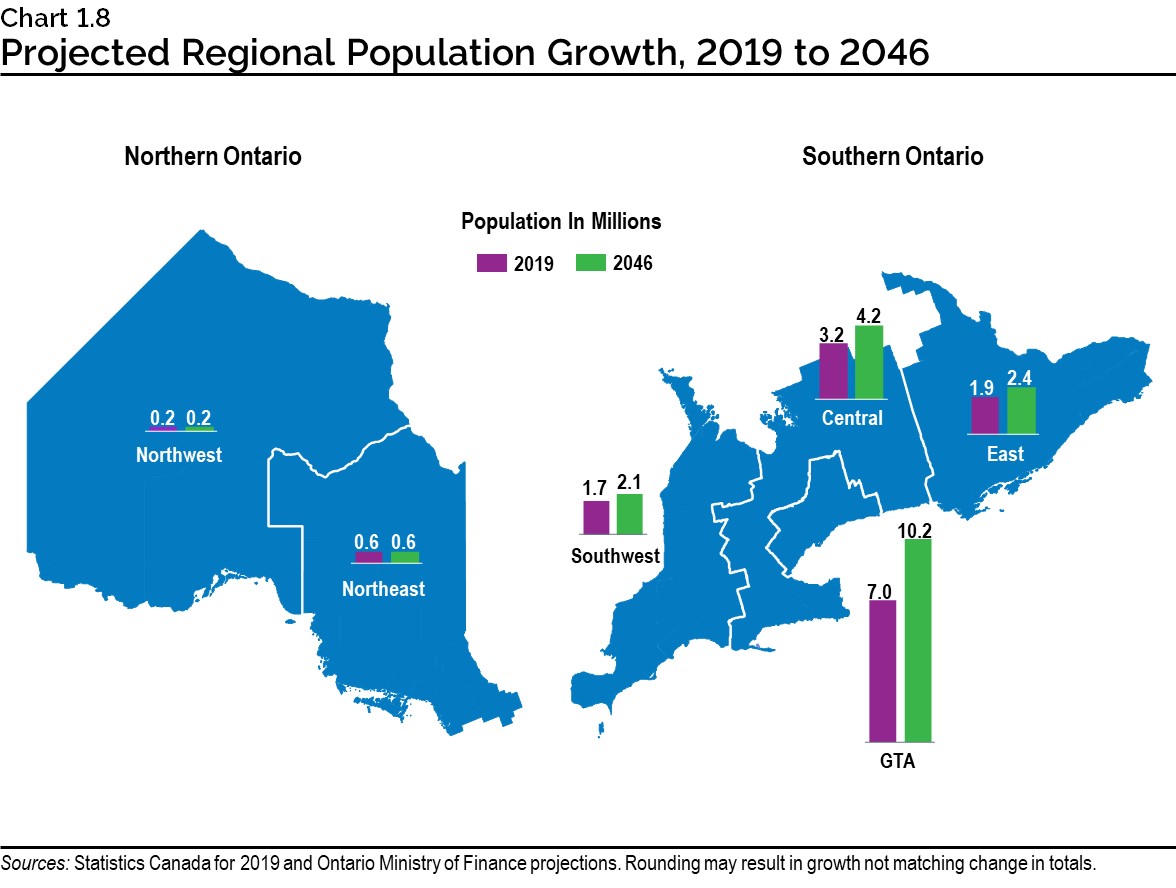
The GTA’s population is expected to grow by 47 per cent to 2046, adding another 3.3 million people to reach 10.2 million residents. This is 11 percentage points higher than the overall growth of 36 per cent projected for the province as a whole. The region would account for nearly two-thirds of provincial population growth over the period. It is projected that 52 per cent of people in Ontario will live in the GTA by 2046, up from 48 per cent in 2019. In the five other regions of the province the population will keep growing, but at a slower pace.
The population of Central Ontario is projected to grow at a pace close to the provincial average. The region is projected to grow by one million residents, or 32 per cent, from 3.2 million in 2019 to 4.2 million by 2046.
Both Eastern and Southwestern Ontario are projected to experience population growth to 2046 at a slower pace than the province as a whole. Eastern Ontario is projected to see population growth of 507,000, or 27 per cent over the period, from 1.9 million in 2019 to 2.4 million by 2046. The population of Southwestern Ontario is projected to grow by 389,000, or 23 per cent, from 1.7 million to 2.1 million.
Population growth trends for the North changed significantly over the past few years, driven by rapid growth in the number of non-permanent residents living in the region. The population of Northern Ontario is projected to remain relatively stable, with a slight increase of 2.0 per cent, from 811,000 in 2019 to 828,000 by 2046. Within the North, the Northeast is projected to see its population edging up by 10,000, or 2.0 per cent, from 568,000 to 579,000. The Northwest is also projected to experience slight population growth of 6,000 people, or 2.5 per cent, from 243,000 to 249,000.
Population Growth in the Greater Toronto Area
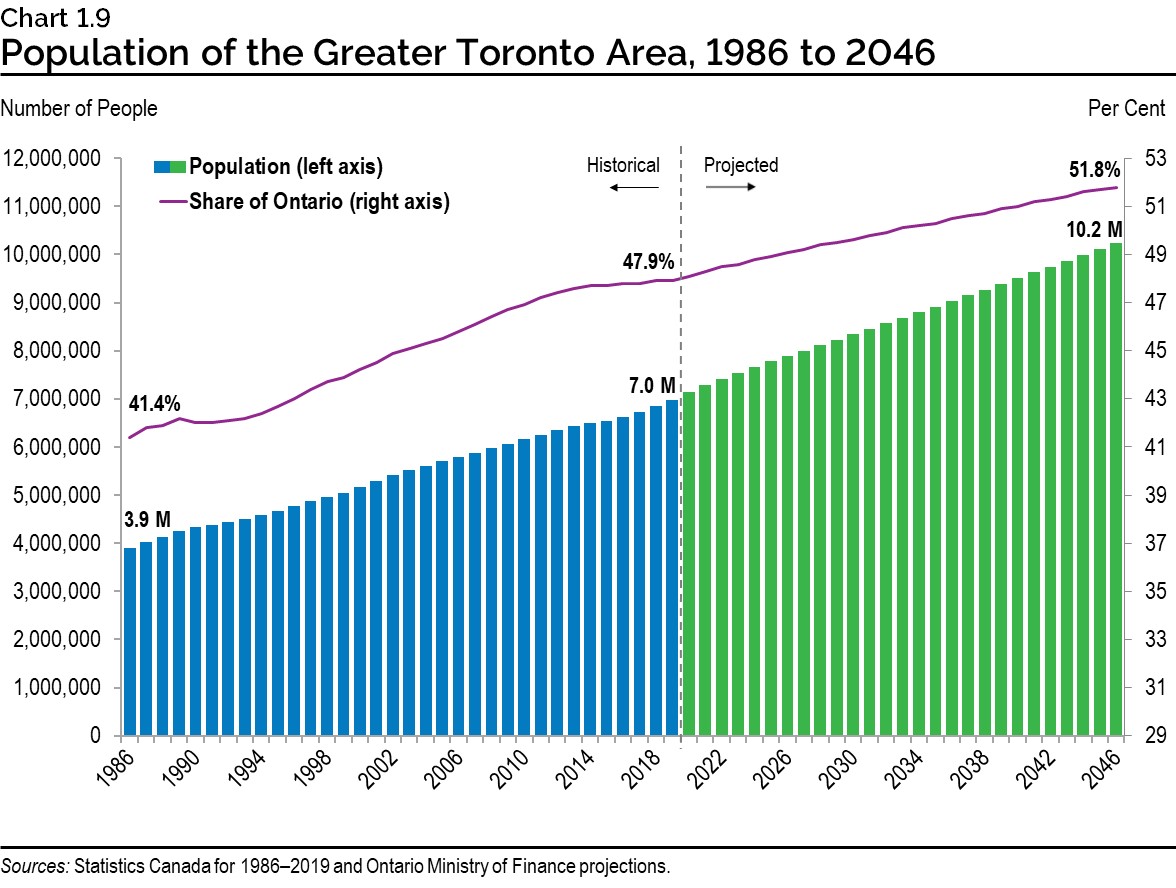
The GTA is one of the fastest-growing metropolitan areas in North America. In 2018–19, its population grew by 131,000, accounting for 53 per cent of provincial growth. Since 1986, the GTA added 3.1 million residents, growing from 3.9 million to 7.0 million in 2019. Over this time frame, the region experienced significantly faster growth than the rest of the province. As a result, the proportion of people in Ontario living in the GTA increased, from 41 per cent in 1986 to 48 per cent in 2019.
Metropolitan Population Growth in Perspective
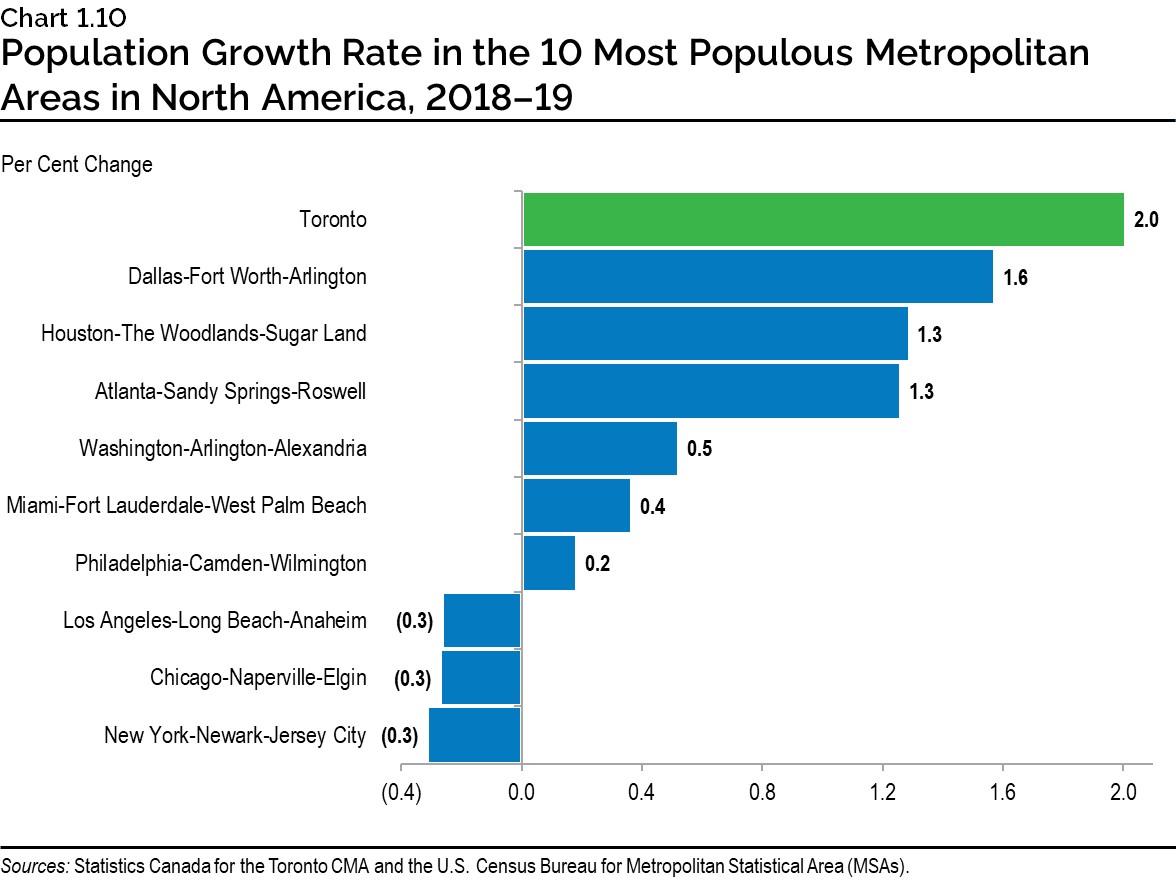
Among the top 10 most populous metropolitan areas in North America, the Toronto census metropolitan area grew fastest in 2018–19 at 2.0 per cent, followed by Dallas-Fort Worth-Arlington at 1.6 per cent.
4. Rapid Increase in the Number and Proportion of Seniors
Population aging in Ontario is the result of low fertility rates, the aging of the large cohorts of baby boomers and increasing life expectancies.
Baby boomers, born from 1946 to 1965, are now aged 55 to 74. The largest cohorts were born in the early 1960s, when Ontario’s total fertility reached a high of 3.8 children per woman. Following the baby boom, fertility rates declined rapidly over the rest of the 1960s and 1970s, falling below the cohort replacement
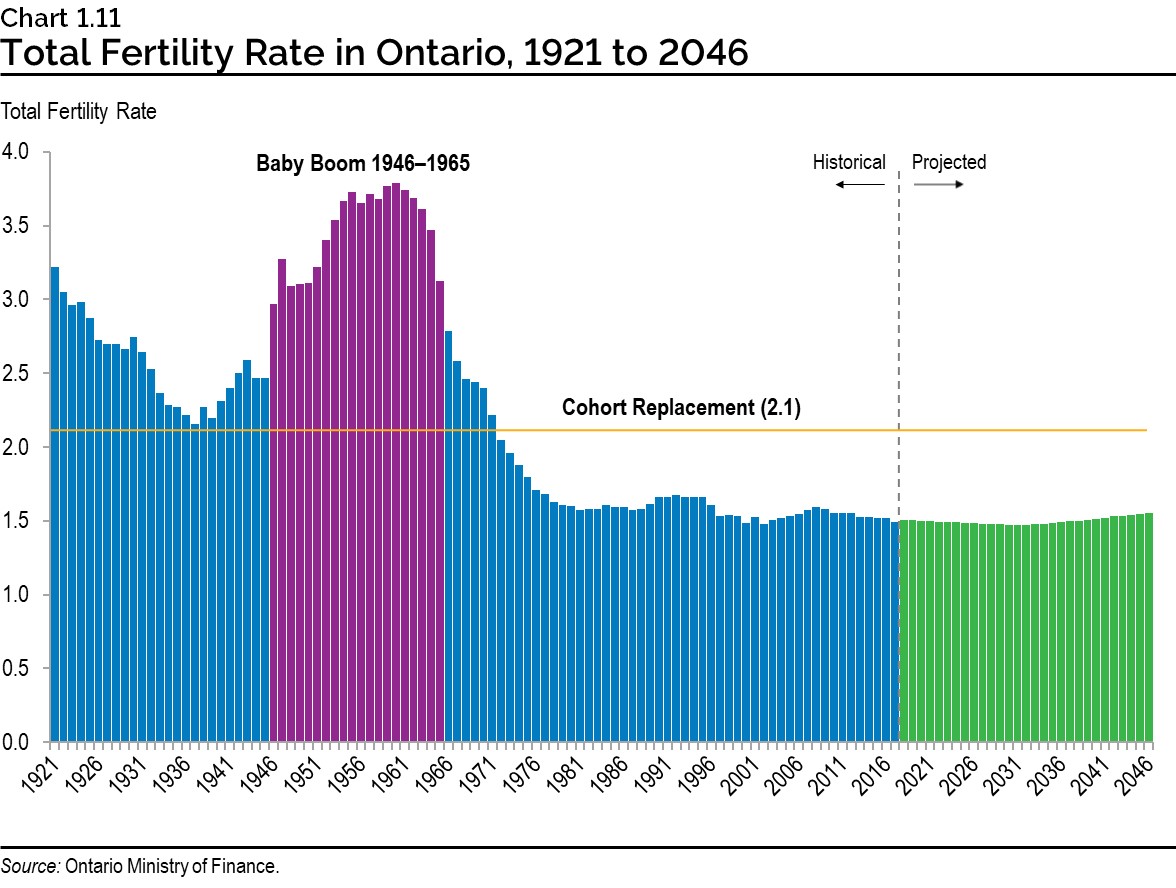
Fertility rates are not expected to return to the levels observed in the 1950s and early 1960s. The total fertility rate is assumed to increase slightly to 1.55 children per woman as younger women’s fertility rates stabilize, while those of women over the age of 30 continue to slowly increase.
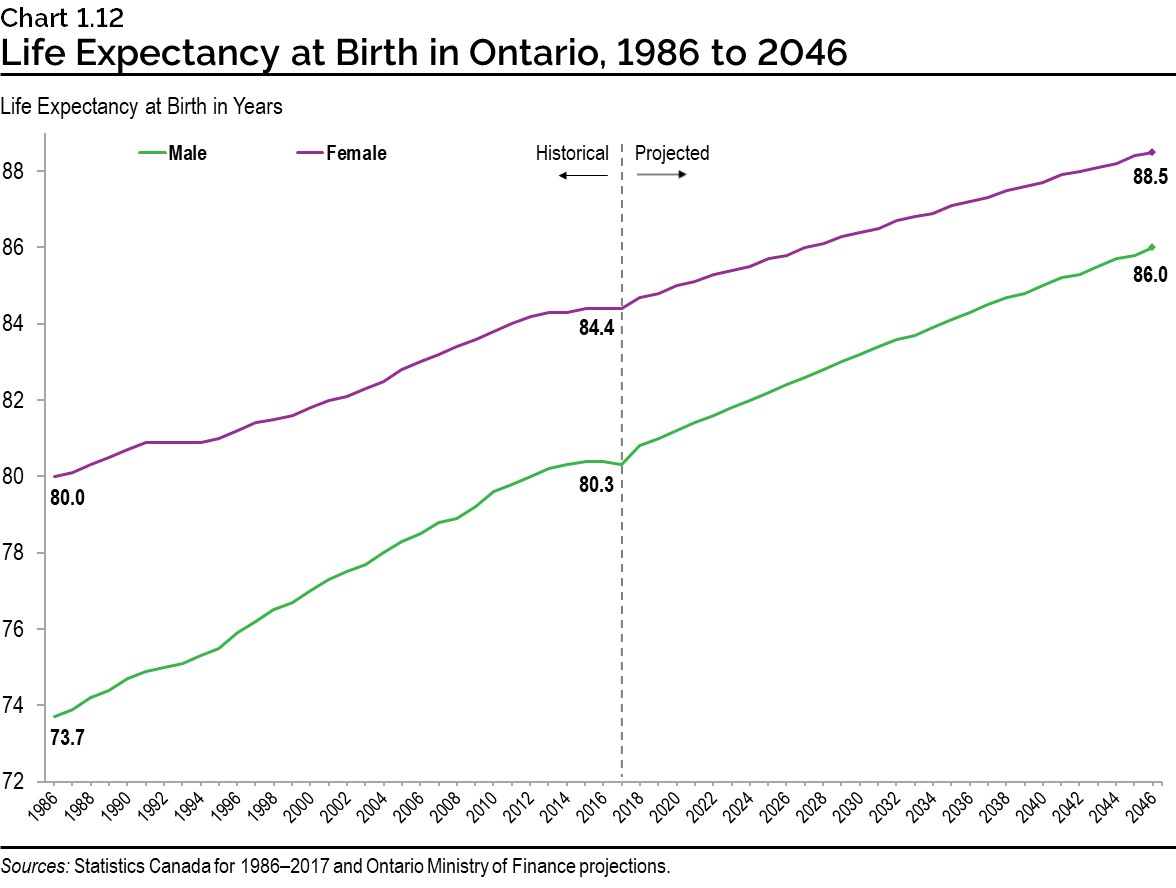
The largest cohorts of baby boomers are now in their late 50s. Over the next decade, these larger cohorts will join the ranks of seniors. Increased longevity is also contributing to a larger share of seniors in the population. For instance, over the last 30 years life expectancy at birth for Ontario men increased from 73.7 years in 1986 to 80.3 years in 2017 (latest available), for a total gain of 6.6 years. The life expectancy at birth of Ontario women increased at a slightly slower pace over the same period, with a total gain of 4.4 years, from 80.0 to 84.4 years. By 2046, life expectancy at birth is projected to reach 86.0 years for men and 88.5 years for women.
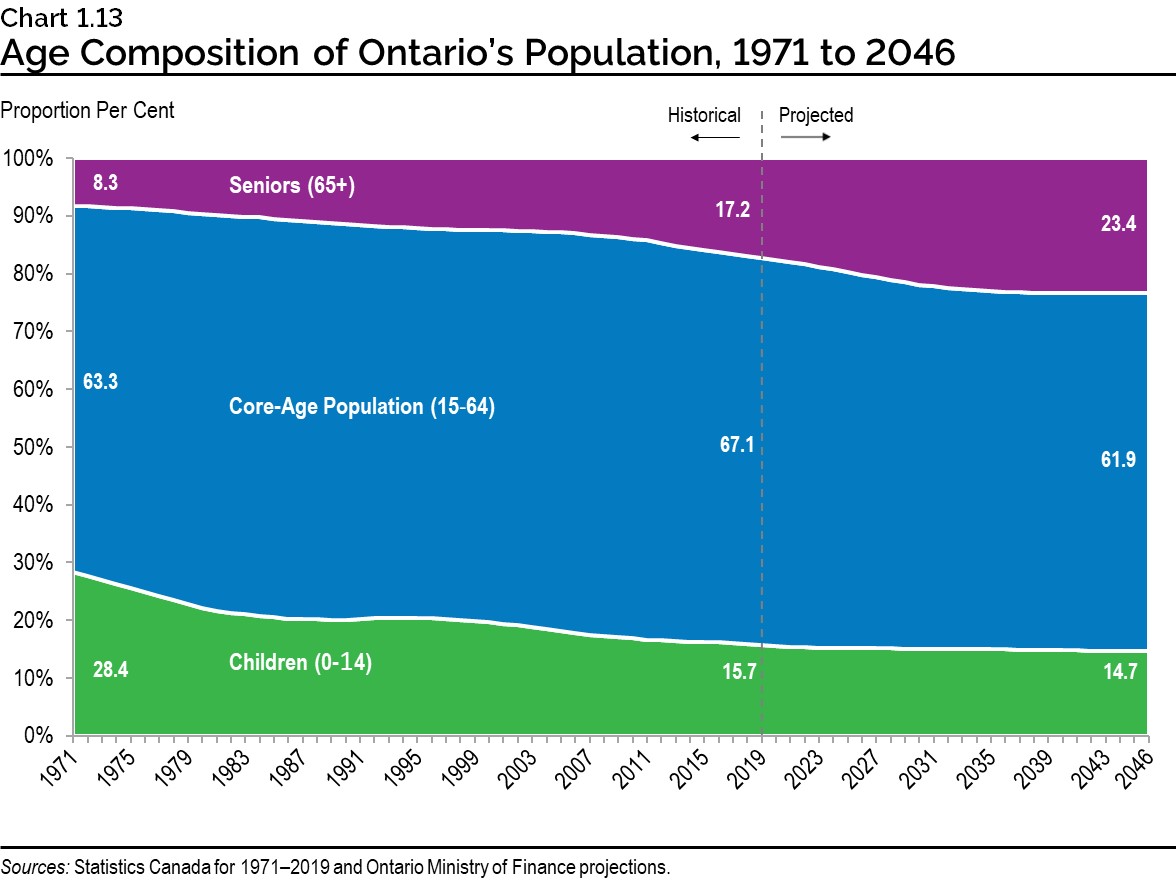
In 2016, for the first time on record, the number of seniors aged 65+ in Ontario surpassed the number of children aged 0 to 14 years. Children now account for less than 16 per cent of Ontario’s population, down from 28 per cent in 1971. By contrast, the share of seniors in the provincial population is now at an all-time high of 17 per cent, up from 8 per cent in 1971.
Over the projection period, the number of seniors is projected to almost double, from 2.5 million in 2019 to 4.6 million by 2046. The share of the provincial population that they represent will also rise, from 17 per cent to 23 per cent over the same period.
By the early 2030s, once all baby boomers have reached age 65, the pace of increase in the number and share of seniors is projected to slow significantly. The annual growth rate of the senior age group is projected to slow from an average of 3.5 per cent between 2019 and 2031 to 1.0 per cent by the end of the projection period.
The older age groups will experience the fastest growth among seniors. The number of people aged 75 to 84 is projected to rise from 755,000 in 2019 to 1.7 million by 2046. Over the same period, the 85+ age group is expected to more than triple in size, from 331,000 to 1.1 million.
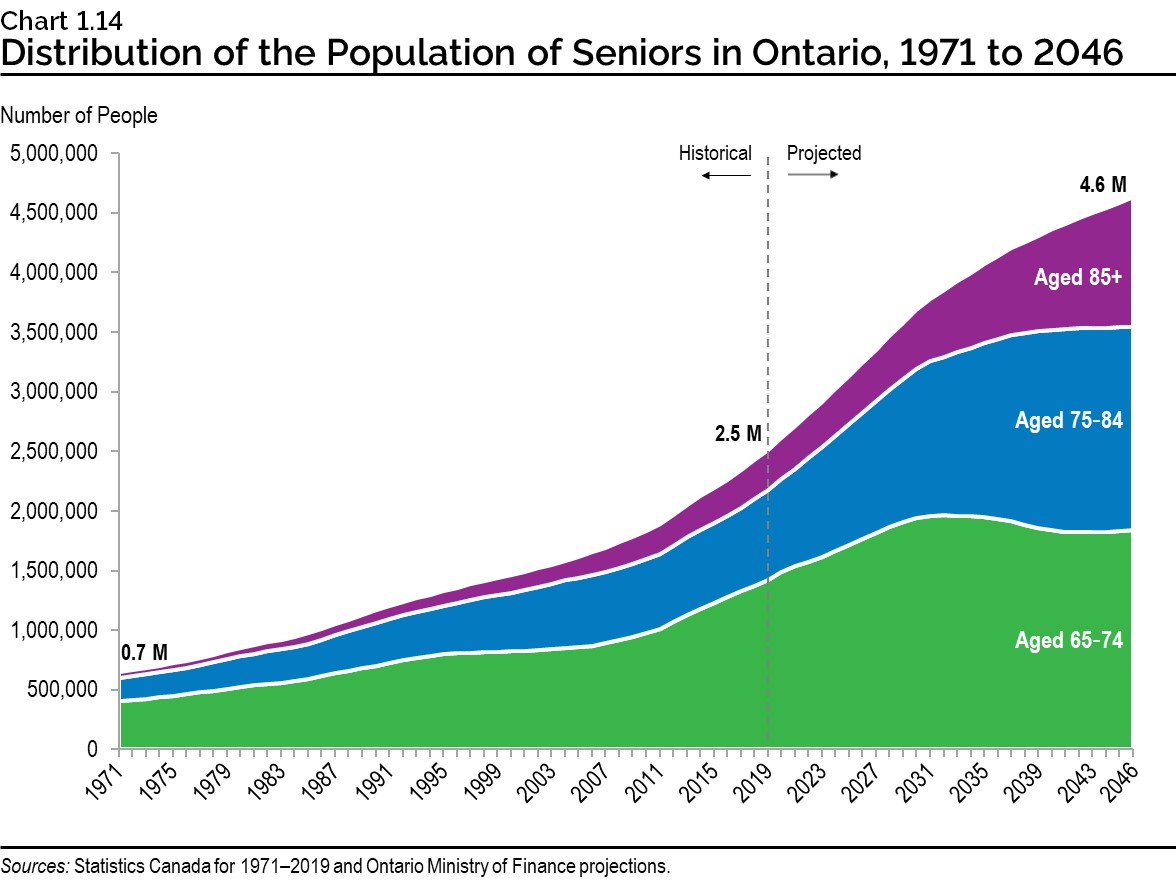
Today, almost six in 10 people in Ontario aged 65+ are in the younger segment of the senior population, between the ages of 65 and 74, because the cohorts of baby boomers that make up this group are larger than the ones preceding them. However, by 2046 the distribution will have reversed, with significantly more older seniors 75+ than younger ones, as a result of both the aging of baby boomers and continued increases in longevity.
Population Aging in Perspective
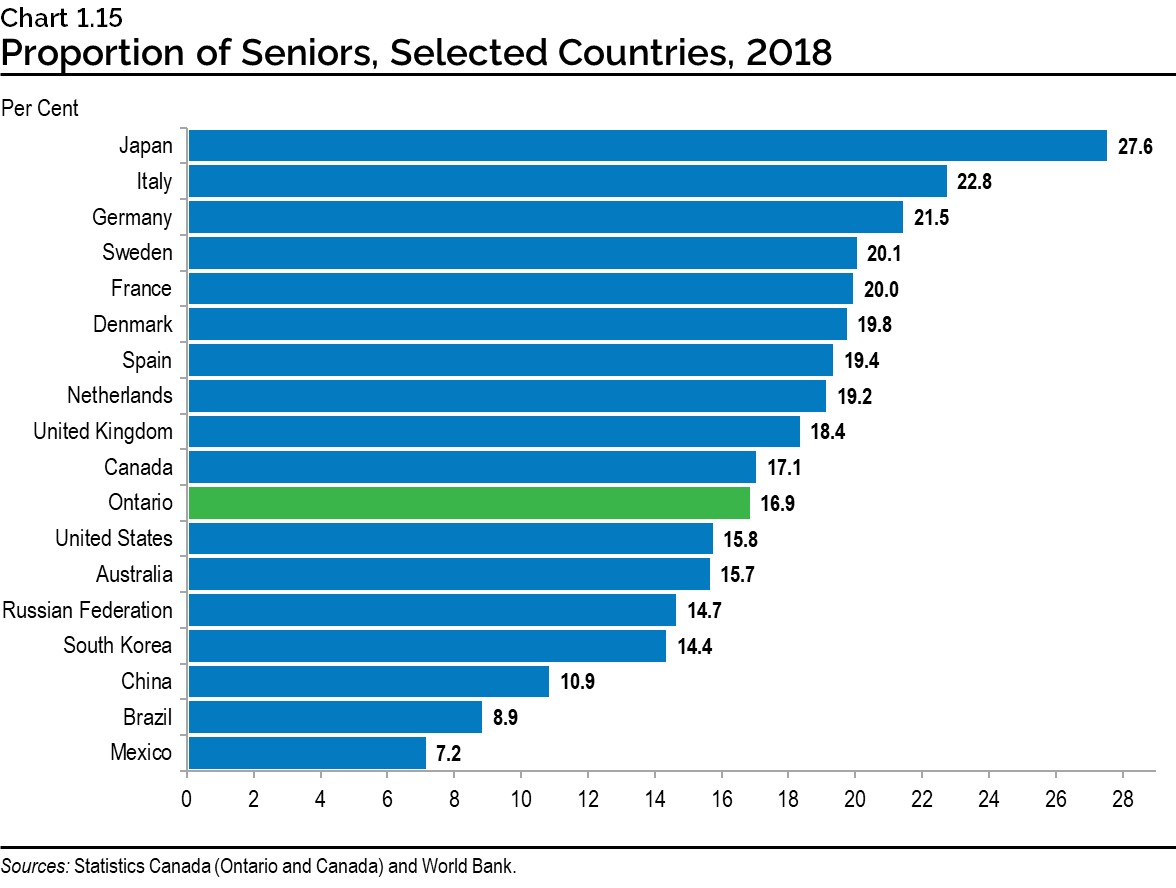
The proportion of seniors in Ontario’s population in 2018 (16.9 per cent) was slightly lower than the average (17.1 per cent) among countries of the Organisation for Economic Co-operation and Development (OECD). Most European countries had much higher shares of seniors, including Italy at 22.8 per cent and Germany at 21.5 per cent. Japan had the highest proportion of seniors in the OECD at 27.6 per cent in 2018.
5. Slower Growth for the Core‑Age Population
After 2011, when baby boomers started turning age 65, the growth rate of the population aged 15 to 64 in Ontario started to slow down, declining to an annual rate of 0.2 per cent in 2014–15. Over the previous 20 years, Ontario’s core-age population (15 to 64) had grown at an average annual rate of 1.2 per cent.
The recent rapid increase in the number of non-permanent residents and higher immigration levels since 2015 have had a positive impact on the growth of this age group. In 2018–19, Ontario’s core-age group grew by 1.5 per cent.
The recently experienced exceptionally high levels of net international migration are projected to diminish over the next few years, while the largest cohorts of baby boomers will move out of the core-age population during the 2020s. These trends will result in slower growth for this age group in the late 2020s. Between 2024 and 2031, the population aged 15 to 64 is projected to only grow at an average annual rate of less than 0.5 per cent.
By 2031, once the large cohorts of baby boomers have completed their transition to the senior age group, the pace of growth in the core-age population (15 to 64) is expected to increase, reaching above 1.0 per cent by the late 2030s. This would be slower growth in the core-age population than the historical trend.
Alternative Scenarios
The projections presented in this report are based on assumptions that reflect past trends in demographics prior to the significant socioeconomic disruptions stemming from the COVID‑19 pandemic.
The Ontario Ministry of Finance projections provide three growth scenarios for the population of the province to 2046. The medium-growth, or reference scenario, presented in this chapter is considered most likely to occur if recent trends continue. The low- and high-growth scenarios provide a forecast range based on plausible changes in the components of growth.
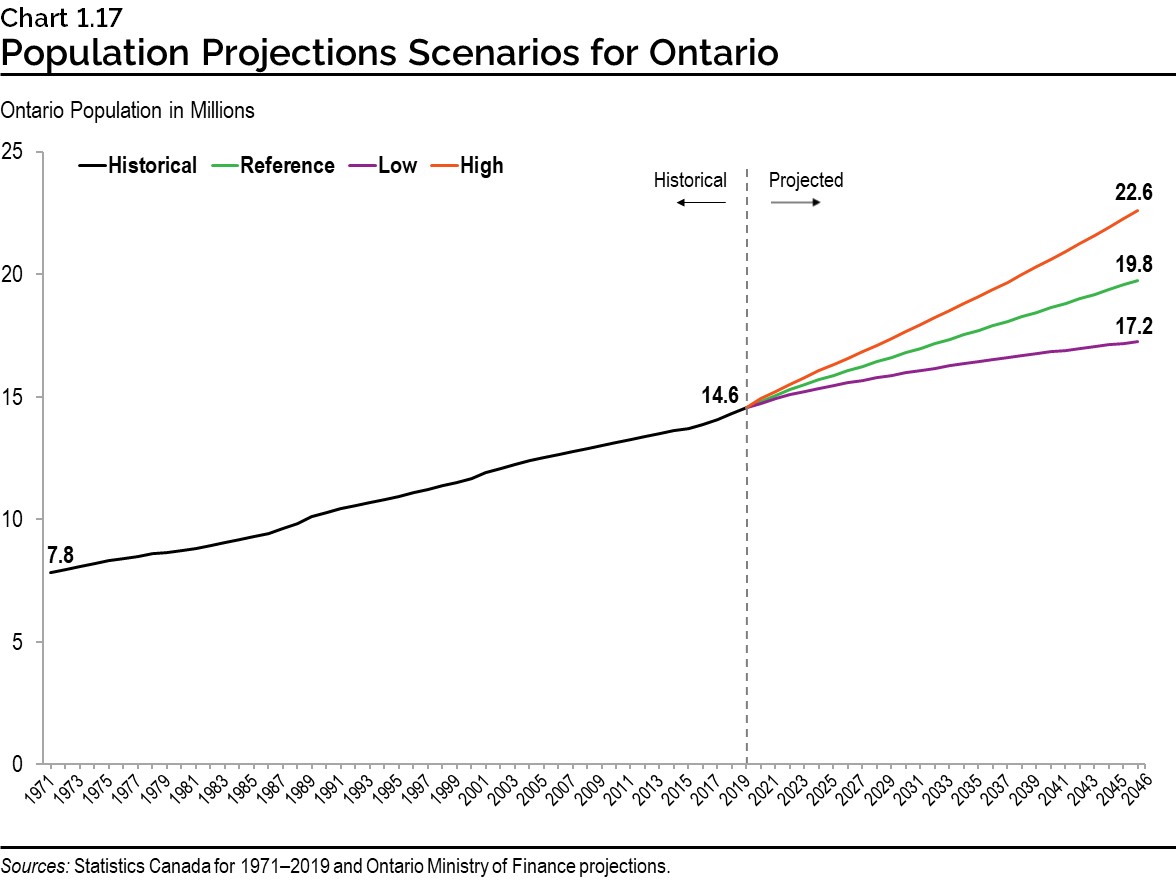
Under all three scenarios, Ontario’s population is projected to experience growth over the 2019 to 2046 period. In the reference scenario, population is projected to grow 35.6 per cent, or almost 5.2 million, over the next 27 years from an estimated 14.6 million on July 1, 2019 to almost 19.8 million on July 1, 2046.
In the low-growth scenario, population increases 18.4 per cent, or 2.7 million, to reach over 17.2 million people by 2046. The age profile of the population is older in this scenario as a result of lower fertility and fewer immigrants.
In the high-growth scenario, population grows 55.3 per cent, or 8.1 million, to 22.6 million people by the end of the projection period. In this scenario, population aging takes place at a slower pace as a result of higher fertility and more immigrants.
| Low Scenario | Reference Scenario | High Scenario | |
|---|---|---|---|
| 2046 Population | 17,246,055 | 19,759,472 | 22,619,901 |
| Population Growth (2019 to 2046) | 2,679,508 | 5,192,925 | 8,053,354 |
| Population Growth Rate (total 2019 to 2046) | 18% | 36% | 55% |
| Population Growth Rate (average annual 2019 to 2046) | 0.63% | 1.14% | 1.64% |
| Natural Increase (total 2019 to 2046) | 44,777 | 943,300 | 1,993,384 |
| Natural Increase Rate (average annual 2019 to 2046) | 0.02% | 0.21% | 0.40% |
| Net Migration (total 2019 to 2046) | 2,675,376 | 4,242,360 | 6,004,173 |
| Net Migration Rate (average annual 2019 to 2046) | 0.62% | 0.92% | 1.23% |
| Share of 0 to 14 Age Group in 2046 | 13.1% | 14.7% | 16.3% |
| Share of 15 to 64 Age Group in 2046 | 62.1% | 61.9% | 61.5% |
| Share of 65+ Age Group in 2046 | 24.8% | 23.4% | 22.2% |
Source: Ontario Ministry of Finance projections.
Ontario Ministry of Finance Population Projections in Perspective
Both Statistics Canada and the University of Toronto also develop detailed population projections for Ontario. To the mid-2040s, Statistics Canada is projecting slightly slower growth, as a result of an assumption of lower natural increase and fewer non-permanent residents, compared to the reference scenario of the Ontario Ministry of Finance. The University of Toronto is projecting slightly faster growth due to an assumption of higher fertility and more non‑permanent residents.
| Statistics Canada 2019–2043 | Ministry of Finance 2019–2046 | University of Toronto 2019–2046 | |
|---|---|---|---|
| Average Annual Population Growth | 0.95 | 1.14 | 1.25 |
Note: University of Toronto projections are from the Policy and Economic Analysis Program (PEAP, November 2019).
Potential Implications of COVID‑19 on Ontario’s Demographics
Given that these scenarios were developed before the COVID‑19 pandemic, it is important to assess the potential impact that the pandemic may have on Ontario’s population and demographics.
Given the travel restrictions put in place to contain COVID‑19, there will also be a potential impact on population growth coming from migration. Immigration, Refugees and Citizenship Canada is continuing to accept and process some permanent residence applications, focusing on applicants who are most likely already in Canada among those in the Express Entry system. However, the federal department indicated that reaching the full 2020 official target for immigration will be a challenge, given the current travel restrictions and the fact that its domestic and international operations are now working at reduced capacity, which will impact processing times. The arrival of new temporary residents is also likely to slow temporarily for the same reasons. For example, if net international immigration into the province is reduced by 50 per cent in 2020–21, population growth for the year would be reduced from 242,000 to 148,000, and the population growth rate would decline from 1.6 per cent to 1.0 per cent.
While population growth is likely to be slower than previously anticipated over the next two years, the magnitude of the deceleration will largely depend on the length of time over which travel restrictions persist, and the timeline for resumption of normal operations of governments and businesses.
Given that immigration is by far the largest contributor to population growth in Ontario, it is most likely that long-term demographic trends would return to their previously projected path once the current disruptions subside. Canada and Ontario specifically will remain attractive destinations for immigrants going forward. As such, there is moderate potential for the long-term demographic outlook presented in this document to be permanently affected, beyond the expected short-term disruptions.
Chart Descriptions
Chart 1.1: Growth Rate of Ontario’s Population, 1971 to 2046
This bar chart shows the growth rate of Ontario’s population from 1971 to 2046. The annual growth rate increased significantly over the past few years, reaching 1.7 per cent in 2018–19. Over the projection period, the annual growth rate declines rapidly in the short term to return to a more normal pattern, reaching 1.1 per cent by 2026–27. Over the rest of the projection period, the annual growth rate declines slowly to reach 1.0 per cent by 2045–46.
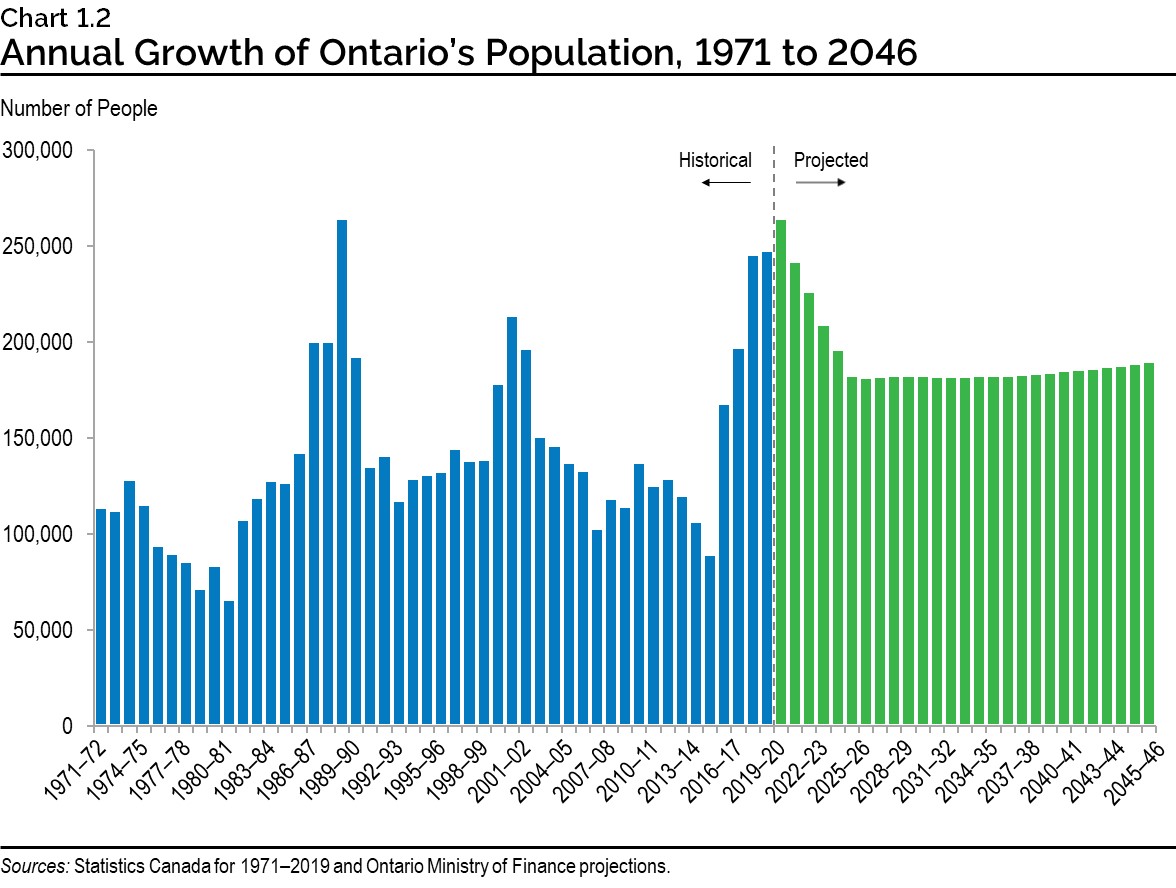
Chart 1.2: Annual Growth of Ontario’s Population, 1971 to 2046
This bar chart shows the annual growth of Ontario’s population from 1971 to 2046. The annual growth increased significantly over the past few years, reaching 248,002 in 2018–19. Over the projection period, the annual growth declines rapidly in the short term to return to a more normal pattern, reaching 182,264 by 2026–27. Over the rest of the projection period, annual growth increases slowly to reach 189,898 by 2045–46.
Chart 1.3: Population Growth Rate, Selected Countries, 1998 to 2018
This bar chart shows the average annual population growth rate of selected countries over the 1998 to 2018 period. Among jurisdictions, Australia was highest at 1.46 per cent, followed by New Zealand at 1.20 per cent, Ontario at 1.16 per cent, Canada at 1.04 per cent, the United States at 0.85 per cent, Spain at 0.75 per cent, Sweden at 0.70 per cent, the United Kingdom at 0.64 per cent, South Korea at 0.55 per cent, France at 0.54 per cent, the Netherlands at 0.46 per cent, Denmark at 0.45 per cent, Italy at 0.30 per cent, Germany at 0.05 per cent and Japan at 0.01 per cent.
Chart 1.4: Natural Increase and Net Migration in Ontario, 1971 to 2046
This chart shows the annual level of natural increase and net migration in Ontario from 1971 to 2046. It shows that in recent years, net migration increased significantly, reaching 211,369 in 2018–19, while natural increase was 36,633. Over the projection period, net migration declines rapidly in the short term to return to a more normal pattern by 2023–24 at 149,420, with natural increase at 46,957. By the end of the projection period in 2045–46, net migration reaches 169,239, while natural increase declines to 20,659.
Chart 1.5: Annual Immigration to Ontario, 1971 to 2046
This bar chart shows annual immigration levels to Ontario from 1971 to 2046. In recent years, immigration to the province increased significantly, reaching 139,071 in 2018–19. Over the projection period, annual immigration is projected to continue increasing to reach 185,910 by 2045–46.
Chart 1.6: Age Distribution of Immigrants to Ontario, 2018–19
This bar chart shows the age distribution of immigrants to Ontario in 2018–19. Two-thirds (67 per cent) of all immigrants who settled in the province were between the ages of 18 and 44. The median age of 2018–19 newcomers was 29 years, compared to 40 years for the resident population.
Chart 1.7: Net Interprovincial Migration to Ontario, 1971 to 2019
This bar chart shows annual net interprovincial migration to Ontario from 1971 to 2019. It shows successive periods of net gains followed by successive periods of net losses. For the last period (2018–19), Ontario recorded a net gain of 11,731 people from the rest of Canada.
Chart 1.8: Projected Regional Population Growth, 2019 to 2046
This map shows projected regional population growth in Ontario from 2019 to 2046. Northwestern Ontario’s population is projected to grow from 243,044 in 2019 to 249,193 in 2046. Over the same period, the population of Northeast Ontario is projected to grow from 568,361 to 578,593, the Southwest from 1,706,472 to 2,095,285, Central Ontario from 3,160,438 to 4,182,044, Eastern Ontario from 1,905,316 to 2,412,295, and the Greater Toronto Area from 6,982,916 to 10,242,062.
Chart 1.9: Population of the Greater Toronto Area, 1986 to 2046
This chart shows the total population of the Greater Toronto Area from 1986 to 2046. It grew from 3.9 million in 1986 to 7.0 million in 2019 and is projected to reach 10.2 million in 2046. It also shows the share of Ontario’s population accounted for by the Greater Toronto Area, which was 41.4 per cent in 1971, 47.9 per cent in 2019 and is projected to be 51.8 per cent in 2046.
Chart 1.10: Population Growth Rate in the 10 Most Populous Metropolitan Areas in North America, 2018–19
This bar chart shows 2018–19 population growth rates for the 10 most populous metropolitan areas in North America. Toronto grew fastest at 2.0 per cent, followed by Dallas-Fort Worth-Arlington at 1.6 per cent, Houston-The Woodlands-Sugar Land at 1.3 per cent, Atlanta-Sandy Springs-Roswell at 1.3 per cent, Washington-Arlington-Alexandria at 0.5 per cent, Miami-Fort Lauderdale-West Palm Beach at 0.4 per cent, Philadelphia-Camden-Wilmington at 0.2 per cent, Los Angeles-Long Beach-Anaheim at −0.3 per cent, Chicago-Naperville-Elgin at −0.3 per cent, and New York-Newark-Jersey City at −0.3 per cent.
Chart 1.11: Total Fertility Rate in Ontario, 1921 to 2046
This bar chart shows the total fertility rate in Ontario annually from 1921 to 2046. It shows the baby boom period from 1946 to 1965. It also shows that the provincial fertility rate fell below the cohort replacement level of 2.1 children per woman in 1972. Since the late 1970s, the total fertility rate in Ontario has been fairly stable and is projected to remain so to 2046.
Chart 1.12: Life Expectancy at Birth in Ontario, 1986 to 2046
This line chart show life expectancy at birth for males and females in Ontario from 1986 to 2046. For males, life expectancy went from 73.7 years in 1986 to 80.3 years in 2017 and is projected to reach 86.0 years by 2046. For females, life expectancy went from 80.0 years in 1986 to 84.4 years in 2017 and is projected to reach 88.5 years by 2046.
Chart 1.13: Age Composition of Ontario’s Population, 1971 to 2046
This area chart shows the age distribution of Ontario’s population from 1971 to 2046. The proportion of children aged 0 to 14 years went from 28.4 per cent in 1971 to 15.7 per cent in 2019 and is projected to reach 14.7 per cent by 2046. The proportion of core-age population aged 15 to 64 years went from 63.3 per cent in 1971 to 67.1 per cent in 2019 and is projected to reach 61.9 per cent by 2046. The proportion of seniors aged 65+ went from 8.3 per cent in 1971 to 17.2 per cent in 2019 and is projected to reach 23.4 per cent by 2046.
Chart 1.14: Distribution of the Population of Seniors in Ontario, 1971 to 2046
This area chart shows the distribution of the population of seniors in Ontario from 1971 to 2046. The total number of seniors went from 651,000 in 1971 to 2.5 million in 2019 and is projected to reach 4.6 million by 2046. The older senior age groups are projected to grow faster than the group aged 65 to 74 years. The 85+ age group is projected to grow fastest over the projection period.
Chart 1.15: Proportion of Seniors, Selected Countries, 2018
This bar chart shows the proportion of seniors in selected countries in 2018. Japan had the highest proportion at 27.6 per cent, followed by Italy at 22.8 per cent, Germany at 21.5 per cent, Sweden at 20.1 per cent, France at 20.0 per cent, Denmark at 19.8 per cent, Spain at 19.4 per cent, the Netherlands at 19.2 per cent, the United Kingdom at 18.4 per cent, Canada at 17.1 per cent, Ontario at 16.9 per cent, the United States at 15.8 per cent, Australia at 15.7 per cent, the Russian Federation at 14.7 per cent, South Korea at 14.4 per cent, China at 10.9 per cent, Brazil at 8.9 per cent, and Mexico at 7.2 per cent.
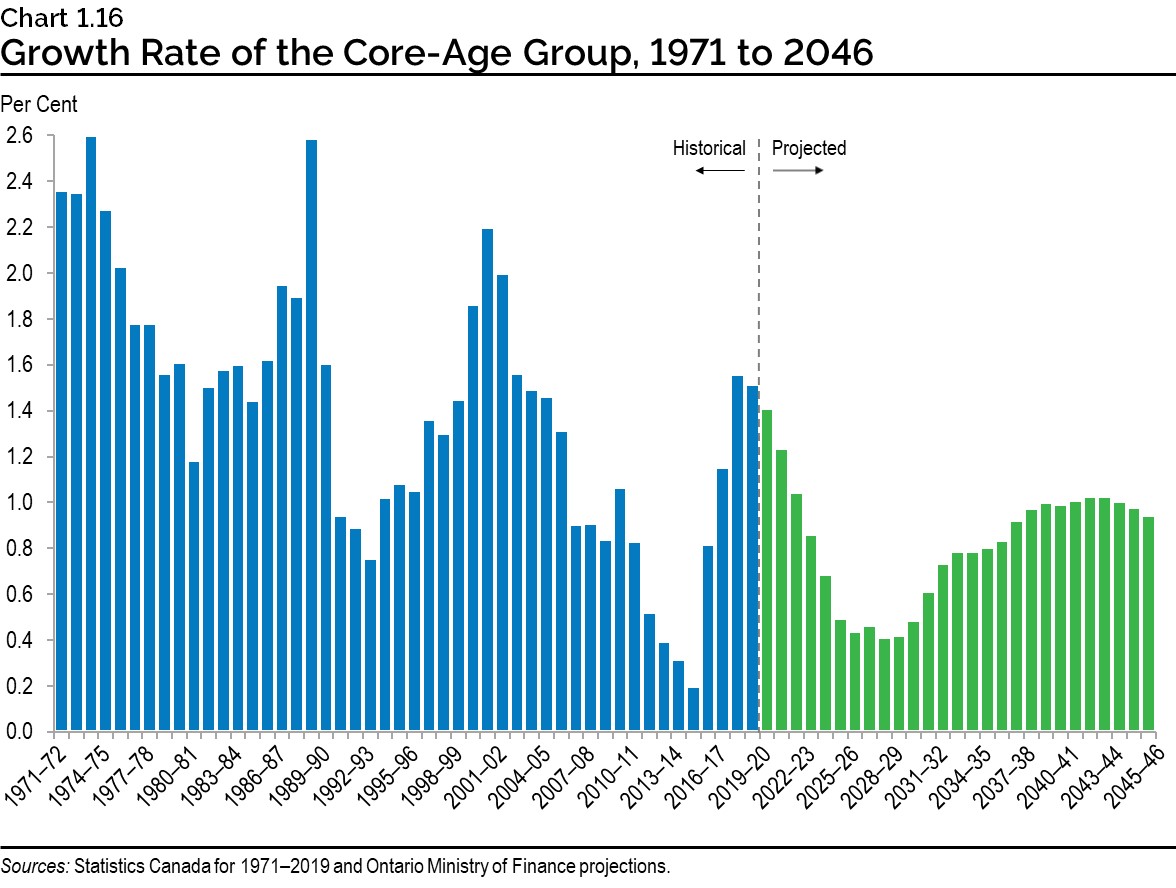
Chart 1.16: Growth Rate of the Core-Age Group, 1971 to 2046
This bar chart shows the growth rate of the core-age group in Ontario from 1971 to 2046. Recently, the annual growth rate of this age group increased, but it is projected to experience a period of slow growth over the late 2020s, before returning to annual growth of about 1 per cent at the end of the projection period.
Chart 1.17: Population Projections Scenarios for Ontario
This line chart shows the population projection scenarios for Ontario prepared by the Ministry of Finance. It shows that Ontario’s population grew from 7.8 million in 1971 to 14.6 million in 2019. At the end of the projection period in 2046, the provincial population would reach 22.6 million under the high-growth scenario, 19.8 million under the reference scenario, and 17.2 million under the low-growth scenario.
Footnotes
- footnote[1] Back to paragraph Ontario Population Projections, 2018-2046 (summer 2019): https://www.fin.gov.on.ca/en/economy/demographics/projections/
- footnote[2] Back to paragraph This report uses the same end year of 2046 as the Ontario Population Projections, 2018–2046, as it is 30 years from the Census base of 2016.
- footnote[3] Back to paragraph The cohort replacement fertility level (total fertility rate of 2.1) is the average number of children per woman that is needed to keep the population constant at given mortality rates with no outside migration.