Ontario’s context
Ontario’s housing context, challenges and needs
People across Ontario continue to struggle to find housing that meets their needs and their budget. Home prices and rents in many cities have begun rising again after a pandemic-induced pause — home prices have in fact reached record levels and are out of reach of even many middle-class people.
At the same time, the pandemic has exposed some weaknesses in the province’s social safeguards, particularly in its attempt to keep people safe in shelters and provide adequate housing for the most vulnerable people.
While most Ontario households live in acceptable housing — housing which is affordable, does not require major repairs, and is not overcrowded — the proportion of people experiencing challenges accessing acceptable housing has grown over the past several years. Some of these issues predate the pandemic and most critically, housing need is more prevalent among some of Ontario’s most vulnerable groups.
Housing challenges faced by Ontarians relate to affordability, supply, and support services including:
- affordability challenges, as house prices and rents have risen much faster than household incomes, creating a widening affordability gap
- insufficient supply, as substantial new rental construction is needed to keep up with population growth and demand
- significant demand for supportive housing/support services, such as counselling and life skills training, that some people need to maintain their housing
- aging social and affordable housing stock, as a large proportion of the most affordable housing, especially rental and government-subsidized housing, is 40 years old or more and at risk of loss due to poor condition and expiring obligations to provide subsidized housing
In addition, Ontario has a very high level of housing need (as measured through the CMHC indicator of Core Housing Need).
The following sections discuss each challenge in detail.
Housing affordability
While the proportion of households experiencing suitability and adequacy issues has remained relatively stable over the past 10 years, the proportion who do not live-in housing that is affordable has increased. Aside from the short pause caused by the pandemic, rents and house prices have increased rapidly over this period but incomes have not risen at the same rate.
Income growth has been modest since 2000, especially for renters. Adjusted for inflation, median Ontario renter household income has increased 9.5%, while owner income has risen 14.6% (Ontario Ministry of Finance). While incomes have risen faster in the Toronto area, this area has also experienced higher price and rent growth than in most of the country.
Rental housing has traditionally provided the more affordable housing option in Ontario, especially in urban areas. However, affordability of rental housing has eroded as rent growth has remained high for the past decade. Only a small portion of new housing construction over the past three decades has been purpose-built rental, putting additional pressure on existing supply.
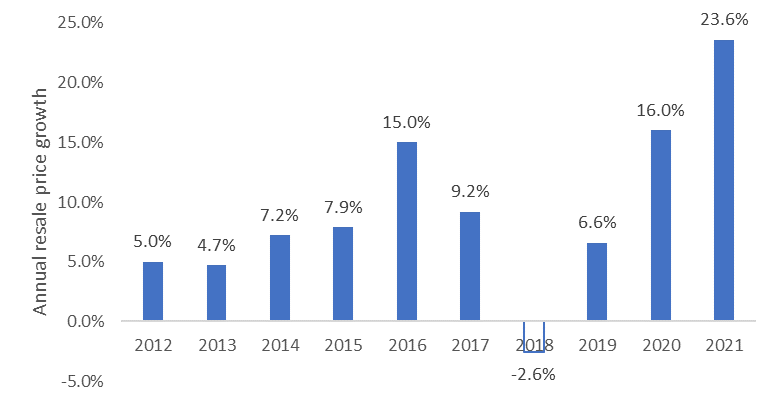
The following chart shows year-over-year average resale price growth in Ontario for residential Multiple Listing Service (MLS) sales from 2012–2021:
Table 1: MLS sales resale price growth from 2012–2021
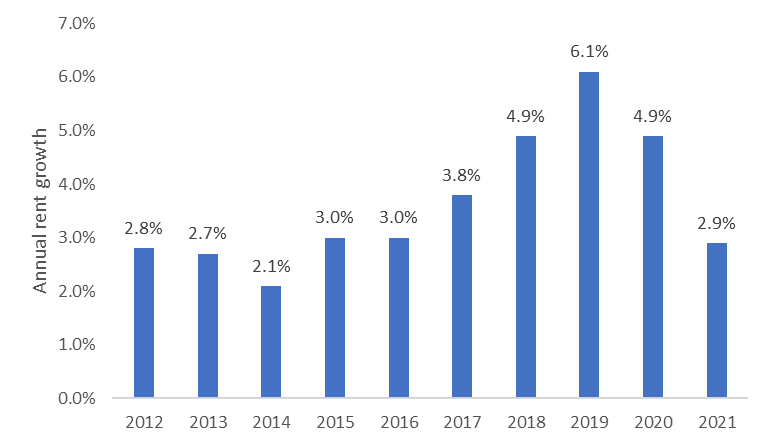
Another source of reduced affordability is rising residential rents, particularly for purpose-built apartments as they tend to be somewhat more affordable than rates in other types of rental dwelling (such as condo rentals). The following chart shows year-over-year growth in average market rents for purpose-built apartments in Ontario from 2011-2020:
Table 2: Average market rents for purpose-built apartments from 2012–2021
Housing supply
A key objective of the NHS programs is to increase the supply of affordable rental housing through the creation of new units and the preservation of existing units.
Need for creating new market rental housing
Rental housing construction in Ontario has lagged behind demand over the past two decades, contributing to tight market conditions and the need for more new rental supply, especially in the Toronto area. Since 2000, only 7.7% of all housing completions in Ontario have been purpose-built rentals, compared to 14.9% for the previous decade (1990–1999). There are signs this trend is improving, however — both 2020 and 2021 had higher rental completions than any year since 1992.
Condominium developments are still providing most of the new rental supply. Since 2000, 30.2% of housing completions have been condominium units, and about one-third of condominium units are rented in major Ontario centres. These condominium units usually have higher average monthly rents. In the Toronto area, condominium apartments have average monthly rents 49% higher than purpose-built apartments.
Through the NHS’s Ontario Housing Priorities Initiative (OHPI), Service Managers and Indigenous Program Administrators have the flexibility to use program funding towards the creation of new affordable rental housing.
Need for creating new community housing
Community housing makes up more than 20% of all purpose-built rental housing stock in Ontario. Before the launch of NHS programs in 2019, no new social housing had been constructed through social housing programs in Ontario since 1995, although some housing providers created units under affordable housing programs.
As community housing providers’ historical operating agreements expire, mortgages mature and buildings age, there is a risk of losing community stock because some providers’ financial sustainability is at risk.
Ontario’s Community Renewal Housing Strategy leverages the National Housing Strategy to prevent the loss of community housing stock and, over time, to grow the stock to help meet the demand for subsidized housing.
As of December 2020, Service Managers reported the number of households on Centralized Waitlists for social housing in Ontario as estimated to be 168,546
Need for preserving market rental housing
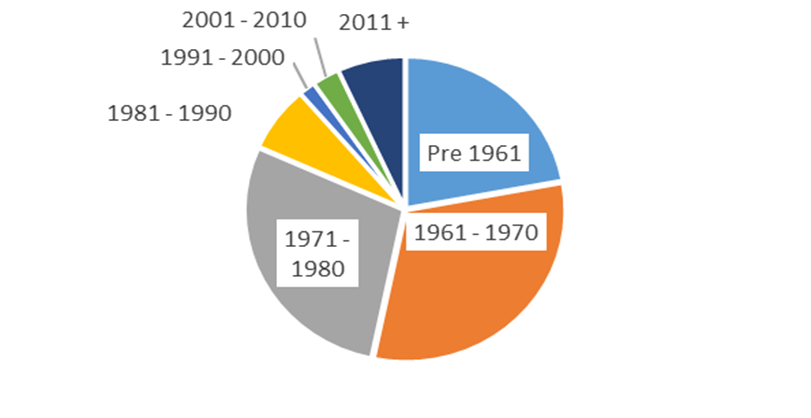
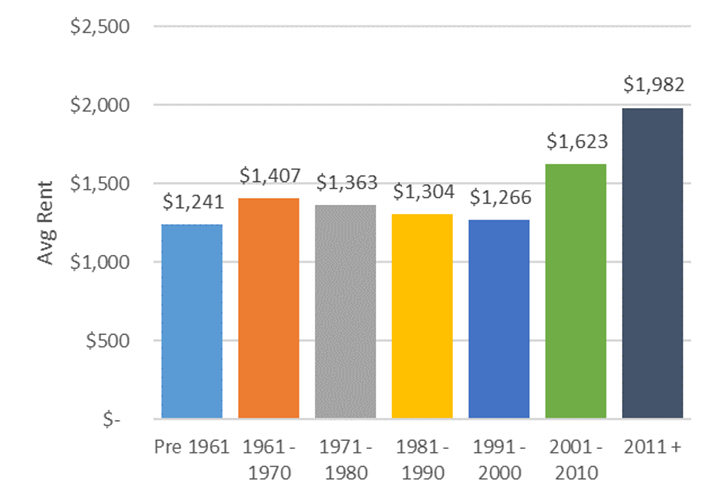
Most of Ontario’s purpose-built rental supply is now 40 years old or more—82% of all purpose-built units were built in 1980 or earlier. This aging stock is a much more affordable segment of the market rental sector, with a noticeable jump in average rent for units built since 2000. The next two charts provide evidence of these developments:
The chart below shows the proportion of purpose-built rental units in Ontario, grouped by year of construction: pre-1961: 22%; 1961–1970: 31%; 1971–1980: 28%; 1981–1990: 7%; 1991–2000: 2%; 2001–2010: 3%; 2011+: 7%
This chart shows average market rents for purpose-built rental units in Ontario, grouped by year of construction:
Need for preserving community housing
Many of the housing system’s older units are at risk of sitting vacant and unfit for occupancy due to poor condition and a growing backlog of repairs, especially in the community housing sector. While 6% of Ontario households report that their dwelling required major repairs in 2016, this figure was 8.7% for renter households, and 11.1% among renter households in subsidized housing (Statistics Canada, 2016 Census). In each case these rates are significantly higher for units built in 1980 or earlier.
In addition to the risk of losing this supply due to poor condition, some of Ontario’s deeply affordable community housing stock may be at risk if it is converted to market-rate rentals after provider operating agreements expire or their mortgage matures. A housing provider may choose to leave the community housing system at the end of their original obligations because the current community housing framework is too prescriptive and complex.
As part of multi-year Community Housing Renewal Strategy, the Province is introducing measures that will incent community housing providers to stay in the system once their original obligations end. The Ministry is working in partnership with the community housing sector to develop an improved regulatory environment for Service Managers and housing providers to deliver community housing, improve access to community housing, and grow supply by enabling new community housing providers to enter into the regulatory framework.
Supportive housing and homelessness
Access to appropriate and affordable housing is a challenge across the province, particularly for those who need ongoing supports to remain housed (for example, those with mental health issues). In addition, the protracted economic recovery has put more people at risk of homelessness (such as, impact of sustained reductions in or loss of income and increase in rent arrears).
The COVID‑19 pandemic has increased pressure on Ontario’s homelessness sectors. Given the high-risk nature of congregate care settings, including emergency shelters, service delivery has been modified to implement public health requirements to protect the health and safety of clients and staff, with increased cost. The sector is shifting from a focus on short-term emergency shelter assistance to creating longer-term housing solutions, as more effective and more cost-effective solutions to address homelessness.
Homelessness services in Ontario are funded through a combination of provincial, federal and municipal investments. The province has historically provided approximately 60% of the funding for homelessness programs (municipal 30%, federal 10%). Additional long-term investments are needed to increase supply to address long-term housing needs and to help prevent homelessness.
Providing support services to affordable and social housing tenants is an eligible funding activity under NHS’s Ontario Priorities Housing Initiative (OPHI).
Housing need and impacts on vulnerable populations
Two different measures of poverty and housing need, Core Housing Need (CHN) and the Low-Income Measure-After Tax (LIM-AT), suggest about 15% of Ontarians fall below the threshold for each measure, with about 750,000 households in CHN and 1.9 million people below the LIM-AT.
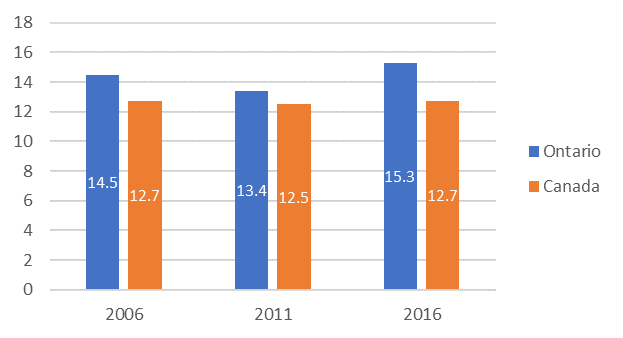
As of 2016, Ontario households experienced one of the highest rates of CHN among PTs, with 15.3% of all households in CHN. This rate has risen nearly a full point over the past decade (from 14.5% in 2006), while Canada’s overall rate has remained steady at 12.7%. The most common reason for a household to be in CHN is affordability challenges: 75% of CHN in Ontario is due to unaffordability alone.
Another way of looking at Ontario’s high rate of CHN is by considering the provincial share of all CHN households across the nation. When assessed this way, Ontario contains just over 44% of all Canadian households in need. This is by far the highest rate across Canada (Quebec is in second place with 18%).
The following chart compares the percentage of households in Core Housing Need for Ontario and Canada from 2006–2016:
Core housing need and deep core housing need — select demographic groups
When these two indicators of housing need are analyzed by certain subsets of the population (seniors, Indigenous people and immigrants), there are differences in how need is distributed, and the factors contributing to need are more significant:
| Indicator | All Ontarians | Seniors | Indigenous | Immigrants and Refugees |
|---|---|---|---|---|
| Households in core housing need | 748,310 | 217,305 | 32,260 | 336,875 |
| % Households in core housing need | 15.3 | 17.0 | 19.0 | 20.1 |
| % Households below affordability standard | 24.6 | 24.9 | 25.6 | 33.3 |
| % Households below suitability standard | 5.9 | 1.9 | 5.7 | 11.0 |
| % Households below adequacy standard | 6.0 | 4.5 | 11.7 | 5.1 |
| % Households in deep core housing need | 6.4 | 5.7 | 7.2 | 8.3 |
Source: Canada Mortgage and Housing Corporation
Seniors
Senior-led households have slightly elevated levels of need overall (17%) compared to all Ontario households (15.3%), but lower levels of unsuitability and inadequacy. Shelter costs for senior-led households are 31% lower than the overall average, so the affordability problems that this group experiences can be generally attributed to lower incomes.
An estimated 75,000 seniors currently live in social housing, approximately 30% of all social housing tenants, with another estimated 50,000 on social housing wait lists. As this population continues to increase, more accessibility supports will be needed for seniors to age in place.
Indigenous households (off-reserve)
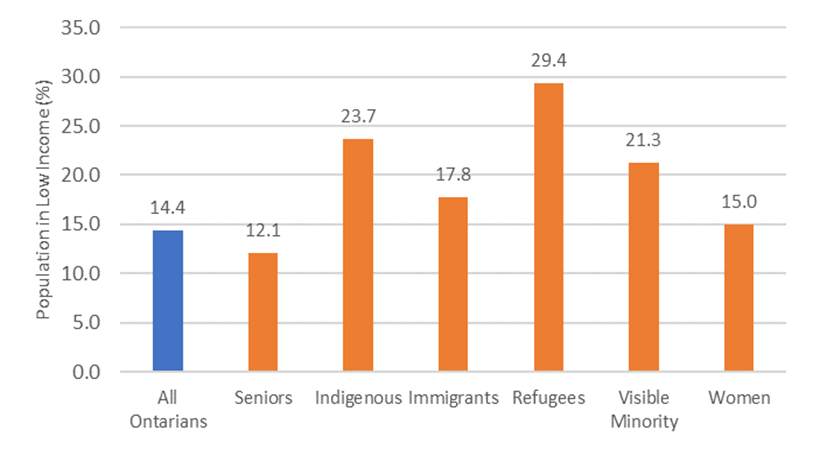
Indigenous-led households living off-reserve experience significantly higher rates of Core Housing Need and deep core housing need. These households experience nearly twice the average rate of adequacy problems (11.7% vs. 6.0% overall). Nearly one-quarter (23.7%) of Indigenous individuals in Ontario were living below the low-income measure threshold in 2016.
Data shows that Indigenous households constitute 2.6% of all households in Ontario, but a higher proportion live in social housing (4.6%) and affordable housing (4%).
Immigrants and refugees
The pattern of need for immigrant households is different from other households. The rate of adequacy problems is better than average, however they experience more issues with suitability (11.0% vs. 5.9% overall), indicating that many immigrant households cannot find housing with enough space for the number of occupants.
Over 450,000 refugees live in Ontario (about 12% of all Ontario immigrants and 3.4% of the Ontario population). Refugees live on significantly lower incomes on average than the population as a whole, with a median income 29% lower than the overall median. Nearly 30% are living below the low-income measure threshold.
Proportion of Ontario’s population in low-income measurement after tax (LIM-AT) for select demographics
The following chart shows the proportion of Ontario’s population falling below the LIM-AT by demographic group for 2016 (latest year available):
Visible minorities
Visible minorities comprise 29% of Ontario’s population and live on 26% less median income than the population as a whole. Close to one-fifth (21.3%) live below the low-income measure threshold.
Women
Women in Ontario live on 28% lower median income than men overall, but experience only slightly higher rates of low income (15% vs. 13.8%). One area of concern is lone-parent households. Women make up the vast majority of this group, which has a particular challenge of sufficient space. This is linked to the affordability challenges of single-income households.
Ontarians experiencing mental illness or substance dependence
While information on the housing situation of Ontarians experiencing mental illness or substance dependence is not available, these issues affect a large segment of the population. In 2020, 10.7% of Ontarians rated their perceived mental health as “fair” or “poor”, 9.4% reported a mood disorder and 15% reported heavy drinking (Statistics Canada, Canadian Community Health Survey 2020). Mental health and substance dependence issues may contribute to difficulty accessing stable housing, and in some cases, households will require housing with supports.
Footnotes
- footnote[1] Back to paragraph Considering that individual households can be on multiple Service Manager waiting lists, this number represents an estimated unduplicated count of the number of households waiting for social housing across the province, which the Ministry began collecting in 2020.