Appendix - Detailed Maps of the Study Watersheds

Figure A-1: Avon River watershed.

Location and general characteristics of the study watersheds, providing information about land cover in the study watersheds, watershed areas, the larger watersheds in which they are situated, and the lakes to which they ultimately drain. The location refers to the sampling site at the watershed outlet, “NMP” in the last column represent the per cent of farms with a Nutrient Management Plan (data from Ontario Ministry of Agriculture, Foods and Rural Affairs 2005). Wetland, forest, and agriculture areas were derived from the Ontario Land Cover Database.

Enlarge this image

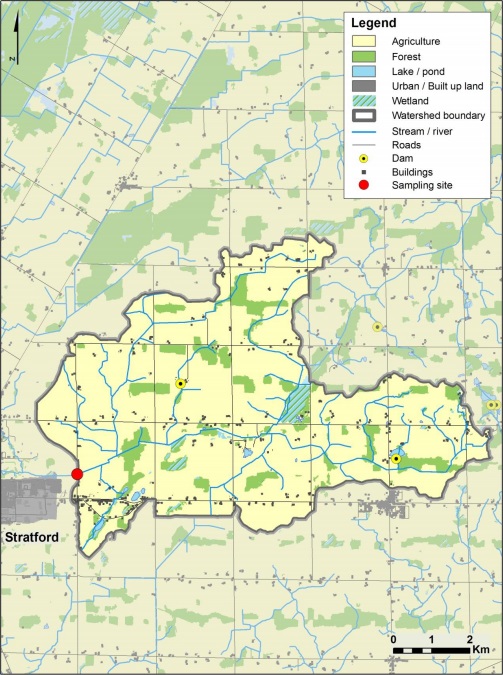
Figure A-2: Blyth Brook watershed. Legend as in Figure A-1.

Environment Canada weather stations used to compile precipitation data for the study watersheds. The table shows where the closest Environment Canada station with suitable data was located relative to each study site, the corresponding Environment Canada Climate Identification code, and the distance to the sampling stations in the study.

Enlarge this image

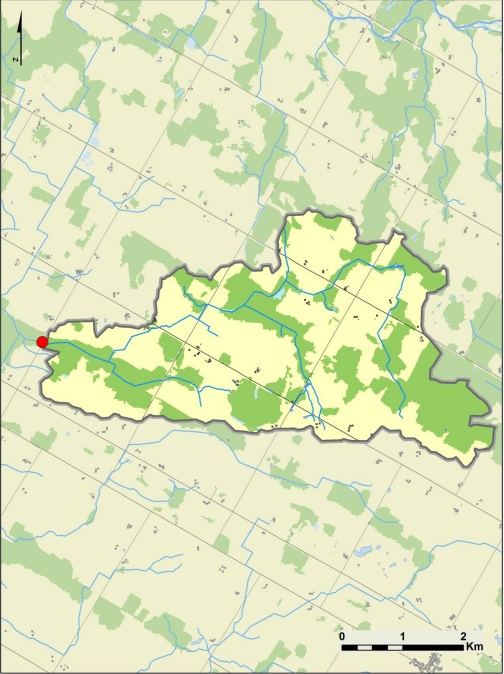
Figure A-3: Falkland Creek watershed. Legend as in Figure A-1.

Livestock categories and manure production values used to calculate manure nitrogen and phosphorus production in the study watersheds. Data are adapted from American Society of Agricultural and Biological Engineers (ASABE) values as applied by Hofmann and Beaulieu (2006). The table shows the conversion factors used to convert estimates of livestock in each study watershed (derived from census data) to livestock mass, total manure production, manure nitrogen, and manure phosphorus.

Enlarge this image

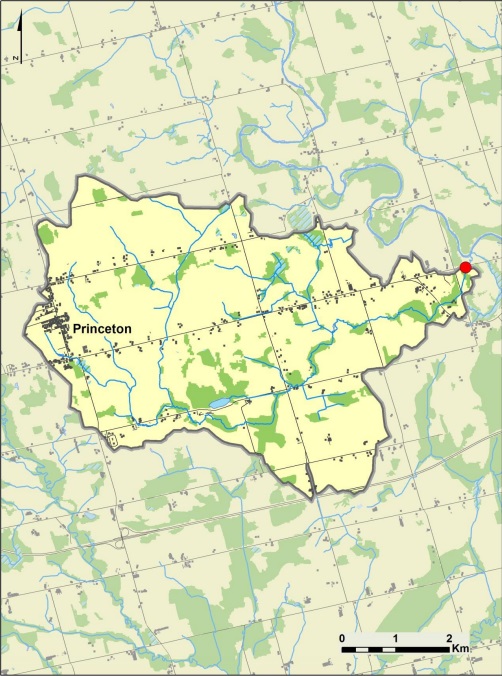
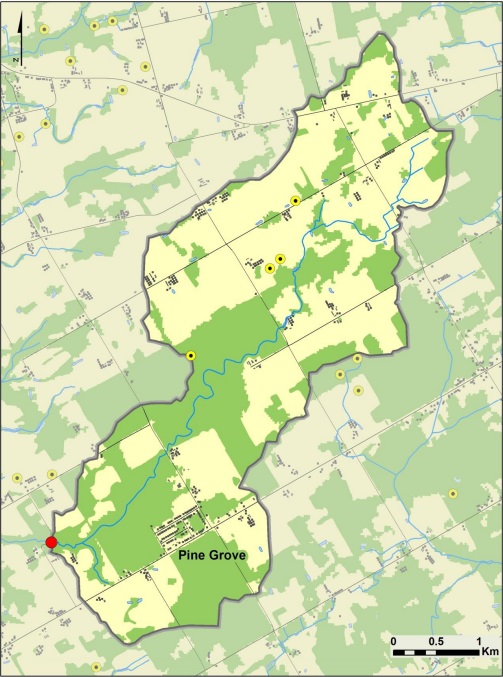
Figure A-4: Griffins Creek watershed. Legend as in Figure A-1.

Relationships between wading discharge measurements at the Nutrient Management sampling sites and the nearest downstream Water Survey of Canada (Hydat) station. Relationships generated were then used to calculate continuous discharge for the corresponding Nutrient Management site. The table shows the conversion factors used to relate discharge measurements taken at the sampling locations in the study to a downstream gauge operated by the Water Survey of Canada. The strength (expressed as the regression coefficient, r squared), is also shown for each station.

Enlarge this image

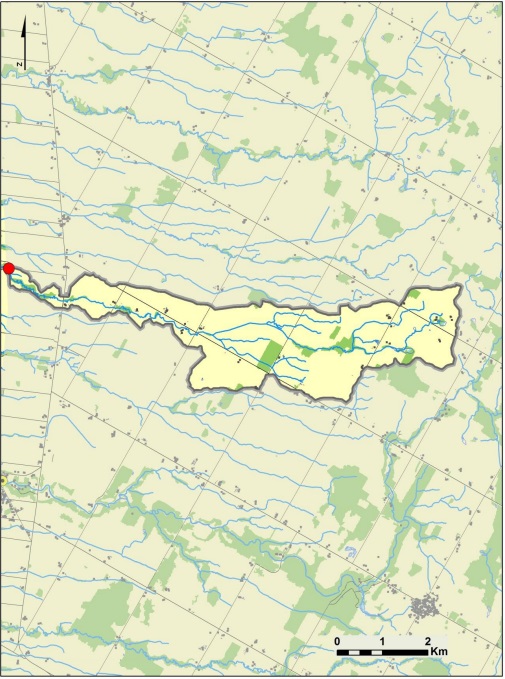
Figure A-5: The Little Ausable River watershed. Legend as in Figure A-1.

Major crop types in the study watersheds expressed as per cent area of entire watershed. The table shows how much of the watershed area was covered by major crop types grown in the study region.

Enlarge this image

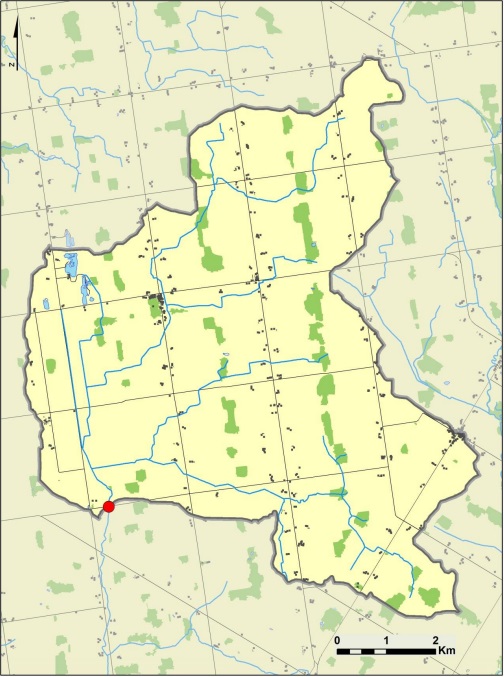
Figure A-6: Middle Maitland watershed. Legend as in Figure A-1.

Animal and manure production in the study watersheds. The table shows estimates of major animal types in each watershed (derived from census data), and estimates of total manure, manure nitrogen, and manure phosphorus produced annually by livestock in each watershed.

Enlarge this image

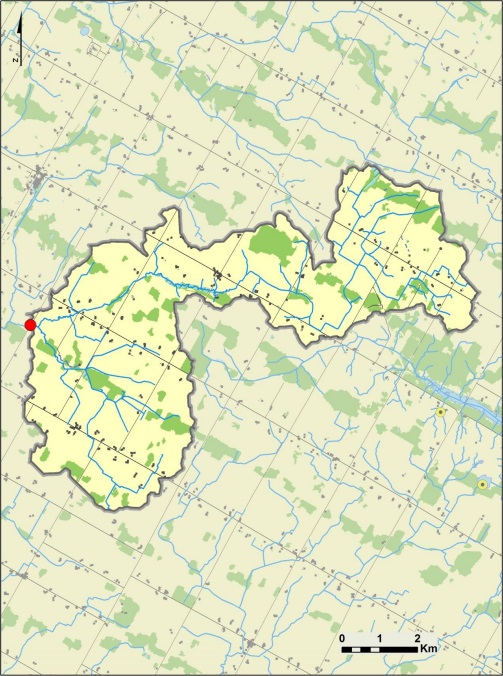
Figure A-7: Muskrat Creek watershed. Legend as in Figure A-1.

Correlation matrix of land use in the study watersheds. Statistically significant (p equals or less than 0.05) relationships are indicated in bold type, where p represents the calculated probability, while r represents the Pearson correlation coefficient, which describes the strength of each relationship. The table shows how livestock numbers (pigs, cattle and poultry) related to crop types (soybean, forage and corn) in the study watersheds.

Enlarge this image

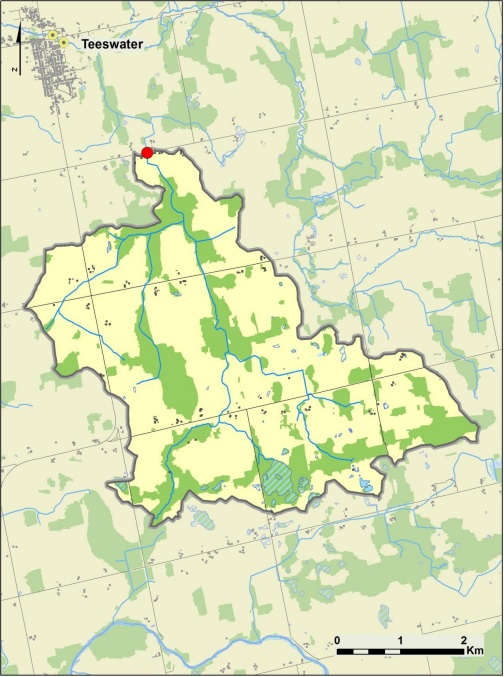
Figure A-8: Nineteen Creek watershed. Legend as in Figure A-1.

Summary of select water quality measures from 2006-2009 across all study streams. “b.d.” denotes values below detection limits of 0.025 microgram Nitrogen per Liter for nitrogen and 4 Colony Forming Units per 100 milliliter for Escherichia coli. Note that for Escherichia coli, concentrations above or below method detection limits were set at the detection limit after determining that these incidences were low. The table shows the summary statistics (minimum, maximum, median, and mean) for various water quality parameters measured in the study.

Enlarge this image

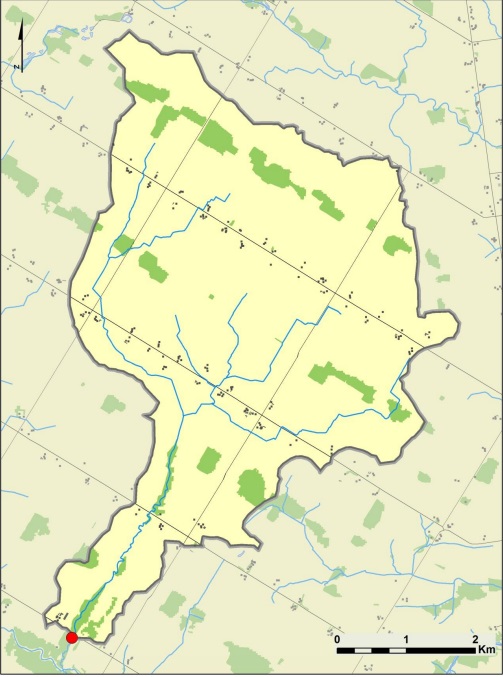
Figure A-9:Nissouri Creek watershed. Legend as in Figure A-1.

Median concentrations (2006-2009) of nitrate and total phosphorus (TP) in the study streams compared to other streams in the same major watersheds. Concentrations of the major watersheds are the grand median of median concentrations from 2003-2007 of all Provincial Water Quality Monitoring Network stations situated within the watershed. Note that Griffins Creek is located in the small Penetangore watershed, adjacent to the Maitland watershed and is grouped under it for convenience. The table shows comparisons in the values of two key water quality measures (nitrate and total phosphorus) between the small headwater study watersheds and the larger watersheds in which they are located.

Enlarge this image

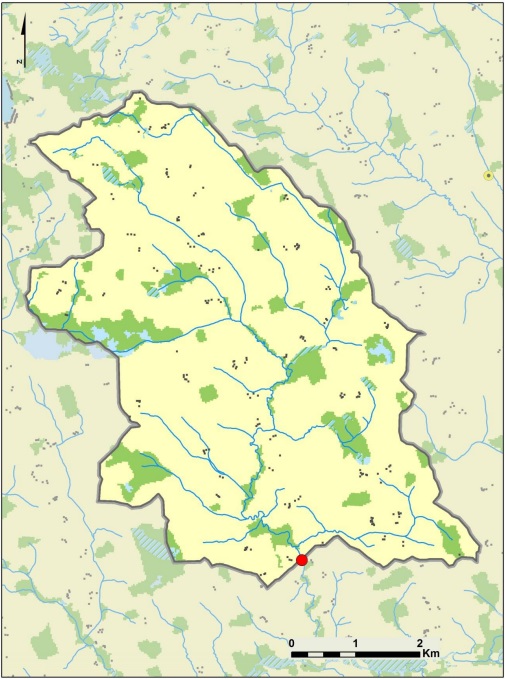
Figure A-10: The South Thames River watershed. Legend as in Figure A-1.

Total Phosphorus exceedances in the study watersheds. Values represent the per cent of days in which the average total phosphorus (TP) concentration (as time-weighted mean concentration) exceeded the Ontario Interim Provincial Water Quality Objective (PWQO) of 30 micrograms per Liter in each year. The table shows how often samples taken from each stream and each year had total phosphorus concentrations higher than the Interim Provincial Water Quality Objective.

Enlarge this image

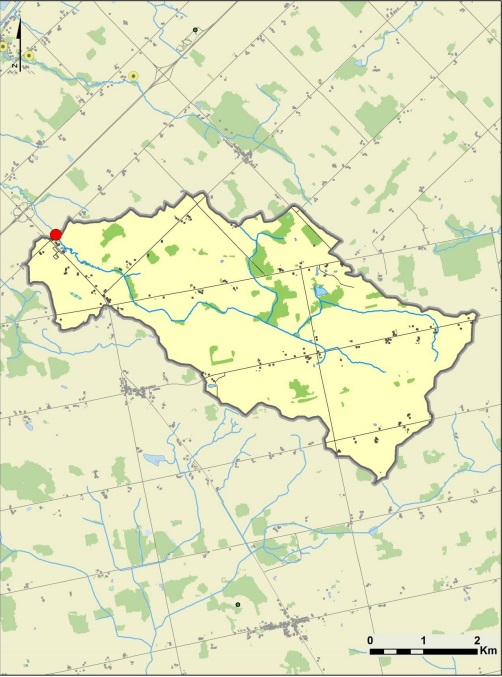
Figure A-11: Salem Creek watershed. Legend as in Figure A-1.

Nitrate exceedances in the study watersheds. Values represent the per cent of days in which the average nitrate nitrogen concentration (as time-weighted mean concentration) exceeded the guideline value for nitrate set by the Canadian Council of Ministers of the Environment (CCME) guideline of 2.93 micrograms per Liter in each year. The table shows how often samples taken from each stream and each year had nitrate nitrogen concentrations higher than the Canadian Council of Ministers of the Environment guideline for the protection of aquatic life for nitrate nitrogen.

Enlarge this image

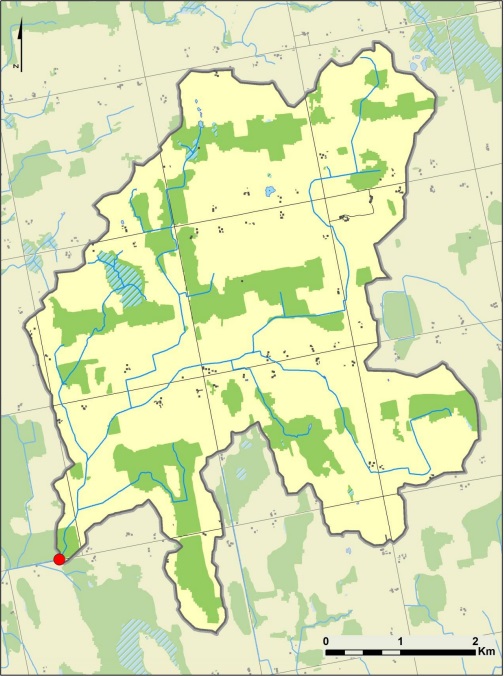
Figure A-12: Silver Creek watershed. Legend as in Figure A-1.

Per cent of discharge and stream loads delivered by season. The table shows a comparison of the per cent of water (discharge) delivered in each operationally-defined season as well as the per cent of nitrate plus nitrite (NO2+NO3), total phosphorus (TP), suspended solids (SS), and Escherichia coli delivered in each season across all study streams.

Enlarge this image

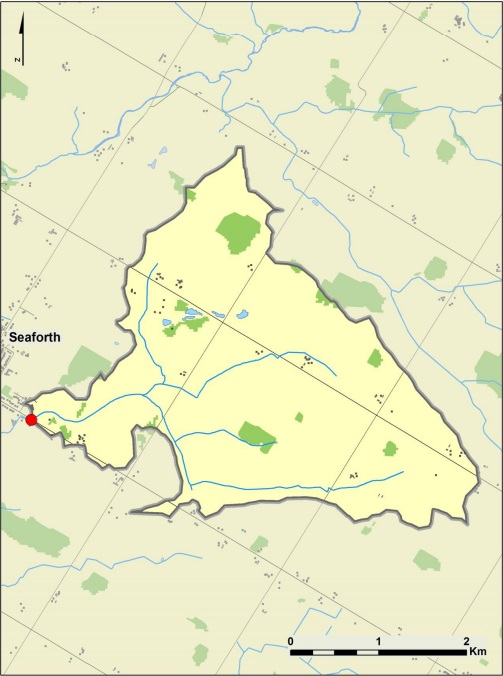
Figure A-13: Stirton Creek watershed. Legend as in Figure A-1.

Correlations between time-weighted mean concentrations of water quality variables and livestock densities in the study watersheds. Significant relationships are indicated in bold type. The table shows the relationships between animal densities of major livestock types in the study watersheds and various measures of water quality. The strength of the relationship is expressed as the Pearson Correlation Coefficient (r), while the statistical significance of each relationship is represented as the calculated probability value (p).

Enlarge this image

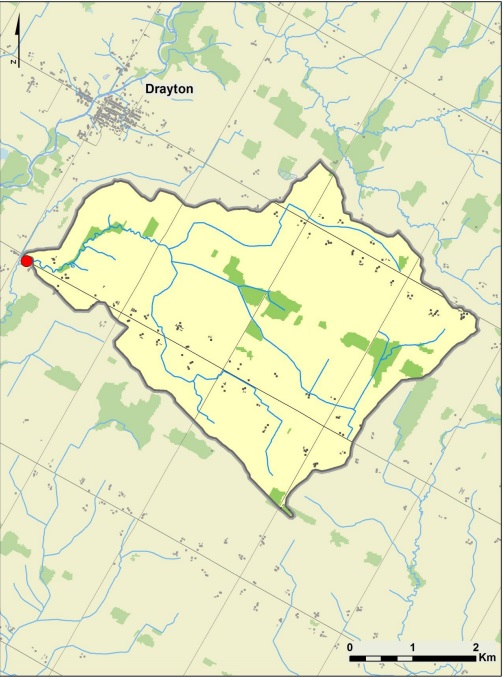
Figure A-14: Thames River watershed. Legend as in Figure A-1.

Correlations between time-weighted mean concentrations of water quality variables and manure production in the study watersheds. Significant relationships are indicated in bold type. The table shows the relationships between estimated manure production, manure nitrogen, and manure phosphorus in the study watersheds versus various measures of water quality. The strength of the relationship is expressed as the Pearson Correlation Coefficient (r), while the statistical significance of each relationship is represented as the calculated probability value (p).

Enlarge this image

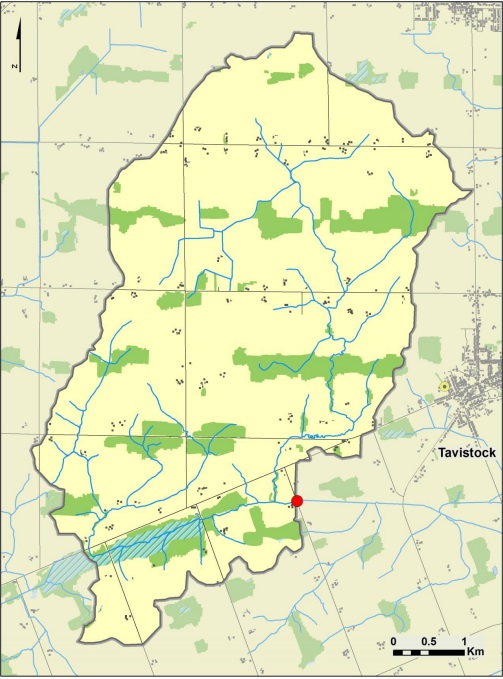
Figure A-15: Trout Creek watershed. Legend as in Figure A-1.

Comparison of loadings from streams of the Nutrient Management study with those of the Pollution from Land Use Activities Reference Group (PLUARG). The table shows how nitrate plus nitrite (NO2+NO3), total phosphorus (TP), and suspended solid (SS) loading in the data from the present study compare to loading estimates from streams sampled in a major study (Pollution from Land Use Activities Reference Group) conducted in 1974-1975. Some of these streams are the same as the streams sampled in the present study, while others were in the same regions defined in the Pollution from Land Use Activities Reference Group studies.

Enlarge this image