Discussion and References
Discussion
Comparison to larger watersheds and the region as a whole
We compared NO3- and TP concentrations in the study streams to the concentrations of these measures in other streams in the same major watershed (monitored as part of the PWQMN) to provide a general context for the concentrations we found in the study streams. Concentrations of NO3- were generally higher (albeit this was often slight) in the study streams than for other streams in the same major watershed. Concentrations of TP showed more variability in comparison to the general PWQMN, with some streams having much higher median TP concentrations than their respective reference watersheds. The PWQMN sites we compared our study streams to are typically on larger streams than those of the present study. The streams of the PWQMN would also have more varied influences in their watersheds, rather than the agricultural dominance of the watersheds in the present study. Comparisons to the streams in our study should be made with these perspectives.
With these varied influences aside, small streams in agricultural regions have been found to have higher nutrient concentrations than the streams that they drain into for several reasons. Firstly, small streams, such as our study streams, are important sites of nutrient transformation. Alexander, Smith, & Schwarz (2000) found that nitrogen removal rates were far higher in small streams than in the larger streams collecting these inputs. They concluded that proximity of sources to large streams was important in determining stream nitrogen concentrations. A similar finding has been made for phosphorus removal in streams (McDowell et al. 2004). Thus, small streams, such as those in the present study, are likely important in reducing the amount of nitrogen and phosphorus delivered to larger receiving streams.
The concentrations of TP in the study streams were also more variable that those measured in their larger watersheds. This greater variability in TP concentrations is likely because TP has a large sediment-bound fraction. Thus, streams, or reaches of streams, can be high in TP from high inputs from land use, high erosion in the watershed or stream banks, or an erosive flow regime. Conversely, TP can also be lost from the water column by a sedimenting flow regime. Additionally, since phosphorus is typically the limiting nutrient in freshwaters, the more labile fractions of TP can also be lost from the water column through rapid uptake by stream biota.
Comparison to pre-impact loading and concentration estimates
The study region as a whole is under considerable human influence. Thus, extant pre-anthropogenic impact baseline values are not available. Streams that are minimally impacted are available on the periphery of the study area. However, these areas are minimally impacted because they are inherently different (e.g. poor agricultural land) so would not necessarily serve as adequate non-impacted references. Work done by the National Agri-Environmental Standards Initiative (NAESI) has estimated pre-impact (i.e. prior to anthropogenic influence) concentrations for TN and TP in Southern Ontario using five different approaches (Chambers et al. 2009). These pre-impact concentration estimates were then used to generate an “Ideal Performance Standard” (IPS) for several regions in Canada, including the “mixed hardwood region on Ontario”, which encompasses our study region. The IPS is defined as, “the desired level of environmental quality needed to maintain ecosystem health” (Chambers et al. 2009). The NAESI estimate for the pre-impact levels of TP for the mixed hardwood region ranged from 8 to 32 µg L-1, depending on the method used. For TN, the pre-impact estimates ranged from 0.24 to 1.31 mg L-1.
Using these estimates of pre-impact TN and TP concentrations, NAESI developed an IPS of 24 µg L-1 for TP and 1.07 mg L-1 for TN for the mixed hardwood region of Ontario. Note that for these studies the authors determined TN, rather than NO2+NO3concentrations as we determined in this work. However, NO2+NO3 comprised 80-90% of the TN in our study. Thus, for comparison purposes, we compare the TN IPS concentrations of NAESI to the NO2+NO3 concentrations generated in the present study. The TWMC for NO2+NO3 across streams for which we could derive such data was 6.2 mg L-1, which is 5.8 times higher than the TN IPS values estimated by NAESI. For TP, we estimated a TWMC of 60 µg L-1, 2.5 times higher than the TP IPS values estimated by NAESI. Thus, nitrogen concentrations are more elevated compared to the NAESI IPS than are TP concentrations.
One consideration in the interpretation of TP concentrations relative to estimated pre-impact concentrations and IPS values is the relative lability of TP fractions. Stream TP is largely sediment-bound and biologically unavailable (e.g. Logan 1982). Against a background of a large amount of recalcitrant P, a quantitatively small input of highly labile P might be an undetectable fraction of TP. However, this small input could represent a substantial increase in the proportion of available P in the system. Unfortunately, the proportion of labile P is difficult to measure and currently no routine measures of biologically available P are available. Focussed studies on the fraction of labile P, perhaps in a subset of these systems, may help quantify the contemporary proportion of labile P in these streams.
The NAESI work concedes that the IPS is not likely to be achievable in areas of appreciable agricultural influence. Thus, the NAESI also identified “Achievable Performance Standards” (APS), their estimate of concentrations that can be achieved using recommended beneficial management practices. The APS are site-specific and they were derived for particular watersheds in the NAESI study using watershed-modelling techniques. For example, NAESI developed APS for the Raisin River in Eastern Ontario. At the outlet of the Raisin River, modelling done by NAESI estimated that 20m buffer strips along the river have the potential to reduce TN from 3.37 mg L-1 to 1.78 mg L-1 and reduce TP from 113 µg L-1 to 31 µg L-1 (Chambers et al. 2009).
As we alluded to earlier, the effect of BMPs, and therefore the APS, will be watershed specific. Thus, we currently cannot identify APS objectives for our study sites. However, work currently underway by our branch, is modelling the potential impact of BMPs on Nissouri Creek. Additionally, our group is involved in a project that is funded by OMAFRA under the Canada-Ontario Agreement known as the Watershed Based Best Management Practices Evaluation (WBBE) Program. This project will also model the potential improvements in water quality with the application of various BMPs in a variety of watersheds in Southwestern Ontario.
A NAESI subproject developed some estimates for unimpacted (from human influence) E. coli concentrations (Edge et al. 2009) and applied these values as provisional standards for E. coli in agricultural regions. In this work, the authors developed estimates of the concentration of E. coli that corresponded to background diversity of waterborne pathogens (Cryptosporidium, Campylobacter, and Giardia) by using minimally impacted upstream reaches of their study watersheds in a variety of locations across Canada. Edge et al. (2009) found that the background levels of E. coli depended on stream order, with unimpacted streams of higher order showing lower concentrations of E. coli than lower-order unimpacted streams. Specifically, they determined that for third-order and lower streams, unimpacted reaches of their study streams had mean annual E. coliconcentrations < 84 CFU 100 mL-1. For streams higher than third-order, they found that unimpacted streams had mean annual E. coli concentrations < 39 CFU 100 mL-1. These two values were used as the provisional standards for streams of third order or lower, and for streams of greater than third-order, respectively.
In the present study, the streams ranged from second to fifth order. For the second and third-order streams (Blyth Brook, Muskrat Creek, the Middle Maitland River, Nineteen Mile Creek, and Silver Creek), the TWMC of E. coli that we estimated over the course of the study was 893 CFU 100 mL-1, approximately ten times higher than the NAESI provisional standard of < 84 CFU 100 mL-1. The range in average values for these streams varied considerably, however, from 149 CFU 100 mL-1 at Nineteen Mile Creek, to 2500 CFU 100 mL-1 at the Middle Maitland River. For the fourth- and fifth-order streams (Nissouri Creek, the Avon, Little Ausable, and South Thames Rivers), our computed average TWMC for E. coli was 403 CFU 100 mL-1. As with the lower-order streams, this value was approximately ten times greater than the NAESI provisional standard for streams greater than third-order. None of the streams for which we have TWMC data were below the NAESI provisional standards in the 2006-2009 average E. coli concentration. For the larger set of streams which was sampled, but for which we could not generate TWMC, the mean value across all streams of 1425 CFU 100 mL was well above the NAESI provisional standards.
Estimates for the pre-impact loads or concentrations of SS do not exist for our study area. While agriculture often has impacts on erosion and the subsequent sediment loading in streams, it is likely difficult to generate estimates for pre-impact loads or concentrations as some pristine streams can, at least periodically, can generate high loadings of SS due to natural erosion. Thus, natural SS loading and concentration likely vary greatly among streams.
Pre-impact nutrient loading estimates are not available for Ontario. However, Smith, Alexander & Schwarz (2003) generated pre-impact loading estimates, on a regional basis, for the conterminous United States. To provide some basis for comparison, we compare our values to reference values calculated for regions in the US that are adjacent to the study region in the present study. As with the values for the NAESI project, Smith, Alexander & Schwarz (2003) determined TN, rather than NO2+NO3 concentrations, though we shall compare directly our NO2+NO3 loading estimates. Thus, the TN loading estimates will represent a slight overestimate compared to NO2+NO3 loadings. For the “Corn Belt and Northern Great Plains”, a region adjacent to the part of the western shore of lake Huron and part of the southern border of Lake Erie, they estimated median pre-impact loadings of TP of 7.3 kg km-2 y-1, and TN loadings of 60 kg km-2 y-1. For the “Mostly Glaciated Dairy Region” also partially adjacent to the western shore of Lake Huron, as well as part of the southern border of Lake Erie, they estimated similar pre-impact TP loadings of 6.2 kg km-2 y-1, and TN loading of 70 kg km-2 y-1. Our average NO2+NO3loading was 3.1 × 10³ kg km-2 y-1, which ranges from 44 to 52 times that of the pre-impact loadings estimated by Smith, Alexander & Schwarz (2003). For TP, our average estimate of loading was 92 kg km-2 y-1, approximately 12 to 15 times higher than the estimates of Smith, Alexander & Schwarz (2003). Thus, as with the comparison of concentrations against the NAESI IPS, it would appear that nitrogen loadings are further above pre-impact levels than are phosphorus loadings.
Because the loading estimates of Smith, Alexander & Schwarz (2003) are only adjacent to the study area of the present study, it is possible that they do not reflect pre-impact loadings for the study area. However, in the same study, Smith, Alexander & Schwarz (2003) also estimated pre-impact concentrations regionally, and those pre-impact concentrations for the Corn Belt and Northern Great Plains and the Mostly Glaciated Dairy Region are similar to the pre-impact concentrations of TN and TP generated in the NAESI study, suggesting that pre-impact loading might also be similar in these adjacent regions. An estimate of pre-impact loadings for Southwestern Ontario, nevertheless, would result comparisons for our study region that are more robust.
Relationships within the study watersheds
While the percentage of agriculture in the study watersheds varied in a relatively small range, from 64 to 95%, NO2+NO3 unit-area loadings varied 3-fold. This finding is consistent with a study done by Caraco et al. (2003). They found that in large rivers, NO3- export was well explained by simple measures of human activity. On smaller watersheds (< 100 km-2), however, this relationship weakened, predicting only 8% of the variation in NO3- export even though the range in NO3- export in their data was > 1000 fold. As all of our watersheds are under 100 km-2, with some considerably smaller than this, it is perhaps not surprising that the variability in a coarse measure of land use does not correspond with the degree of variability we observe in NO2+NO3 loading among our watersheds. Caraco et al. (2003) indicate that patterns explaining NO3 export, especially in small watersheds, are resolvable with more detailed land use information. As mentioned, we are currently seeking to obtain data of sufficient detail to explain more fully the variability we observe in NO2+NO3 loadings among these watersheds.
The range in TP, SS, and E. coli loadings were even greater than that of NO2+NO3, with TP and SS loadings ranging close to an order of magnitude difference and E. coli almost two orders of magnitude among streams. The reason for this difference in the range of these water quality measures among streams is likely due, at least in part, to solubility differences. Of these water quality measures, NO2+NO3 are the only forms that are entirely soluble. Suspended solids, as their name implies, are insoluble and tend to be transported in far greater quantity during high-flow, rather than low-flow periods. The amount of SS transported by a stream is highly dependent on soil type and stream morphology, so variability in these could contribute to additional variability among the streams. Total phosphorus presents a further complication in that fractions of TP are highly soluble, while other fractions (typically the majority in streams) are insoluble, with a range of colloidal and semi-soluble P fractions as well. The sediment-bound insoluble fraction, like SS, is exported in much larger quantities during high-flow events (Logan 1982). E. coli, while minute in size, tend to bind to much larger sediment particles. Thus, like TP, E. coli tend to travel with SS. Additionally, E. coli typically are highly variable, both temporally and spatially within streams.
Comparison to PLUARG
There are several considerations to remain aware of when comparing our loading estimate to those of the PLUARG work completed over 30 years ago. The PLUARG values are means of two study years (1975 and 1976) and our values are the means of 4 to 6 years of study. As described earlier, weather-driven year-to-year fluctuations in stream loading can be appreciable, so our snapshot comparisons could be strongly influenced by such fluctuations. Annual precipitation in the PLUARG study years and the study years of the present work did not differ greatly, however. These annual means do not consider the potentially important influence of within-year patterns in precipitation (such as the frequency of storms), so climatic differences cannot be entirely excluded as a consideration in comparing these studies. Two of our streams were also examined in the PLUARG work (the Little Ausable River and Nissouri Creek) while we grouped the remainder of our streams by the sub-watersheds identified by the PLUARG. The PLUARG sub- watersheds were chosen to have similar soil types and land uses (see Methods). However, appreciable variation in soil types and land use occurs in these watersheds, so it is quite likely that streams within the PLUARG regions would display considerable variation in water quality due to these differences. Another consideration in making comparisons between the loading estimates of the present work and those of PLUARG are the loading estimates themselves. The PLUARG work was able to sample far more frequently (> 1 sample per day on average) than in our study design (see Methods). While the NO2+NO3 loading estimates are likely comparable between our work and that of the PLUARG, we expect that our calculations of TP and SS loadings are underestimates compared to those of the PLUARG work (see “Methods- Comparison with PLUARG values”).
While all of the above considerations must be kept in mind when comparing our loading estimates to those of the PLUARG work, some of the comparisons between our work and those of the PLUARG remain remarkable. One such stream is the Little Ausable River, which was studied by the PLUARG as well as in the present work. This stream showed much higher loadings of TP and SS in our work than that found by the PLUARG (2.5 and 2.6 times, respectively). Our estimates of TP and SS loadings at Muskrat Creek were also much higher than at the PLUARG reference site (Upper Maitland River), where TP loads were 2.7 times and SS loads were 4.2 times higher than that of the Upper Maitland River. More intensive sampling using automated sampling to capture high-flow events would improve our estimates of loading at these streams.
Remarkably higher loadings were not only evident in TP and SS, as several of our estimates of NO2+NO3 loading were much higher than that estimated by the PLUARG. Silver Creek, in the same PLUARG region as the Little Ausable River (AG-03), showed high loadings of TP and SS, but also had appreciably higher NO2+NO3 loadings than those estimated by the work of the PLUARG on the Little Ausable River. The Middle Maitland River, examined in the present work, had NO2+NO3 loads 2.3 times higher than the reference stream studied by the PLUARG for that region (Canagagigue Creek). The loading of TP was also high at The Middle Maitland River at 1.8 times that the PLUARG reference. Curiously, our estimate of SS loading at the Middle Maitland River was only 0.6 times that of the PLUARG reference. This finding is remarkable because TP tends to be sediment-bound, so an increase in TP loading is unexpected without a concomitant increase in SS loadings.
Our estimates of NO2+NO3 loadings at Nissouri Creek, which was also studied by the PLUARG, were appreciably higher than the estimates that their work generated. Loadings of TP between our study and that of PLUARG were similar, and our estimate of SS loading was only half that of the PLUARG work. Again, it is important to consider that our estimates of SS and TP loading are likely underestimates compared to the PLUARG estimates.
Recent estimates of stream loading at Nissouri Creek have also been generated in a study by the Ontario Ministry of Farm and Rural Affairs (OMAFRA) and the Soil Resource Group (SRG 2010). For Nissouri Creek, estimates of NO2+NO3loading in this study (average of 2008 and 2009) were similar to our estimate (3.4 × 10³ kg km-2 y-1 compared to our estimate of 3.8 × 10³ kg km-2 y-1). However, estimates of TP and SS loading by the OMAFRA and SRG work at Nissouri Creek are substantially higher than our estimates. For TP, the OMAFRA and SRG estimate is 190 kg km-2 y-1, while our estimate is only 71 kg km-2 y-1. Similarly, the OMAFRA and SRG study found SS loadings of 39 × 103 kg km-2 y-1, while our estimate is only 13 kg km-2 y-1. These results corroborate our earlier supposition that our sampling frequency results in an underestimate of TP and SS loads and suggest that loadings of all of these substances were appreciably higher between the late 1970s/early 1980s and the recent past in the Nissouri Creek watershed.
The OMAFRA/SRG (2010) study also estimated stream loading at Canagagigue Creek at the same site as that of the PLUARG work. Similar to their findings at Nissouri Creek, average annual loadings of NO3- increased appreciably between their study years (2008 and 2009) of 2.9× 10³ kg km-2 y-1 versus those of PLUARG at 1.4× 10³ kg km-2 y-1. TP and SS loadings between the two periods did not appear to have changed greatly at the Canagagigue watershed, however. Their study estimated TP loadings of 100 kg km-2 y-1 compared to 90 kg km-2 y-1 found by PLUARG. Similarly, the OMAFRA/SRG study estimated SS loadings of 30 × 103 kg km-2 y-1, while the estimate during the PLUARG study was 46 × 103 kg km-2 y-1. Our findings, and those of the OMAFRA/SRG (2010) work, suggest that loadings of some substances at some watersheds have increased but also suggest that there is appreciable variability in the changes in water quality among streams.
Seasonal loads and concentrations
Perhaps the most striking feature that we observed in the seasonal pattern in stream loads and concentrations was the relatively high winter concentrations and loads of TP, NO2+NO3, and SS. As demonstrated in Figure 7, rather than a spring thaw occurring in March, winters were typically marked by several thaw events, often accompanied by rain. A high proportion of these snowmelts and winter rains contributed to increased discharge during this time of year when rates of evapotranspiration and infiltration (due to frozen soils) are low. Indeed, a large portion of annual discharge (41%) occurs in the 3 winter months. Work done by the PLUARG found a similar proportion of winter stream loading in their study of agricultural watersheds in Southwestern Ontario (Ongley 1978).
For NO2+NO3, the seasonal proportion of loading was very closely related to the proportion of discharge in that season (and each of the other seasons). The NO2+NO3 relationships with discharge were also simple in that high NO2+NO3 loading in winter corresponded with high NO2+NO3 in-stream concentrations. For TP and SS, the proportion of winter loads was slightly higher than the proportion of discharge delivered in the period. Additionally, the concentration/loading relationship was somewhat more complicated, with high loads of TP and SS not always resulting in correspondingly high concentrations. This is probably because winter discharge was dominated by high-flow events, which would likely result in relatively more erosion during these winter flows. Erosive events would result in periodically high loading, but lower flows during winter would mean that, for the intervening low flow periods, TP and SS concentrations would be relatively low.
Concerning in-stream effects, the cold temperatures could mute some of the potential effects of high concentrations in winter and late autumn. Biological activity would be relatively low during this time of year. Thus, the in-stream eutrophication potential of increased TP is likely to be much lower than the potential effect during warmer times of the year. The relatively lower biological activity might also result in lower toxicity of NO2+NO3 to stream organisms at low temperatures. One of the mechanisms by which nitrite (NO2-), the more toxic form of the two, exerts much of its toxicity on aquatic organisms by interfering with oxygen metabolism (Jensen 2003). Oxygen concentrations are typically higher in winter, which could mitigate some of the toxicity from NO2- though with low flows and under ice cover, high oxygen concentrations in winter might not always be the case (Gordon 2004). Studies relating the toxicity of NO2 or NO3- with temperature are sparse. It has been found in channel catfish that lower temperatures resulted in slower development of NO2 toxicity, likely due to lower respiration rates (Lewis & Morris 1986). However, the same work found that lower temperatures also result in lower rates of detoxification of NO2--. Thus, the ecological implications of high NO2+NO3 concentrations in winter are currently unclear.
The relatively high winter concentrations and loads of TP, NO2+NO3, and SS that we observed could have important implications for receiving waters, where these waters receive inputs from agricultural streams similar to our study streams. For example, high winter NO2+NO3 loads from agricultural streams could contribute to elevated NO2+NO3 concentrations at drinking water intakes located in downstream receiving waters, including nearshore regions in the Great Lakes. Further study would likely reveal if the seasonal patterns we observe in these small agricultural streams were reflected in receiving waters.
Nutrient loads, especially TP, which are delivered to the Great Lakes in winter, have the potential of resulting in eutrophication issues in spring, if these inputs are held close to shoreline over the winter. The fate of riverine inputs during winter is poorly understood. However, it is plausible that shoreline ice, followed by thermal bar formation in spring, could hold TP and NO2+NO3 delivered by rivers close to the shoreline long enough to result in eutrophication issues in early spring. Nearshore studies on the South East shores of Lake Huron have found some evidence of spring elevation in algal growth that is not clearly linked to a current river input (Mohamed, Howell, & Todd 2009). It is possible, though not confirmed, that these increases were the result of winter loading from adjacent streams that were trapped in the nearshore until spring temperatures increase.
While the loads and concentrations of NO2+NO3, TP, and SS were highest in winter, spring loads (March-May) and concentrations of these were also high, to varying extents. Indeed, SS concentrations peaked during March. Increasing temperatures at this time of year would increase the potential for both in-stream as well as nearshore eutrophication from TP inputs. The NO2+NO3 loadings, which also remain high for this period, potentially present the same issues for receiving waters as described above.
Figure 24: Discharge of the Maitland River near Lake Huron (grey) and NO2+NO3 concentration at the Goderich drinking water intake (blue) from 2004 to 2009. NO2+NO3 data from The Great Lakes water intake monitoring programme, discharge data from Hydat gauge at Benmiller. Note that water quality samples were not collected from February 27 to June 5, 2006.
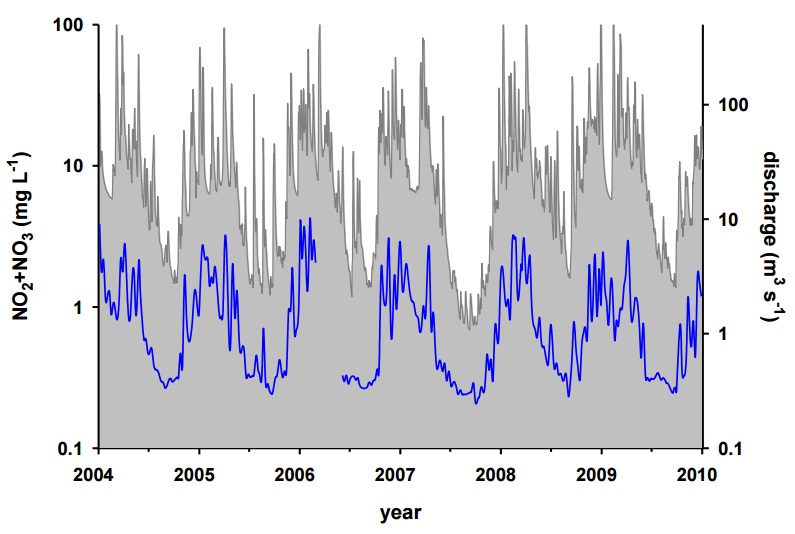
By late spring, loading and concentration of TP, NO2+NO3, and SS dropped, to varying extents. In the case of NO2+NO3, both the loadings and concentrations were very low in summer compared to the other seasons. While the larger receiving rivers would also have other inputs of NO2+NO3, previous work on large rivers in Southwestern Ontario, including the Bayfield, Maitland, and Saugeen Rivers, show that these rivers display the same pattern of high NO2+NO3 concentrations in late autumn and winter, and much lower NO2+NO3 concentrations in summer (Mohamed, Howell, & Todd 2009). Additionally, at the Goderich drinking water intake, close to the outlet of the Maitland River, the same pattern of NO2+NO3 inputs to the adjacent shores in the nearshore of Lake Huron can be observed (Figure 24).
In the case of TP loads and concentrations, an interesting seasonal pattern emerged. While loads of TP decreased, concentrations increased in July, remaining above the monthly average for the summer. During this period, flow generally decreased to very low levels, often becoming close to stagnant in many of the study streams. Thus, while TP concentrations can remain high, loading of TP during these periods would be very low.
The TP concentrations during low flows could have considerable consequences for stream biota and chemistry. The growth of attached and planktonic algae in the study stream is likely limited by P. During low-flow, extended periods of high P concentration could therefore allow growth of attached or planktonic algae. Low flow also results in lower rates of oxygen exchange with the atmosphere. During nights, high biomass of attached or planktonic algae, and their potential consumers could result in appreciable respiration, potentially reducing oxygen concentrations on a diel cycle. Previous work at the Middle Maitland River showed that oxygen concentrations dropped to very low concentrations on a diel basis (Clerk 2007). These low oxygen concentrations could have detrimental effects on some stream biota. Additionally, low flows coupled with reduced oxygen in the overlying water could also result in sediment anoxia, a process that can release P from bottom sediments.
While loading of TP in summer was relatively low, it is also important to consider that discharge in receiving streams would also be low during summer. Thus, the high summer TP concentrations could also result in high concentrations in the receiving streams. While daily estimates of load or concentration were not determined in the study by Mohamed, Howell, & Todd (2009), it was found that TP concentrations were generally lower in three large rivers draining Southwestern Ontario into Lake Huron during the summer. However, TP concentrations periodically did increase appreciably during summers. In the Grand River, Jamieson (2010) and Rosamond et al. (2011) found that nutrient inputs from agricultural as well as municipal sources resulted in high stream respiration, which, in turn resulted in diel depletion of oxygen concentration in the river.
E. coli concentration and loading was different compared to nutrients and SS, particularly in the winter and spring, which was likely related to different transport potential and survival rates at these times of year. While E. coli loads increased in early autumn, they declined in late autumn and remained low throughout winter and spring. A similar pattern was noted by Donnison, Ross, & Thorrold (2004) in New Zealand streams. In the streams of the present study, this pattern could probably be attributed, at least in part, by colder weather resulting in the die-off of E. coli. However, Hunter et al. (1999) related the pattern of stream E. coli concentrations to animal stocking rates in the associated watersheds, while Hunter & McDonald (1991) attributed the late season depletion of E. coli to their washout from the surrounding land by frequent autumn and winter rainfall.
Since E. coli loadings were highest in early autumn, this is possibly when the greatest impacts to receiving waters would occur. As with TP, however, receiving streams are also likely to have lower flows in summer potentially resulting in high E. coli concentrations in receiving waters during summer. Mohamed, Howell, & Todd (2009) noted that, as with TP, E. coli concentrations during summer were generally low, but did periodically increase appreciably, especially in the smallest of the three rivers (Bayfield River). To confirm this pattern, further work on the seasonal pattern of E. coli would have to be done on these larger receiving waters.
Seasonal loads and land management
As described above, the PLUARG work found that a majority of the nutrient loads arrived to their study streams in autumn to early spring (Neilsen, Culley, & Cameron 1978). The authors note that the lack of plant growth in the watershed from November to April, coupled with low denitrification rates due to low temperatures (Kowalenko 1978) resulted in large leaching losses from the soil. They recommended that efforts directed at reducing the nitrate content of soil prior to autumn would result in significantly lower annual loading of nitrogen to streams. They also recommend the planting of autumn cover crops to immobilise nitrogen as plant biomass or an organic (and therefore less soluble) form of nitrogen to decrease nitrogen loadings.
More recently, studies in other agricultural regions have come to some similar conclusions. In a study of the movement of nitrogen fertilisers through corn crops, Sanchez & Blackmer (1988) found that 49-64% of fertiliser N applied in autumn was lost from the upper portion of the soil, primarily in the autumn to spring period. Similarly, a review by Dinnes et al. (2002) stated that a key factor in reducing N losses from soils was to limit the amount of N within the soil at the end of the growing season and before the next season’s crop has established an extensive root system. In Sweden, an examination of possible policy measures to reduce nitrate leaching at the watershed scale recommended, among other measures, the planting of winter crops to reduce nitrate leaching (Gustafson, Fleischer, & Joelsson 2000), as well as ceasing autumn fertiliser application (Hoffman & Johnsson 2000). In Denmark, appreciable reductions in the amount of surplus nitrogen and phosphorus in soils have been achieved through a combination of setting upper limits for animal density and soil nitrogen, as well as restriction on winter application of manure (Maguire et al. 2005; Schelde et al. 2006). Lewis & Makarewicz (2009) applied a suite of BMPs, including restriction of winter manure spreading, to a small watershed (Graywood Gully). After 3 years, they resumed winter manure application as the sole change to the suite of BMPs employed. Within a short period, they found a dramatic increase in TP, NO3-, total kjeldahl nitrogen, and soluble reactive phosphorus in the stream draining the watershed. They recommended that, to reduce macrophytes in a downstream lake (Lake Conesus), reduction of winter loading was of key importance.
As noted above, the PLUARG studies done over 30 years ago found similar seasonal patterns in stream loading, with winter and early spring loadings dominating annual loads of nutrients and SS (Ongley 1978). Land use practices in the province have changed appreciably in the intervening period. For example, winter spreading of manure is no longer recommended and there are several restrictions on the winter application of agricultural source materials, including manure (though it is not prohibited; O. Reg. 267/03). It is notable, therefore, that the seasonal pattern in stream loadings of nutrients and SS remain similar between our study and that of the PLUARG. Further work to elucidate the mechanisms resulting in high winter loadings of NO2+NO3 in these watersheds is warranted.
Inter-annual patterns in loading
As outlined in the Methods and Results, we generated a single loading model across years for each stream. Thus, the year-to-year differences in loading estimates are based on the same relationship between concentration and discharge. The inter-annual patterns, however, demonstrate the degree to which loadings in a single year are affected by variation in weather. In 2007, a relatively dry year, loadings of all water quality measures in all streams dropped dramatically. The following year was relatively wet, resulting in a dramatic increase in loadings for all parameters. The strong dependence of annual loading rates on precipitation is an important consideration in the interpretation of trends and their potential relationship to land use and management practices. For example, in a simulation of nitrate export in a Minnesota stream, Nangia, Mulla, & Gowda (2010) found that precipitation had a greater effect on nitrate export than did changes in land management practices for three periods from 1965 to 2003. Thus, interpretation of temporal trends, especially short-term trends, should be made with great caution and apparent changes among years should be compared to other streams. A combination of monitoring and experimental approaches would likely result in the most robust evaluation of the effects of land management changes on stream water quality.
Climate effects and implications
The importance of inter-annual variations in weather demonstrated above also suggests that climate change could have an effect on stream nutrient loading and water quality. In a study of historical stream data in Ohio, Moog & Whiting (2002) found that the majority of the increase in stream loading from 1976-1995 was not from changes in land use, but rather due to climatic factors. Their analysis determined that increases in winter stream flow and the associated decrease in snowfall and snow cover were responsible for increases in NO2+NO3 and SS loads, while only soluble reactive phosphorus was increased from changes in agricultural practices. These findings suggest that it is possible that the high winter loading we observe in our study streams could be enhanced with climate change if such change were to increase the number of thaw events and decrease snow cover during winters. It is likely that the effect of climate change on stream nutrient loads will have considerable spatial heterogeneity, with different locales showing very different responses. For example, Chang, Evans, & Easterling (2001) conducted a simulation of changing stream flow and nutrient loading under a climate change scenario with an assumption of no change in land cover and land management in six watersheds of the Susquehanna River Basin. They found that stream flow and nutrient loads increased for most watersheds, but decreased in one intensively cultivated watershed. For our study streams, and Southwestern Ontario in general, understanding the potential impact of climate change will require specific studies to separate the effects of climate from land use, as well as to project possible future changes from the combined effect of changes in land use and climate.
Patterns in base flow
Our estimates of base flow contribution were done through numerical analysis of stream hydrographs and were not field calibrated. Thus, the per cent base flow estimates could vary appreciably from actual values. However, we applied the same techniques to all streams and the estimates serve as a relative measure of base flow contribution to the study streams. A thorough examination of the relative contributions of base flow to stream loads is beyond the scope of this work. We are currently in the process of completing detailed analyses of base flow relationships and their implications to agricultural inputs in these streams. Some notable early observations are discussed below.
The per cent of flow attributable to base flow varied considerably, from 46% to 72% of stream flow, when averaged across study years for each stream. This variability likely affects how these streams respond to inputs. TP and SS move primarily by overland transport (e.g. Gburek & Sharpley, 1998) while NO2+NO3 have a larger component that moves through base flow and interflow (Green et al. 2007). These variable pathways can have implications for the type of management practices used to reduce nutrient loss to streams. In a stream with low base flow, BMPs to reduce erosion and surface runoff during storms might be the most effective strategies to reduce the transport of nutrients to the stream from surrounding land. For example, the Little Ausable River has low base flow and high loading of TP, SS, and E. coli, though its loadings of NO2+NO3 are not especially high when compared to the other study streams. Thus, strategies to reduce runoff and erosion might be the most effective in reducing loading of these substances at the Little Ausable River. Of course, the nature of the agricultural inputs, as well as other soil and geological characteristics affect the loss pathways of agricultural effluents and these must be considered based on the individual watershed.
Another example of how the proportion of base flow among the watersheds might affect the timing of the delivery of nutrients to streams can be observed in some of the exceedance data. As noted previously, the Middle Maitland River produced relatively high loads and concentrations of NO2+NO3 among watersheds. However, this stream had the lowest number of exceedances of NO3- among any of the watersheds from 2004-2009. Conversely, Muskrat Creek had a relatively high rate of NO3- exceedance, even though it had among the lowest loads and average concentration of NO2+NO3 among the study streams. These differences might be attributable to the higher proportion of base flow in Muskrat Creek, which would result in more stable flows than in the Middle Maitland River, which would have a comparatively more variable flow regime. The relatively high per cent base flow of Muskrat Creek, however, could result in concentrations consistently in exceedance of a given benchmark, even though the average load delivered was lower than a stream with a more variable flow regime, such as the Maitland River.
Across streams, the proportion of base flow increased in summer and decreased in winter. Loading of most water quality measures (aside from E. coli) followed the opposite pattern – increasing in winter and decreasing in summer. Ostensibly, these results suggest that the high winter loads are not due to high base flow load. However, high flows increase both the base flow as well as quick flow (e.g. Figure 7). Further analyses, separating the base flow contributions from quick flow, could reveal if there are seasonal patterns in the load arriving through the base flow.
Figure 25: A) Monthly variations in the base flow enrichment ratio found by Schilling and Zhang (2004) in the Racoon River with generalised seasonal pattern of nitrogen uptake by corn (arbitrary scale).
B) Monthly pattern in NO2+NO3 concentration and loading in the study streams, with a generalised seasonal pattern of nitrogen uptake by corn (blue points). Corn uptake pattern modified from Schilling and Zhang (2004).
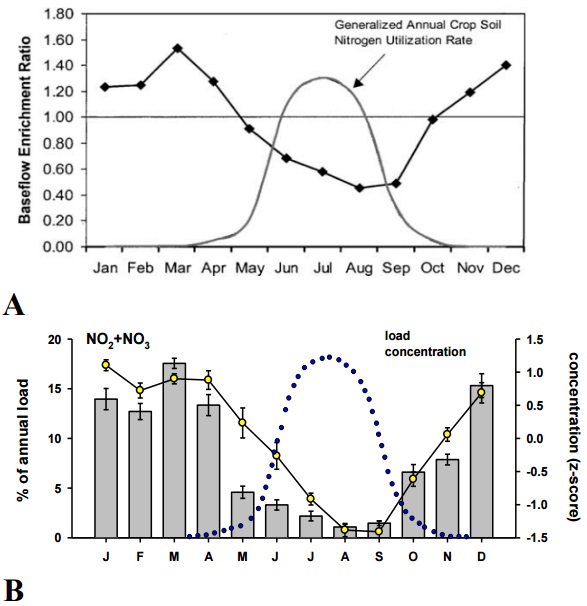
The proportion of stream flow attributable to base flow could also be used to determine what types of BMPs will be the most effective in different watersheds. For example, in the examination of a large agricultural watershed in Iowa (the Racoon River), Schilling & Zhang (2004) developed a method to determine the degree to which base flow concentrations of nitrate were enriched compared to total stream flow (base flow enrichment ratio, or BER). They found that the BER was high in this watershed, and was higher in winter than in summer (Figure 25A). Similarly, Dinnes et al. (2002) demonstrated that base flow loss of NO2+NO3 is much greater at times of the year when crop uptake is low. Note that the pattern in total NO2+NO3 load and concentration that we found (Figure 25B) is strikingly similar to that found by Schilling & Zhang (2004), who concluded the high winter BER of NO2+NO3 was due to low plant uptake of NO2+NO3 during winter. For the Racoon River watershed, Schilling and Zhang recommended BMPs to reduce base flow delivery of NO2+NO3such as improved riparian zone management, introduction of strategically-placed wetlands, or modifying drainage control structures. Further analyses of base flow data from our streams have the potential of revealing whether BER of NO2+NO3 in our study streams is also increased in winter, and whether this varies among our study streams. Such findings might help in determining the type of BMPs that would be effective in reducing entry of nutrients to the various streams.
Land use and its influence on loads and concentrations
The land use data are of a general nature and exclude important variables (e.g. quantities of fertiliser applied). We also do not quantitatively consider the potential effects of wildlife sources of nutrients and E. coli in these watersheds. Microbial source tracking studies have found that the E. coli found in streams and beaches draining agriculturally-dominated regions were primarily from a livestock, rather than wildlife, source. For example, Kon et al. (2009) found that, in recreational waters of the Lake Huron shoreline (close to the study region of the present work), the majority of E. coli were strains from livestock. Similarly, Graves et al. (2007) demonstrated that, in a livestock dominated region of Virginia, cattle were the dominant source of E. coli. Additionally, Graves et al. (2007) determined that cattle-derived strains of E. coli remained the dominant source regardless of season or sampling location within the study watershed. It remains a speculative possibility that wildlife could provide an appreciable source of nutrients or E. coli if appreciable upstream habitat were present. Most of our study watersheds however, have few, if any upstream sources of standing water. A potential exception to this is the Avon River watershed, which has a few small upstream ponds created by artificial dams. Notably, the E. coli, nutrient, and SS concentrations at the Avon River sampling site, do not appear anomalous compared to our other study watersheds.
While the above caveats must be considered, our land use data do provide some important characteristics of watersheds and some of the broad patterns between land use and stream water quality were evident. Generally, we found a pattern of increasing crop and livestock densities that were related to increased TP, NO2+NO3 and E. coli concentrations as suggested by the redundancy analysis. Individual correlations between cattle and poultry densities and water quality were sometimes statistically significant, though the relationships were generally weak. A seemingly anomalous observation in the relationship between land use and water quality (Figure 22) was the lack of relationship between pig density and any of the water quality variables. This, however, is likely due to sampling artefact. In the full dataset of 15 streams, there were positive relationships between cattle, pig, and poultry densities (Figure 5). The positive relationship between cattle and poultry density also occurs in the smaller set of 10 streams for which we have loading data. However, in that smaller set of streams, there is no positive relationship between pig and cattle densities, or pig and poultry densities. Thus, for this smaller dataset, pig density was uncorrelated to poultry and cattle densities, and therefore also appeared to be unrelated to TP, E. coli, and NO2+NO3 concentrations. This is most likely only a reflection of small number of sites we had available for generating stream loads (and thus TWMC).
Another interesting observation we made when relating land use to water quality was that soybean density was negatively related to TP, NO2+NO3, and E. coli concentrations. In terms of land use variables, soybean density was positively related to increasing per cent base flow and negatively related to cattle and poultry densities, both of which loaded in the same direction as E. coli, NO2+NO3, and TP (Figure 22). Thus, in our dataset, regions of greater soybean farming were regions of low livestock densities and were also regions that had a higher proportion of base flow and less impacted water quality. Consequently, it is likely that higher soybean density was associated with lower TP, NO2+NO3, and E. coli because regions of high soybean density were regions of low livestock density. Whether this pattern holds for the larger region and its causality, however, are beyond the scope of this work. Interestingly, work done by the PLUARG project on soil nitrogen losses under different cropping practices found that most crop types (tobacco, corn, winter wheat, potatoes, and green beans) produced a considerable amount of leachable N. Soybean however, did not (Neilsen, Culley, & Cameron 1978).
Many of the qualitative relationships between land use and stream water quality in individual streams were interesting, if not entirely explicable. For example, the Middle Maitland River showed high loading and concentrations of NO2+NO3, TP, and E. coli. The watershed of this stream was high in corn production and has high levels of livestock production. Of the streams for which we generated loading data, the Middle Maitland watershed was second only to the Nissouri Creek watershed in terms of manure production. These aspects of land use would be in agreement with the high loading and concentrations of NO2+NO3, TP, and E. coli we observe at the Middle Maitland River. However, the Nissouri Creek watershed also had high manure production and crop densities. Soil porosity and the proportion of stream flow that was attributable to base flow were also similar between the Middle Maitland River and Nissouri Creek. However, Nissouri Creek had appreciably lower loads and concentrations (to varying degrees) of TP, and E. coli than the Middle Maitland River. The data we currently have available are either missing an important variable (e.g. nutrient mass balance), or the variables we have available are too coarse to explain why water quality in these watersheds would differ so greatly. Incorporating more detailed and comprehensive land use data, as we anticipate, will further our ability to explain such patterns.
Our analyses found no relationship between NMPs and any of the measured stream water quality indicators. It is important to note that the data which we have available are rudimentary, with only the per cent of NMPs among farm operations in each watershed. We do not have potentially important information regarding which BMPs were implemented under the NMA. Such information might help resolve the effectiveness of NMPs in the study watersheds. Additionally, it must be remembered that there are several other considerations to be made when evaluating potential improvements to land management in the study watersheds, and to Southwestern Ontario as a whole. Firstly, the NMA captures only a subset of farms in Ontario and excludes many of the farms (including many smaller operations) in the province. It is unknown how much of the total nutrient inputs to the watersheds in Southwestern Ontario are contributed by farms captured by the NMA versus those excluded by it.
Secondly, other BMPs are occurring through more local programmes or voluntarily by farmers that are not part of the NMA. These other actions could act to obscure the effects of the NMA. For example, consider a hypothetical situation in which we examine two watersheds that are equal in terms of all other factors such as soil type and the type of farming occurring in them. If one watershed had many farms captured by the NMA, while another did not, though it did have high implementation of BMPs, determining the cause of any changes in stream water quality of these watersheds would be very difficult. Of course, our watersheds are also highly variable in land use as well as soil type and other characteristics, further confounding an ability to detect the effects of the NMA per se against these sources of background ‘noise’.
An approach based on a few, small watersheds in which land use is documented to a greater extent than was possible for the present study, coupled with more intensive stream sampling and hydrological measurements, would provide the best potential to detect how changes in land management affects water quality. Data already collected on the watersheds of the present work could provide an essential backbone for such studies, as might other watersheds on which partner Conservation Authorities have already done extensive background examination.
Another complementary approach would be to examine data from the larger (and more temporally-extensive) set of streams monitored by the PWQMN. With this broader set of streams, the coarser census-scale data may prove to have adequate resolution to relate changes in land use to stream water quality. These analyses would have to be done in a different manner, as the general PWQMN data are not collected with the same intent as those of the present work. However, they would provide a longer-term and broader-scale view of changes in stream water quality in Southwestern Ontario, and its relationship to land use changes.
Possible early trends in some study watersheds
Considering the nature of our data as well as the effect of climatic fluctuations, a systematic analysis of through-time trends in water quality is not yet appropriate (see Methods and Results). However, some suggestive patterns in two of the streams for which we have the longest data record (2004-2009) emerged that are worth noting.
Figure 26: Suspended solids concentration at Blyth Brook (A) and NO2+NO3 concentrations at Nissouri Creek (B). Grey line represents the modelled time-weighted mean concentrations; yellow points represent samples taken from the stream.
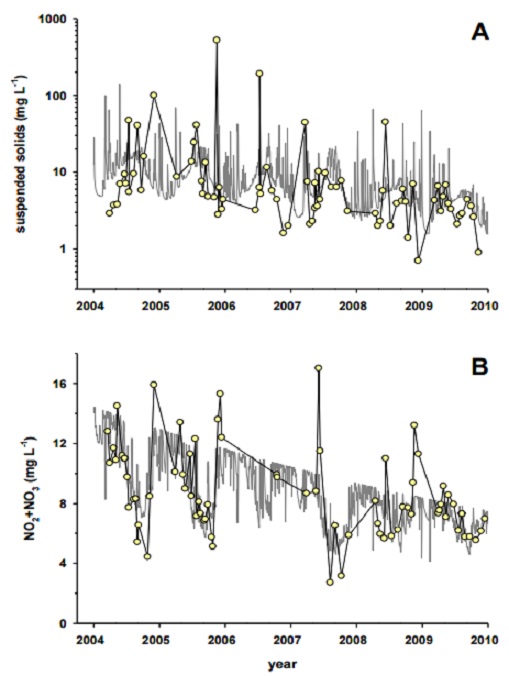
At Blyth Brook (Figure 26A), SS showed a consistent decline from 2004 to 2009. This was evident in both the modelled TWMC as well as in the samples collected from the stream. There was some suggestion, though weaker than for SS, that TP concentrations also followed a similar pattern at Blyth Brook (not shown). Since TP is often sediment-associated, it follows that it too might show a similar trend as SS. This apparent decrease in SS (and possibly TP), over time was not evident in NO2+NO3 or E. coli concentrations at Blyth Brook and was not a general characteristic of the study streams as a group. At Nissouri Creek, both the TWMC and the collected samples for NO2+NO3 showed an apparent decrease in concentration over time (Figure 26B). None of the other measures (E. coli, SS, TP) indicated any trends in this stream.
Since all of the study streams generally experienced the same climatic fluctuations, this cannot explain these apparent trends. While speculative, it is possible that these trends reflect some land use change in the watershed. Detection of early trends such as these might identify streams that warrant further study that is more intensive, since detailed land use and management information would be required to explain such trends. Such work could reveal which land use improvements result in subsequent improvement in water quality. Over time, and with continued monitoring, our ability to discern trends will improve across these study watersheds
Conclusions and future directions
Nutrient concentrations in the study streams were well above pre-impact estimates of these concentrations, with NO2+NO3 concentrations apparently more elevated compared to pre-impact conditions than were TP concentrations. Median TP concentration exceeded the PWQO for TP in 9 of the 15 study streams. For NO3-, median concentrations exceeded the CCME guideline for the protection of aquatic life in 14 of the 15 study streams. As with nutrients,E. coli concentrations in all the study streams were higher than estimates of unimpacted stream concentrations and there was considerable variability among streams.
We observed strong seasonal patterns in nutrient concentrations and loads, with a majority of the annual loads of TP, SS, and NO2+NO3delivered in winter and early spring. The seasonal pattern of E. coli loadings differed from the other measures and was more evenly distributed annually, with autumn showing the highest loading of E. coli to the study watersheds. While seasonal and inter-annual patterns in loading were similar among streams, the magnitude of loads varied substantially among streams, and among parameters within streams. Using coarse-level census data, we found positive relationships between cattle and poultry density with stream nutrient (TP and NO2+NO3) concentrations. Similarly, manure production was positively related with stream nutrient (TP and NO2+NO3) concentrations.
While we found high winter nutrient and SS loads and concentrations, our sampling effort has been quite low during this season, largely because of the logistical challenge in sampling at this time of year. We have increased winter sampling for 2010-2011. This increased winter sampling will improve our load and concentration estimates in the study streams.
Future work, some of which is already underway, will further our understanding of water quality in these streams, and its relationship to land use in their watersheds. One aspect that is currently being examined is the potential impact of the water quality that we observe on the biota of these streams. Stream invertebrates provide an excellent indicator of long-term conditions in streams, their abundance and diversity indicating the suitability of many aspects of the chemical and physical environment for stream biota. Invertebrates have been sampled from these streams for several years, led by the Dorset Environmental Science Centre of the EMRB. These data are currently being analysed and will provide insight into the biotic health of the study streams. Similarly, attached diatoms are indicators of the trophic conditions in streams, acting as temporal integrators of the highly variable nutrient conditions typical of small streams. We have collected diatom samples in 2010 and will repeat collection this season to provide another biotic endpoint to measure stream health.
The potential of agricultural activities to contribute pathogens to source waters is of ongoing interest. One approach to assess this potential is to estimate the load of some pathogens (Cryptosporidium, Campylobacter) from manure using empirical estimates of the number of these pathogens present in various types of manure (Dorner, Huck, & Slawson 2004). This is analogous to the approach we have already used in the present work to estimate nutrient (TP and NO2+NO3) contribution from manure. Thus, in future studies, we will use the manure production data to make similar estimates of the potential contribution of these pathogens from manure in agricultural watersheds in Southwestern Ontario.
The base flow analyses presented here provided some preliminary insight into this aspect of the study streams. As detailed previously, there exists potential in using these base flow data to further our understanding of the nutrient dynamics of these streams, which would aid in guiding management decisions to reduce nutrient concentrations and loads in these streams. For example, some studies have found that a groundwater source having high nitrate concentrations from agricultural inputs resulted in high base flow nitrate concentrations in their study stream (Tesoriero et al. 2009). In such cases, there can be appreciably long recovery times after a reduction in agricultural nitrate inputs, sometimes on the order of decades (Meals, Dressing, and Davenport 2009). Further work assessing the contributions of nitrate from base flow from our streams, and the potential connection to groundwater nitrate would provide an appreciation of the recovery times expected from these systems.
Data from the current study sites provide insight into which watersheds might be worthy of more intensive studies and which sites might be redundant in the nature of the data that they provide. Additional analyses of the existing data will be used to determine the types of watersheds (in terms of land use, stream characteristics, and other attributes) that would be beneficial to add to our suite of study watersheds. Related to this, it is clear that reliable discharge data are critical for load estimation. An evaluation of our study sites in terms of our ability to acquire adequate reliable discharge data is warranted and is currently underway.
While the comparisons with PLUARG revealed several very interesting results, these insights came with several caveats, as our sampling was not specifically created to make these comparisons. The agricultural studies of the PLUARG work were highly labour-intensive and part of a much larger study. A study designed to make comparisons to PLUARG agricultural streams could be tractable if, perhaps, conducted on only a few streams. Additionally, improvements in load estimation, and newer technologies (such as continuous nitrate analysers) could make some aspects of the task less labour-intensive than during the PLUARG study.
Another approach to the examination of land management and its effects on stream water quality is the use of manipulative experiments on small watersheds. Such studies can be designed to be more sensitive to early effects of applying various BMPs on stream water quality. Additionally, the use of control watersheds allows the ability to separate the often-substantial influence of climate, from changes in land management. Our branch is currently involved in an OMAFRA-funded project to study the effects of BMPs on stream water quality. The data we have collected thus far on the 15 watersheds of the present study could provide candidates- perhaps on streams that are typical, or conversely, on ‘outlier’ streams- that would be beneficial for more focussed studies.
As detailed previously, the coarse-scale land use data used in the present work were not ideally suited to the small watersheds that we studied. In spite of this, these data still yielded some suggestive relationships between land use and stream water quality. We are working with OMAFRA to obtain finer scale data on land use practices in the study watersheds. We anticipate that these finer scale data will allow more detailed assessments of how land use and management might be affecting stream water quality. For example, while we were able to approximate manure production in the study watersheds, data that are more detailed will allow the calculation of nutrient mass balances in each watershed. That is, it will allow an accounting of both inputs of nutrients through manure and fertiliser, as well as their removal through export and harvesting of crops. The balance of nutrients in a watershed is likely to relate much more strongly to stream nutrients than is total manure production as we used in the present study. These fine-scale data will also serve to aid in modelling efforts to predict the effects of changing land management, as is currently being done by our branch for Nissouri Creek.
The present monitoring study will provide valuable insight into the effects of changing land use and management practices on the health of these streams, as well as their receiving waters. These changes will take some time to manifest as changes in stream water quality and the present design does not endeavour to control which land use changes and management practices are applied. The study design acts as an ‘observer’ on these changes, which is an invaluable tool in our understanding of how land use and management affect water quality. As Schilling & Spooner (2006) note, without adequate monitoring, improvements through nutrient management efforts may go unappreciated.
References
Alexander, R, R Smith, and G Schwarz. 2000. Effect of stream channel size on the delivery of nitrogen to the Gulf of Mexico. Nature 403, no. 6771 (February): 758-761.
Anon. 1983. Nonpoint Source Pollution Abatement in the Great Lakes Basin An Overview of Post-PLUARG Developments. Report to the Great Lakes Water Quality Board, Windsor, Ontario.
Anon. 2009. Guidelines for Canadian Recreational Water Quality, Third Edition. Document for Public Comment. Health Canada.
Caraco, N.F., J.J. Cole, G.E. Likens, G.M. Lovett, and K.C. Weathers. 2003. Variation in NO3- Export from Flowing Waters of Vastly Different Sizes: Does One Model Fit All? Ecosystems 6, no. 4 (June): 344-352.
Carpenter, S.R., N.F. Caraco, D.L. Correll, R.W. Howarth, N. Sharpley, and V. H. Smith. 1998. Nonpoint Pollution of Surface Waters With Phosphorus and Nitrogen. Ecological Applications 8, no. 3 (August): 559-568.
Chambers, P.A., M. Guy, S.S. Dixit, G.A. Benoy, R.B. Brua, J.M. Culp, D. McGoldrick, B.L. Upsdell, and C. Vis. 2009. Nitrogen and Phosphorus Standards to Protect the Ecological Condition of Canadian Streams, Rivers and Coastal Waters. National Agri-Environmental Standards Initiative Synthesis report No. 11. Environment Canada. Gatineau, Quebec.
Chang, H., B.M. Evans, and D.R. Easterling. 2001. The effects of climate change on stream flow and nutrient loading. Journal of the American Water Resources Association 37, no. 4 (August): 973-985.
Chesters, G., J. Robinson, R. Stiefel, R. Ostry, T. Bahr, RD Coote, and D. M Whitt. 1978. Pilot Watershed Studies Summary Report. Ontario Ministry of the Environment.
Clerk, S. 2007. Nutrient Management Monitoring Program: 2005 Annual Technical Report (May). Ontario Ministry of the Environment.
Coote, D, and R DeHaan. 1978. Agricultural Watersheds Overview Data Analysis And Extrapolation Final Report - Project 1B Agricultural Watershed Studies Task Group C (Canadian Section) Activity 1 , International Reference Group On Great Lakes Pollution From Land Use Activities.
Dinnes, D.L. D.L. Karlen, D.B. Jaynes, and T.C. Kaspar. 2002. Nitrogen management strategies to reduce nitrate leaching in tile- drained Midwestern soils. Agronomy Journal 94: 153-171.
Donnison, A., C. Ross, and B. Thorrold. 2004. Impact of land use on the faecal microbial quality of hill-country streams. New Zealand Journal of Marine and Freshwater Research 38, no. 5 (December): 845-855.
Dorner, S.M, P.M. Huck, and R.M. Slawson. 2004. Estimating potential environmental loadings of Cryptosporidium spp. and Campylobacter spp. from livestock in the Grand River Watershed, Ontario, Canada. Environmental Science & Technology 38, no. 12 (June): 3370-3380.
Eckhardt, K. 2008. A comparison of baseflow indices, which were calculated with seven different baseflow separation methods. Journal of Hydrology, 352 (1-2), 168-173.
Edge, T.A., I. Droppo, A. El-Shaarawi, V. Gannon, M. Hewitt, R. Kent, I. Khan, et al. 2009. An Evaluation of Escherichia coli as a Potential Agri-Environmental Waterborne Pathogen Standard. Synthesis Report No. 14. National Agri-Environmental Standards Initiative. Environment Canada. Gatineau, Quebec.
Environmental Commissioner of Ontario. 2004. "The Nutrient Management Regulation." Choosing our Legacy, ECO Annual Report, 2003-04. Management. Toronto: The Queen’s Printer for Ontario. 74-78.
Environmental Commissioner of Ontario. 2006. "Amending the Nutrient Management Regulation." Neglecting our Obligations, ECO Annual Report, 2005-06. Management. Toronto: The Queen’s Printer for Ontario. 111-116.
Gburek, W.J., and A.N. Sharpley. 1998. Hydrologic Controls on Phosphorus Loss from Upland Agricultural Watersheds. Journal of Environmental Quality 27: 267-277.
Gordon, N.D. 2004. Stream Hydrology: An Introduction For Ecologists. John Wiley and Sons.
Graves, A.K., Hagedorn, C., Brooks, A., Hagedorn, R.L., and Martin, E. 2007. Microbial source tracking in a rural watershed dominated by cattle. Water Res. 41: 3729–3739.
Green, M.B., J.L. Nieber, G. Johnson, J. Magner, and B. Schaefer. 2007. Flow path influence on an N:P ratio in two headwater streams: A paired watershed study. Journal of Geophysical Research 112, no. G3 (September): 1-11.
Gustafson, A., S. Fleischer, and A. Joelsson. 2000. A catchment-oriented and cost-effective policy for water protection. Ecological Engineering 14, no. 4 (April): 419-427.
Hoffman, M, and H. Johnsson. 2000. Nitrogen in Sweden Leaching from Agricultural Land Model Calculated Effects of Measures to Reduce Leaching Loads. Ambio 29, no. 2: 67-73.
Hoffman, N, and M.S. Beaulieu. 2006. A Geographical Profile of Manure Production in Canada, 2001. Minister of Industry. Ottawa, Ontario, Canada.
Hunter, C, and A. McDonald. 1991. Seasonal changes in the sanitary bacterial quality of water draining a small upland catchment in the Yorkshire dales. Water Research 25, no. 4 (April): 447-453.
Hunter, C., J. Perkins, J. Tranter, and J. Gunn. 1999. Agricultural land-use effects on the indicator bacterial quality of an upland stream in the Derbyshire peak district in the U.K. Water Research 33, no. 17 (December): 3577-3586.
Jamieson, T.S. 2010. Quantification of Oxygen Dynamics in the Grand River Using a Stable Isotope Approach. PhD thesis. University of Waterloo. Waterloo, Ontario, Canada.
Jensen, F. 2003. Nitrite disrupts multiple physiological functions in aquatic animals. Comparative Biochemistry and Physiology - Part A: Molecular & Integrative Physiology 135, no. 1 (May): 9-24.
Kon, T., Weir, S. C., Howell, E. T., Lee, H., & Trevors, J. T. 2009. Repetitive element (REP) - polymerase chain reaction (PCR) analysis of Escherichia coli isolates from recreational waters of Southeastern Lake Huron. Canadian Journal of Microbiology, 55: 269-276.
Kowalenko, C.G. 1978. Nitrogen transformation processes in agricultural watershed soils final report on Project 11 Agricultural Watershed Studies. International Reference Group on Great Lakes. Pollution from Land Use Activities. International Joint Commission.
Lewis, T.W., and J.C. Makarewicz. 2009. Winter application of manure on an agricultural watershed and its impact on downstream nutrient fluxes. Journal of Great Lakes Research 35: 43-49.
Lewis, W. and D.P. Morris. 1986. Toxicity of nitrite to fish: A Review. Transactions of the American Fisheries Society 115: 183-195.
Lim, K.J., B.A. Engel, Z. Tang, J. Choi, K. Kim, S. Muthukrishnan, and D. Tripathy. 2005. Automated web GIS based hydrograph analysis tool, WHAT. Journal of the American Water Resources Association 41, no. 6 (December): 1407-1416.
Logan, T.J. 1982. Mechanisms for release of sediment-bound phosphate to water and the effects of agricultural land management on fluvial transport of particulate and dissolved phosphate. Hydrobiologia 91-92, no. 1 (July): 519-530.
Maguire, R.O., G.H. Rubaek, B.E. Haggard, and B.H. Foy. 2005. Critical evaluation of the implementation of mitigation options for phosphorus from field to catchment scales. Journal of Environmental Quality 38, no. 5: 1989-1997.
McDowell, R.W., B.J.F. Biggs, A.N. Sharpley, and L. Nguyen. 2004. Connecting phosphorus loss from agricultural landscapes to surface water quality. Chemistry in Ecology 20, no. 1: 1-40.
Meals, D.W., S.A. Dressing, and T.E. Davenport. 2009. Lag time in water quality response to best management practices: a review. Journal of Environmental Quality 39, no. 1: 85-96.
Mohamed, M., T. Howell, and A. Todd. 2009. Water Quality on the Shores of Lake Huron Adjacent to the Saugeen, Maitland, and Bayfield River Mouths. Ontario Ministry of the Environment, Environmental Monitoring and Reporting Branch.
Moog, D.B, and P.J. Whiting. 2002. Climatic and agricultural contributions to changing loads in two watersheds in Ohio. Journal of Environmental Quality 31, no. 1: 83-89.
Moran, E.C., and D.O. Woods. 2009. Comprehensive watershed planning in New York State: The Conesus Lake example. Journal of Great Lakes Research 35: 10-14.
Nangia, V., D. J. Mulla, and P.H. Gowda. 2010. Precipitation changes impact stream discharge, nitrate–nitrogen load more than agricultural management changes. Journal of Environmental Quality 39, no. 6: 1-9.
Neilsen, G.H., J.L. Culley, and D.R. Cameron. 1978. Nitrogen Loadings From Agricultural Activities In The Great Lakes Basin Integration Report On Nitrogen. International Reference Group on Great Lakes Pollution from Land Use Activities. International Joint Commission.
O'Rourke, N. Hatcher, L. and Stepanski, E. 2005. A Step-by-Step Approach to Using SAS for Univariate and Multivariate Statistics, Second Edition. SAS Press and John Wiley Sons Inc.
Ongley, E.D. 1978. Land use, Water Quality and River-Mouth Loadings : a Selective Overview for Southern Ontario by International Reference Group on Great Lakes Pollution from Land Use Activities. International Joint Commission.
Ontario Ministry of Environment and Energy. 1994. Water Management policies and guidelines, Provincial Water Quality Objectives. PIBS 3303E. Queen’s Printer for Ontario.
Quinn, G.P. and Keough, M.J. 2002. Experimental Design and Data Analysis for Biologists. Cambridge University Press. Cambridge, U.K.
Rantz, S.E. 1982. Measurement of Streamflow : Volume 1. Measurement and Discharge and Computation Volume of Stage. Geological Survey Water-Supply Paper 2175. United States Geological Survey. United States Government Printing Office, Washington, USA.
Rosamond, M.S., S.J. Thuss, S.L. Schiff, and R.J. Elgood. 2011. Coupled cycles of dissolved oxygen and nitrous oxide in rivers along a trophic gradient in southern Ontario, Canada. Journal of Environmental Quality 40, no. 1: 256-270.
Runkel, R.L, C.G. Crawford, and T.A. Cohn. 2004. Load Estimator (Loadest ): A Fortran Program For Estimating Constituent Loads In Streams And Rivers Techniques And Methods Book 4, Chapter A5 A FORTRAN Program for Estimating Constituent Loads in Streams and Rivers. Reston, Virginia.
Sanchez, C.A., and A.M. Blackmer. 1988. Recovery of anhydrous ammonia-derived nitrogen-15 during three years of corn production in Iowa. Agronomy Journal 80, no. 1: 102-108.
Sandstedt, C.A. 1990. Nitrates: sources and their effects upon humans and livestock. American University. Washington, D.C.
Schelde, K., L.W. de Jonge, C. Kjaergaard, M. Laegdsmand, and G.H. Rubæk. 2006. Effects of Manure Application and Plowing on Transport of Colloids and Phosphorus to Tile Drains. Vadose Zone Journal 5, no. 1 (March): 445-458.
Schilling, K.E., and J. Spooner. 2006. Effects of watershed-scale land use change on stream nitrate concentrations. Journal of Environmental Quality 35, no. 6: 2132-2145.
Schilling, K.E., and Y. Zhang. 2004. Base flow contribution to nitrate-nitrogen export from a large, agricultural watershed, USA. Journal of Hydrology 295, no. 1-4 (August): 305-316.
Sklash, M. G., Gillham, R. W., & Cherry, J. A. 1978. Studies Of The Agricultural Contribution To Nitrate Enrichment Of Groundwater And The Subsequent Nitrate Loading. Part III: Mechanisms Of Runoff Generation And Nitrate Flux To Streams During Runoff Events. Final report Project No. 41122 A PLUARG, Task Group C Study.
Smith, R.A., R.B. Alexander, and G.E. Schwarz. 2003. Natural background concentrations of nutrients in streams and rivers of the conterminous United States. Environmental Science & Technology 37, no. 14 (July): 3039-3047.
Smith, V.H. 2003. Eutrophication of freshwater and coastal marine ecosystems: a global problem. Environmental Science and Pollution Research International 10, no. 2 (January): 126-39.
Soil Resource Group. 2010. Agricultural land management and water quality data evaluation in representative agricultural watersheds in the Grand River and Thames River basins. OMAFRA Great Lakes Project 07-054.
Stewart, W.M., D.W. Dibb, A.E. Johnston, and T.J. Smyth. 2005. The Contribution of Commercial Fertilizer Nutrients to Food Production. Agronomy Journal 97, no. 1: 1-7.
Tesoriero, A.J., J.H. Duff, D.M Wolock, N.E Spahr, and J.E. Almendinger. 2009. Identifying pathways and processes affecting nitrate and orthophosphate inputs to streams in agricultural watersheds. Journal of Environmental Quality 38, no. 5: 1892-1900.
Todd, A. 2006. Water Sample Collection and Submission Protocols for Partners in the Provincial Water Quality Monitoring Network.
Vitousek, P.M, J.D. Aber, R.W. Howarth, G.E. Likens, P.A. Matson, D.W. Schindler, W.H. Schlesinger, and D.G. Tilman. 1997. Human alteration of the global nitrogen cycle: sources and consequences. Ecological Applications 7, no. 3: 737-750.
Zuur, A.F., Ieno, E.N., and Smith, G.M. 2007. Analysing ecological data. Springer Science + Business Media. New York.