2015 Energy consumption and greenhouse gas emission report
Our progress in meeting targets for energy conservation and reducing greenhouse-gas emissions.
Executive summary
In support of the 2007 Go Green Action Plan (GGAP), the Ministry of Economic Development, Employment and Infrastructure (MEDEI) has committed to reducing Greenhouse Gas (GHG) emissions through energy conservation measures. The GGAP outlines overall Ontario Public Service (OPS) targets for energy generation emissions (nuclear, hydro, natural gas, renewable energy), vehicle emissions and OPS building related emissions.
To help achieve the overall GGAP targets, MEDEI has committed to a building related emissions reduction of 19% by 2014 and 27% by 2020 (over a 2006 baseline). The targets must be achieved while ensuring uninterrupted ministry program delivery.
Annual energy and GHG reporting is required by The Ontario Facilities Consumption Directive (Green Energy Act). Annually, the energy and GHG reporting requirement is broken into two sections. The first is the 5 - Year Energy Plan reporting on target progress and initiatives for MEDEI buildings. The second part is the Enterprise Wide GHG Summary which includes the MEDEI managed portfolio as well as custodial ministries. Custodial ministries have buildings that are managed by the ministry directly and fall outside of the scope of MEDEI management.
In support of the building related emissions targets (19% and 27%), an electricity reduction target was set at 20% by 2012 (over a 2002 baseline). In order to achieve this target, Infrastructure Ontario was directed by MEDEI to implement building related electricity reduction initiatives. The target has been achieved.
Moving forward, MEDEI has given Infrastructure Ontario direction to implement a new target encompassing all fuel types (electricity, natural gas, propane, fuel oil, chilled water, steam). The new target is a 2% reduction year over year for all fuel types.
The progress made since committing to emission reduction targets has been positive. Energy reduction programs have reduced emissions through a variety of initiatives including major building retrofits, retro-commissioning and implemented design guidelines/standards. These energy reduction programs paired with cleaner electricity generation in Ontario (through phase out of coal and increased renewable energy), have provided an additional positive impact to the projected achievement of the 2014 target.
Although it is projected that the target will be achieved, the 2020 target remains uncertain. Factors such as the end of dedicated energy funding, nuclear fleet refurbishments, increased natural gas generation, slow renewable generation uptake and increased instances of inclement weather could have major negative impacts on achieving the 2020 target.
MEDEI reports annually using an internally developed methodology, which incorporates elements of The World Resources Institute’s Greenhouse Gas Protocol (GHG Protocol). The GHG protocol provides standards and guidance for reporting greenhouse gases. Because of the nature of government facilities, elements of the GHG protocol were adapted into an internal methodology for applicability to the MEDEI portfolio.
As of this report, MEDEI is on track to hitting the 2014 reduction target.
Chart 1: Emissions target
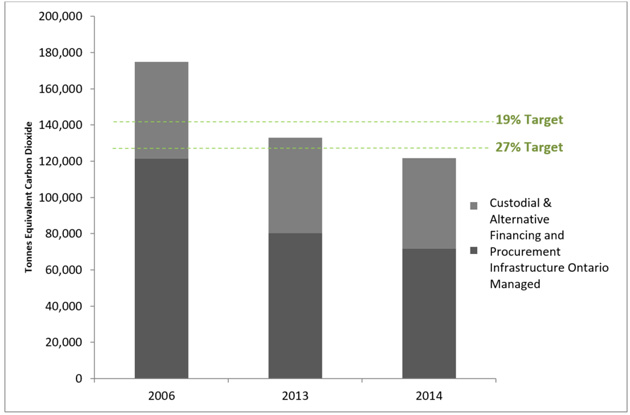
2014 emissions are projected based on emissions factor estimations from the Ministry of Energy. Final emissions will be presented in 2016 with release of the National Inventory Report.
Reporting requirements
As per the Ontario Facilities Consumption Reporting Directive, all ministries are required to post an annual 5-Year Energy Plan outlining the energy impact for the previous calendar year as well as initiatives/plans to reduce emissions. Although each ministry is responsible for its own plan, the Ministry of Economic Development, Employment and Infrastructure (MEDEI) has the responsibility to report on all government facilities whether or not they fall under the scope of MEDEI management. Ministry buildings that do not fall under the prevue of MEDEI/Infrastructure Ontario are defined as a custodial ministry.
The objective of the energy plan is to:
- outline progress and strategies to meet and exceed Ontario Public Service (OPS) GHG reduction targets across the MEDEI owned built environment
- establish a baseline, methodology and a framework to achieve energy conservation targets across the Infrastructure Ontario managed portfolio
- achieve GHG emission reduction goals of 19% by 2014 and 27% by 2020 over a 2006 baseline
This report explains the progress of the Ontario Government’s commitment to reducing emissions in the MEDEI building portfolio. Data in this report covers the 2014 calendar year.
Reporting scope
This report accounts for the following fuel types and scope emissions. Scope 1 emissions can be explained as fuel burned on-site (for example, the operation of a boiler). These include:
- natural gas
- fuel oil (2)
- propane
Scope 2 emissions can be explained as a delivered fuel type where the energy was generated off-site and delivered to the building (for example, electricity generated by a mixture of fuel types and delivered to the building). These include:
- electricity
- steam hot water
- chilled water
Portfolio overview
The MEDEI portfolio is spread throughout the province and includes the management of approximately 50 million square feet of buildings and structures of which core buildings where MEDEI has capital and operational responsibility represents approximately 22 million square feet. This report includes emissions reporting for 413 buildings representing approximately 19 million square feet and are buildings where MEDEI has a level of control that allows energy conservation measures (ECMs) to be implemented. These are designated as target class facilities. Table 1 provides an overview of the reported portfolio.
Table 1: Target class square footage
| Building type | Building size in square feet |
|---|---|
| Office A | 6,989,917 |
| Courthouse | 4,013,538 |
| Office B | 3,105,744 |
| Laboratory | 1,147,502 |
| Detachment | 743,810 |
| Classrooms | 587,096 |
| Office C | 548,386 |
| Detention | 500,386 |
| Museum | 385,962 |
| Assembly | 328,898 |
| Garage | 225,313 |
| Storage A | 88,651 |
| Medical | 56,871 |
| Public Info | 35,362 |
| Warehouse | 4,760 |
| IT Facility | 2,438 |
Energy performance
Energy usage has seen a steady decline between 2006 and 2014 with most savings attributed to electricity as a result of the electricity reduction target that ran from 2003-2012. Where in the past we have seen an annual decline in fuel usage, cold winters in 2013 and 2014 showed stabilized, and even slightly increased, usage. Because of past energy conservation initiatives, the impact of much colder winters had little effect impact on fuel usage.
Table 2: Energy performance of different types of fuels measured in equivalent kilowatt hour (eKWh) with 2006 as the baseline year.
| 2006 | 2013 | 2014 | 2006 vs 2014 | 2006 vs 2013 | 2013 vs 2014 | |
|---|---|---|---|---|---|---|
| Electricity | 316,419,315 | 246,676,430 | 245,191,511 | (22.51%) | (22.04%) | (0.60%) |
| Natural gas | 231,389,763 | 240,093,845 | 236,683,253 | 2.29% | 3.76% | (1.42%) |
| Fuel oil | 3,211,340 | 4,268,872 | 3,599,849 | 12.10% | 32.93% | (15.67%) |
| District chilled water | 0 | 877,744 | 760,686 | N/A | N/A | (13.34%) |
| Propane | 3,061,507 | 2,926,785 | 3,376,702 | 10.30% | (4.40%) | 15.37% |
| District steam | 68,300,283 | 62,645,923 | 65,055,846 | (4.75%) | (8.28%) | 3.85% |
| District hot water | 0 | 450,540 | 455,235 | N/A | N/A | 1.04% |
| Total | 622,382,208 | 557,940,139 | 555,123,082 | (10.81%) | (10.35%) | (0.50%) |
Emissions performance
The major driver of emissions savings has come as a result of the phase out of coal electricity generation and a resultant lower electricity emission factor (EF). Going forward into the 2020 reporting year it is not expected that there will be EF increases or decreases to the magnitude of the coal phase out. Although there is some stabilization of the emissions factors there are variables such as the nuclear refurbishment program and inclement weather events that could impact progress negatively. It is estimated that outside variables like these could raise the electricity emission factor as much as 20%, putting the 2020 target at risk.
Table 3: Carbon dioxide emission performance of different types of fuels with 2006 as the baseline year.
| 2006 | 2013 | 2014 | 2006 vs 2014 | 2006 vs 2013 | 2013 vs 2014 | |
|---|---|---|---|---|---|---|
| Electricity | 60,480 | 18,994 | 12,260 | (79.73%) | (68.59%) | (35.45%) |
| Natural gas | 41,467 | 43,026 | 42,415 | 2.29% | 3.76% | (1.42%) |
| Fuel oil | 811 | 1,078 | 909 | 12.08% | 32.92% | (15.68%) |
| District chilled water | 0 | 7 | 6 | N/A | N/A | (14.29%) |
| Propane | 638 | 610 | 704 | 10.34% | (4.39%) | 15.41% |
| District steam | 18,131 | 16,630 | 17,270 | (4.75%) | (8.28%) | 3.85% |
| District hot water | 0 | 101 | 102 | N/A | N/A | 0.99% |
| Total | 121,527 | 80,446 | 73,666 | (39.38%) | (33.80%) | (8.43%) |
Water performance
2015 is the second year that water is being reported. Although no targets have been set for water, the province is gathering and analyzing data in anticipation of a water reduction program. Updated datasets by building type are outlined in 3 Water is tracked on an intensity basis that is more indicative of performance than just absolute values.
Table 4: Water intensity by building type measured in 100 cubic metres per gsf
| 2013 | 2014 | |
|---|---|---|
| Assembly | 12.49 | 12.64 |
| Classrooms | 9.18 | 12.20 |
| Courthouse | 5.01 | 4.32 |
| Detachment | 10.49 | 10.77 |
| Detention | 4.12 | 6.51 |
| Garage - Vehicle | 5.96 | 6.01 |
| IT facility | 2.63 | 2.56 |
| Laboratory | 23.27 | 18.67 |
| Museum | 1.69 | 1.18 |
| Office A | 5.75 | 5.34 |
| Office B | 4.34 | 5.13 |
| Office C | 4.15 | 5.32 |
| Public info | 50.27 | 28.82 |
| Storage A | 4.22 | 2.52 |
| Warehouse | 3.21 | 3.33 |
Programs and initiatives
A comprehensive strategy is in place including several programs and initiatives that link together to form a high performing and integrated approach to energy management. The programs and initiatives outlined in this section do not (although they can) operate as singularities but work together to achieve greater goal of energy conservation.
Benchmarking
Internal benchmarking
A robust internal benchmarking program was developed over the last two years. The program follows the normalize, analyze and prioritize approach and identifies buildings for further evaluation. The results of benchmarking are brought forward to facility managers as part of the Regional Engagement Strategy and further investigation is assigned. The results of investigation often times result in operational changes or proposals for capital projects.
External benchmarking
In 2013 Natural Resources Canada (NRCan) released the Energy Star Portfolio Manager (ESPM) for Canada. In support of this program Infrastructure Ontario uploaded three years’ worth of energy data for over 9 million square feet of office. Currently the internal benchmarking program is used primary benchmarking resource but ESPM is often used as a secondary perspective and can in some cases provide additional support to building prioritization.
Building optimization process
The Building Optimization Process (BOP) documents the process developed to improve energy and water performance from Ontario Government owned and managed buildings. This will help identify improvement measures and projects which will improve the performance of the buildings. This process will apply to all MEDEI owned buildings which Infrastructure Ontario manages and covers all building sizes and types. Buildings are selected through a site by site review process analyzing energy, project and occupancy data among many other factors. A list of scheduled buildings for BOP implementation will be selected on an annual basis.
Regional engagement strategy
Engagement of regional facilities staff, including building operators and facility managers, is crucial to understanding what is actually happening at the building level. By including staff that are actually working in the buildings, it opens up the opportunity to get an inside look at what is actually happening inside each facility. Facilities staff have the opportunity to have their voices heard and are given the opportunity to put forth their ideas of best energy management practices for their buildings. Through these discussions programs such as BOP are implemented which can result in operational or capital improvements
Smart green portfolio strategy
The Smart Green Portfolio Strategy is a high performance building portfolio strategy that utilizes advanced automation and integration to measure, monitor, and control to optimize operations and maintenance at the lowest cost and environmental impact over the building lifecycle. The strategy involves integrating relevant building systems including, but not limited to, HVAC, lighting, security, elevators, fire protection and life safety in order to improve performance and to reduce energy consumption in a facility. Smart green also includes the infrastructure required for centralized remote monitoring of building systems. The combination of integrated automation with centralized monitoring allows for all relevant building system information to be available to a supervisor for alarm and event management, troubleshooting, dispatch for service or repair, historical record keeping and utility metering including sub-metering for individual tenants
Design guidelines
The Building Systems Design Guideline standardizes design and construction objectives and technical requirements across the MEDEI owned portfolio of Infrastructure Ontario managed buildings to ensure higher performing buildings are designed and constructed in accordance with the Smart Green Portfolio strategy. It ensures consistency and integrates all relevant internal Infrastructure Ontario guidelines and systems, in order to achieve increased occupant comfort and satisfaction, improved operational performance, Improved energy efficiency, and includes provision of technologies and tools to efficiently monitor, control and manage building systems.
Commissioning guideline
The intent of the guideline is to ensure building equipment performs as specified and originally intended, installation of equipment meets contract specifications, the commissioning of building systems/equipment, sequence of operations have been verified to on site conditions, and the total performance/integration of new equipment/systems are fully commissioned.
Measurement and verification
Measurement and verification (M&V) plays a key role in quantifying savings from energy conservation projects. In fiscal year 2014/15 Infrastructure Ontario piloted M&V on a variety of projects from cooling towers to lighting retrofits. Through these pilots the M&V program has become more refined and has been integrated into the Design Guidelines as a requirement. Results from the M&V program will be used to help better inform operational decisions and future capital projects.
Challenges, risks and opportunities
Energy program funding
For fiscal year 2014/15 there was no funding for energy specific projects. The strategies listed in above are a result of the funding shortfall and looks to focus on the operational opportunity rather than on capital projects.
2020 Target uncertainty
The province looks to be on track to hit the 2014 19% reduction target but a variety of factors are in play to put the 2020 27% reduction target at risk.
Electricity generation mix
Currently the Ontario is relying on nuclear electricity generation as about 50% of its base load with majority of the remainder made up of hydro and natural gas. Nuclear, along with hydro, generation are essentially emissions neutral electricity sources where natural gas has associated emissions due to burning of fuel. From an emissions perspective the province is benefitting from the phase out of coal and nuclear base load generation and as a result is experiencing the lowest emissions factors in over 25 years.
In future years, the province will be looking to refurbish its nuclear fleet meaning that multiple reactors will be shut down for extended periods of time. The result is that natural gas will be used as a swing resource to pick up the load of the downed nuclear fleet. Because of the increased use of natural gas, the province can expect to have escalating emissions factors going into the 2020 target year. New Buildings
New buildings
As new facilities are built they are added to energy and emissions reporting increasing the required GHG emissions to be reduced.
Although new builds are built to the highest standards of LEED and utilize the most modern energy management practices, the target is negatively impacted as each new build is net new added energy.
Enterprise wide summary
Table 5: Summary of emission by reporting organization with 2006 as the baseline year. All values subject to change.
| Reporting entity | 2006 Tonnes co2e |
2013 Tonnes co2e |
2014 Tonnes co2e |
2006 vs 2014 | 2006 vs 2013 | 2013 vs 2014 |
|---|---|---|---|---|---|---|
| Infrastructure Ontario | 121,528 | 80,447 | 71,650 | (41.0%) | (33.8%) | (10.9%) |
| Infrastructure Ontario (Alternative Financing and Procurement | 12,118 | 12,721 | N/A | N/A | 5.0% | |
| Ministry of Community Safety and Correctional Services | 34,429 | 24,347 | 22,911 | (33.5%) | (29.3%) | (5.9%) |
| Ministry of Child and Youth Services | 5,391 | 5,085 | 4,573 | (15.2) | (5.7%) | (10.1%) |
| Ministry of Education | 9,477 | 8,258 | 8,049 | (15.1%) | (12.9%) | (2.5%) |
| Ministry of Natural Resources | 3,750 | 2,633 | 1,723 | (54.1%) | (29.8%) | (34.6%) |
| Ministry of Transportation | 302 | 213 | 121 | (60.0%) | (29.4%) | (43.3%) |
| Total | 174,877 | 133,100 | 121,748 | (30.4%) | (23.9%) | (8.5%) |
Roles and responsibilities
Most government operations are accommodated in facilities which are comprised of land, parking areas, landscaping, structures and buildings. For the purpose of the directive, all energy consumption utilized at a facility level will be allocated to buildings with the exception of provincial parks which will be tracked at the facility (or park) level. This will be reported on an annual basis.
A rolling five year Energy Consumption and GHG Emissions Report will be required from MEDEI and each custodial ministry related to the government-owned facilities over which they have direct operational control.
MEDEI directly managed facilities by Infrastructure Ontario
Infrastructure Ontario manages the majority of the province’s portfolio on behalf of MEDEI. Infrastructure Ontario is a crown agency that oversees the day-to-day operations of the real-estate portfolio and implements Ministry policies for buildings, lands, and leases.
MEDEI has three separate responsibilities outlined within the directive:
- reporting emissions publicly for MEDEI-owned facilities
- reporting on OPS Enterprise-wide status
- developing a 5-year energy conservation strategy
Infrastructure Ontario – Alternative financing procurement
Per the directive, these sites are required to report their GHG emissions; however IO does not have direct operational control of the facilities (managed by private service providers). The reporting result is a separate line item to track Infrastructure Ontario’s sector progress.
Custodial ministries
Custodial ministries have day-to-day operational control over their own facilities. These ministries include:
- Ministry of Transportation (MTO)
- Ministry of Education (EDU)
- Ministry of Child and Youth Services (MCYS)
- Ministry of Community Safety and Correctional Services (MCSCS)
- The Ministry of Natural Resources (MNR)
Custodial ministries have two primary responsibilities outlined within the directive:
- reporting emissions publicly for facilities managed on a day-to-day basis
- a 5-year energy conservation strategy (for each custodial ministry)
Methodology
World Resource Institute protocol (WRI)
WRI is an international protocol for GHG accounting. Infrastructure Ontario will follow this accounting standard as a guideline in its reporting of the enterprise GHG baseline. Examples of applied principles outlined within the WRI protocol include: tracking inventories, buying, selling, demolishing, and adding buildings.
Target class vs. Non-target class facilities
MEDEI/Infrastructure Ontario with input from ministries defined which buildings would be reported on.
Target class facilities are a subset of all government-owned facilities that have been identified as having energy conservation potential. The energy consumption at target class Facilities is required to be reported to both MEDEI and publicly as a requirement of the directive. Reporting is to be done at the building level within each facility.
Non-target class facilities include leased and other government-owned facilities. These are facilities where the government does not have direct operational control of the facility or it may be difficult to conserve energy due to safety considerations or programmatic impacts and constraints. Although energy consumption associated with these facilities/buildings are not required to be reported, ministries are encouraged to include any success stories associated with conservation efforts at non-target class facilities through annual reporting cycles, where appropriate.
Table 6: Types of facilities by its custodial ministry.
| Ministry | Custodial target class facilities | Custodial non-target class facilities |
|---|---|---|
| Ministry of Transportation (28 sites reported) |
Truck inspection stations | Patrol yards, remote airports, street lights |
| The Ministry of Natural Resources (71 parks reported) |
Parks | Fish hatcheries, ranger camps, forward fire stations |
| Ministry of Education (73 facilities reported) |
Provincial schools | All facilities included |
| Ministry of Community Safety and Correctional Services (33 facilities reported) |
Adult detention centres | All facilities included |
| Ministry of Child and Youth Services (12 facilities reported) |
Youth detention centres | All facilities included |
Data reporting purpose
Preparation of energy consumption and GHG emissions plans will help articulate the government’s energy conservation progress. Publication of the reports will provide a model and benchmark for the broader public sector. Reports also facilitate sharing of best practices and continuous improvement. Reports will include energy consumption in government-owned facilities, proposed measures to increase conservation efforts and progress since the previous Report.
The ministries that are impacted by the directive are ministries that have direct operational control over government owned facilities.
Infrastructure Ontario – Alternate Financing and Procurement: 24 sites reported. Infrastructure Ontario does not have operational control of these buildings, but maintains a responsibility to report on them.
- These sites are not required to report emissions on its hospitals.
- For the 2014 report, only fully operational facilities are being reported. There are 24 facilities reporting in 2015.
- These sites will register zero consumption for the 2006 Baseline year and will only add to the Enterprise-wide emission inventories as more sites are added (regardless of how energy efficient).
MEDEI – Infrastructure Ontario managed: 413 sites reported