2017-18 First Quarter Finances
August 2017
The First Quarter Finances report contains information about Ontario’s 2017–2018 fiscal outlook as of June 30, 2017.
Introduction
The Ontario Quarterly Finances contains updated information about Ontario's 2017–18 fiscal outlook, including updated information about the major components of revenue and expense as set out in the 2017 Budget.
Section A: 2017–18 Fiscal Outlook
The government is continuing to project a balanced budget in 2017–18, unchanged from the 2017 Budget forecast. A balanced budget means that Ontarians will continue to benefit from expanded services and more assistance with everyday costs. These include covering the costs of pharmacare for children and youth under OHIP+, providing electricity cost relief, and helping 100,000 more children access affordable, quality licensed child care.
Stronger-than-expected economic activity in the January to March quarter of 2017 has lifted private-sector forecasts for Ontario real GDP growth in 2017. The Ontario economy is benefiting from a growing economy in the United States, low oil prices and a competitive Canadian dollar. The outlook for 2017 real GDP growth in the rest of Canada has also been revised upward.
New investments being reported in the 2017–18 First Quarter Finances include funding for research and remediation of the English-Wabigoon River system, compensation for flooding of Lac des Mille Lacs First Nation reserve land, support for international famine relief efforts, and investments under the early learning and childcare bilateral agreement with the federal government.
Further details on the Province's fiscal plan will be provided in future fiscal updates.
2017–18 In-year fiscal performance
| Item | 2017–18 Budget Plan |
2017–18 Current Outlook |
2017–18 In-Year Change |
|---|---|---|---|
| Revenue | 141,650 | 141,795 | 145 |
| Expense - Programs | 129,469 | 129,614 | 145 |
| Expense - Interest on Debt | 11,581 | 11,581 | - |
| Total Expense | 141,050 | 141,195 | 145 |
| Surplus/(Deficit) Before Reserve | 600 | 600 | - |
| Reserve | 600 | 600 | - |
| Surplus/(Deficit) | 0 | 0 | - |
Note: Numbers may not add due to rounding.
Total revenue is projected to be $141.8 billion, slightly higher than the 2017 Budget plan, reflecting $145.0 million in new revenue as a result of the bilateral agreement between Ontario and the federal government for early learning and childcare.
The outlook for program expense is $129.6 billion, also slightly higher than the 2017 Budget plan, reflecting a corresponding increase of $145.0 million for investments resulting from the bilateral agreement between Ontario and the federal government for early learning and childcare.
The Province's interest on debt expense forecast, at $11.6 billion, is unchanged from the 2017 Budget forecast.
The 2017–18 outlook also maintains a $600 million reserve to protect the fiscal outlook against unforeseen adverse changes in the Province's revenue and expense, including those resulting from changes in Ontario's economic performance.
Ontario's net debt-to-GDP ratio is expected to be 37.5 per cent in 2017–18, unchanged from the 2017 Budget forecast.
Section B: Details of in-year changes
Revenue
The 2017–18 revenue outlook, at $141.8 billion, is $145.0 million higher than the 2017 Budget forecast due to new funding for early learning and childcare as a result of a bilateral agreement between Ontario and the federal government.
At this point in the year, there are a broad range of risks that could materially affect the 2017–18 revenue outlook. Stronger economic growth in 2017 could support stronger revenue growth. Other risks include those related to the processing of 2016 tax returns and updated entitlements under the Harmonized Sales Tax and federal transfer payment programs. The government will continue to monitor economic and revenue developments and will provide further details in future fiscal updates.
Expense
The 2017–18 total expense outlook, at $141.2 billion, is an increase of $145.0 million from the 2017 Budget forecast. Since the 2017 Budget, a number of program expense changes have occurred and have been accommodated within the fiscal plan.
Key changes to program expense projections to be offset from the contingency funds include:
- An increase of $2.7 million for research and $85.0 million for remediation of the English-Wabigoon River system from mercury contamination, to be undertaken in partnership with First Nations and stakeholders.
- An increase of $14.8 million as part of the Lac des Mille Lacs flooding claim settlement in compensation for flooding of Lac des Mille Lacs First Nation reserve land.
- An increase of $2.5 million for famine relief efforts in Yemen, South Sudan, Somalia and Nigeria.
Other key changes to program expense projections include:
- An increase of $145.0 million under the early learning and childcare bilateral agreement to increase the accessibility and affordability of high-quality licensed child care and quality early learning opportunities, which is offset by an increase in federal revenue.
- A transfer of $3.1 million from the Ministry of Tourism, Culture and Sport to various partner ministries to revitalize communities and celebrate Ontario's 150th anniversary.
- A transfer of $8.5 million from the Ministry of Advanced Education and Skills Development to partner ministries for Equitable Access to Postsecondary Education, to support student access and success.
- A transfer of $1.0 million from the Ministry of Finance to the Ministry of Tourism, Culture and Sport to improve digital resources and services in rural, remote and First Nation public libraries, which was one of the top three ideas selected for Budget Talks during consultations for the 2017 Budget.
- A transfer of $0.5 million, as part of Ontario's Action Plan for Reconciliation, from the Ministry of Indigenous Relations and Reconciliation to Cabinet Office to further support the development of an Indigenous-focused anti-racism strategy.
- A transfer of $0.3 million from the Ministry of Citizenship and Immigration to Cabinet Office to support disaster relief efforts in Italy in response to a series of earthquakes last year.
Interest on debt expense at $11.6 billion is unchanged from the 2017 Budget forecast.
Fiscal prudence
The 2017 Budget included a $600 million reserve in 2017–18 to protect the fiscal outlook against adverse changes in the Province's revenue and expense. The current fiscal outlook maintains the $600 million reserve.
The current outlook also maintains contingency funds to help mitigate expense risks — particularly in cases where health and safety may be compromised or services to the most vulnerable are jeopardized — that may otherwise adversely affect Ontario's fiscal performance.
Section C: Ontario's economic outlook
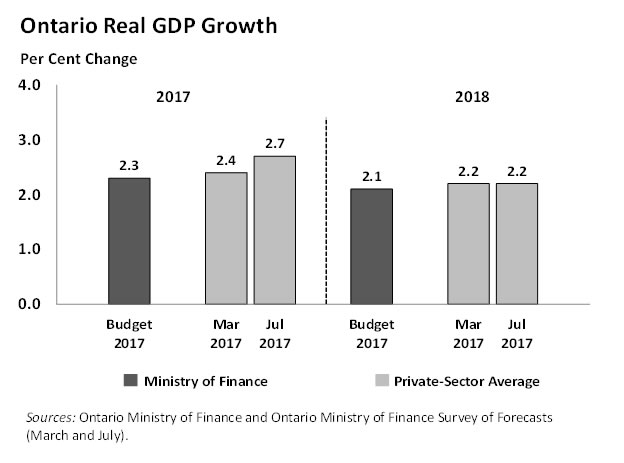
As of July 18, 2017, private-sector forecasters, on average, project Ontario's real GDP to increase by 2.7 per cent in 2017, up from the 2.4 per cent advance at the time of the 2017 Budget. The outlook for growth in 2018 is unchanged at 2.2 per cent.
In July, the International Monetary Fund's World Economic Outlook Update projected growth for the world economy of 3.5 per cent in 2017, slightly stronger than the forecast at the time of the 2017 Budget. The improved outlook reflects slightly stronger forecasts for both advanced and emerging market economies. However, the average forecast for 2017 real GDP growth in the United States, Ontario's largest trading partner, has moved slightly lower, to 2.2 per cent.
Section D: Economic performance
Ontario's economy continues to grow strongly. Real GDP advanced by 1.0 per cent in the first quarter of 2017 (January–March), with solid growth in business investment and consumer spending. Ontario's GDP growth outpaced Canada's and all other G7 countries in the first quarter. Over the 2014–16 period, Ontario's real GDP growth outpaced that of all G7 countries.
The strength of Ontario's economy has supported steady employment gains. Over the first half of 2017, employment increased by 91,000 net new jobs compared to the same period last year. This follows 76,400 net new jobs in 2016. The unemployment rate has also shown a marked improvement. As of June 2017, the unemployment rate was 6.4 per cent, below the national average for the 27th consecutive month.
Most key economic indicators, including manufacturing sales, retail sales and wholesale trade, have posted solid gains so far in 2017. After a very strong start to the year, housing market activity has moderated in recent months.
Ontario key economic indicators
| Item | Monthly 2017 Apr |
Monthly 2017 May |
Monthly 2017 June |
Quarterly 2017Q1 |
Quarterly 2017Q2 |
Annual 2016 |
Year-to-date 2017 |
|---|---|---|---|---|---|---|---|
| Gross Domestic Product - Real GDP | N/A | N/A | N/A | 1.0 | N/A | 2.7 | N/A |
| Gross Domestic Product - Nominal GDP | N/A | N/A | N/A | 2.0 | N/A | 4.6 | N/A |
| Labour Market - Labour Force (Change in 000s) | (46.8) | 72.1 | (12.7) | 39.1 | (5.1) | 63.4 | 66.3 |
| Labour Market - Employment (Change in 000s) | (1.6) | 19.9 | (6.1) | 36.4 | 3.7 | 76.4 | 91.0 |
| Labour Market - Unemployment Rate (%) | 5.8 | 6.5 | 6.4 | 6.3 | 6.2 | 6.5 | 6.4 |
| Other Key Economic Indicators - Retail Sales | 1.1 | 0.2 | N/A | 2.0 | N/A | 7.1 | 7.1 |
| Other Key Economic Indicators - Housing Starts | (17.1) | (27.1) | 44.4 | 17.4 | (20.7) | 6.8 | 3.0 |
| Other Key Economic Indicators - MLS Home Resales | (5.8) | (15.0) | (11.7) | 5.2 | (15.6) | 9.5 | (1.0) |
| Other Key Economic Indicators - Manufacturing Sales | (0.7) | 2.6 | N/A | 1.8 | N/A | 4.0 | 3.2 |
| Other Key Economic Indicators - Wholesale Trade | 1.1 | 0.1 | N/A | 4.6 | N/A | 6.4 | 9.3 |
| Other Key Economic Indicators - Consumer Price Index1 | 1.9 | 1.4 | 1.3 | 2.2 | 1.5 | 1.8 | 1.8 |
[1] Per cent change from a year earlier; data not seasonally adjusted.
N/A = Data not available.
Sources: Statistics Canada, Ontario Ministry of Finance, Canada Mortgage and Housing Corporation and Canadian Real Estate Association.
Section E: Details of ontario's finances
Revenue
| Item | 2017–18 Budget Plan |
2017–18 Current Outlook |
2017–18 In-Year Change |
|---|---|---|---|
| Taxation Revenue - Personal Income Tax | 35,032 | 35,032 | - |
| Taxation Revenue - Sales Tax1 | 26,011 | 26,011 | - |
| Taxation Revenue - Corporations Tax | 13,817 | 13,817 | - |
| Taxation Revenue - Education Property Tax2 | 6,002 | 6,002 | - |
| Taxation Revenue - Employer Health Tax | 6,117 | 6,117 | - |
| Taxation Revenue - Ontario Health Premium | 3,789 | 3,789 | - |
| Taxation Revenue - Gasoline Tax | 2,663 | 2,663 | - |
| Taxation Revenue - Land Transfer Tax | 3,139 | 3,139 | - |
| Taxation Revenue - Tobacco Tax | 1,291 | 1,291 | - |
| Taxation Revenue - Fuel Tax | 746 | 746 | - |
| Taxation Revenue - Beer and Wine Tax | 619 | 619 | - |
| Taxation Revenue - Electricity Payments In Lieu of Taxes | 405 | 405 | - |
| Taxation Revenue - Other Taxes | 466 | 466 | - |
| Total Taxation Revenue | 100,097 | 100,097 | - |
| Government of Canada - Canada Health Transfer | 14,340 | 14,340 | - |
| Government of Canada - Canada Social Transfer | 5,307 | 5,307 | - |
| Government of Canada - Equalization | 1,424 | 1,424 | - |
| Government of Canada - Infrastructure Programs | 2,328 | 2,328 | - |
| Government of Canada - Labour Market Programs | 977 | 977 | - |
| Government of Canada - Social Housing | 412 | 412 | - |
| Government of Canada - Other Federal Payments | 893 | 1,038 | 145 |
| Total Government of Canada | 25,681 | 25,826 | 145 |
| Government Business Enterprises - Ontario Lottery and Gaming Corporation | 2,134 | 2,134 | - |
| Government Business Enterprises - Liquor Control Board of Ontario | 2,137 | 2,137 | - |
| Government Business Enterprises - Ontario Power Generation Inc./Hydro One Ltd. | 617 | 617 | - |
| Total Government Business Enterprises | 4,888 | 4,888 | - |
| Other Non-Tax Revenue - Reimbursements | 984 | 984 | - |
| Other Non-Tax Revenue - Vehicle and Driver Registration Fees | 1,934 | 1,934 | - |
| Other Non-Tax Revenue - Electricity Debt Retirement Charge | 623 | 623 | - |
| Other Non-Tax Revenue - Power Supply Contract Recoveries | 292 | 292 | - |
| Other Non-Tax Revenue - Sales and Rentals | 3,006 | 3,006 | - |
| Other Non-Tax Revenue - Carbon Allowance Proceeds | 1,778 | 1,778 | - |
| Other Non-Tax Revenue - Other Fees and Licences | 984 | 984 | - |
| Other Non-Tax Revenue - Net Reduction of Power Purchase Contract Liability | 74 | 74 | - |
| Other Non-Tax Revenue - Royalties | 265 | 265 | - |
| Other Non-Tax Revenue - Miscellaneous Other Non-Tax Revenue | 1,044 | 1,044 | - |
| Total Other Non-Tax Revenue | 10,984 | 10,984 | - |
| Total Revenue | 141,650 | 141,795 | 145 |
[1] Sales Tax revenue is net of the Ontario Sales Tax Credit and the energy component of the Ontario Energy and Property Tax Credit.
[2] Education Property Tax revenue is net of the Ontario Senior Homeowners' Property Tax Grant and the property tax component of the Ontario Energy and Property Tax Credit.
Note: Numbers may not add due to rounding.
Total expense
| Ministry Expense | 2017–18 Budget Plan |
2017–18 Current Outlook |
2017–18 In-Year Change |
|---|---|---|---|
| Accessibility Directorate of Ontario Total | 20.1 | 20.2 | 0.1 |
| Advanced Education and Skills Development Total | 8,410.3 | 8,401.7 | (8.5) |
| Agriculture, Food and Rural Affairs (Base) | 949.1 | 949.1 | - |
| Time-Limited Assistance | - | - | - |
| Time-Limited Investments in Infrastructure | 77.4 | 77.4 | - |
| Agriculture, Food and Rural Affairs Total | 1,026.5 | 1,026.5 | - |
| Attorney General Total | 1,937.5 | 1,937.5 | - |
| Board of Internal Economy Total | 225.8 | 225.8 | - |
| Children and Youth Services Total | 4,443.8 | 4,444.4 | 0.6 |
| Citizenship and Immigration Total | 112.5 | 112.3 | (0.2) |
| Community and Social Services (Base) | 12,409.6 | 12,409.6 | - |
| Time-Limited Investments in Affordable and Supportive Housing | 9.3 | 9.3 | - |
| Community and Social Services Total | 12,418.9 | 12,418.9 | - |
| Community Safety and Correctional Services (Base) | 2,776.8 | 2,776.8 | - |
| Time-Limited Support for 2015 Pan/Parapan American Games Security | - | - | - |
| Community Safety and Correctional Services Total | 2,776.8 | 2,776.8 | - |
| Economic Development and Growth/Research, Innovation and Science (Base) | 971.0 | 971.0 | - |
| Green Investment Fund Initiatives | - | - | - |
| Economic Development and Growth/Research, Innovation and Science Total | 971.0 | 971.0 | - |
| Education (Base) | 26,518.1 | 26,672.4 | 154.2 |
| Teacher's Pension Plan | (531.0) | (531.0) | - |
| Education Total | 25,987.1 | 26,141.4 | 154.2 |
| Energy (Base) | 511.9 | 511.9 | - |
| Electricity Cost Relief Programs | 1,438.0 | 1,438.0 | - |
| Green Investment Fund Initiatives | - | - | - |
| Ontario Clean Energy Benefit | - | - | - |
| Strategic Asset Management and Transformation Related to Hydro One | 100.0 | 100.0 | - |
| Energy Total | 2,049.9 | 2,049.9 | - |
| Environment and Climate Change (Base) | 1,023.3 | 1,111.0 | 87.7 |
| Green Investment Fund Initiatives | - | - | - |
| Environment and Climate Change Total | 1,023.3 | 1,111.0 | 87.7 |
| Executive Offices (Base) | 56.1 | 56.6 | 0.5 |
| Time-Limited Assistance | - | 2.8 | 2.8 |
| Executive Offices Total | 56.1 | 59.4 | 3.3 |
| Finance (Base) | 932.9 | 931.9 | (1.0) |
| Ontario Municipal Partnership Fund | 505.0 | 505.0 | - |
| Power Supply Contract Costs | 292.0 | 292.0 | - |
| Finance Total | 1,729.9 | 1,728.9 | (1.0) |
| Office of Francophone Affairs Total | 5.3 | 5.6 | 0.3 |
| Government and Consumer Services Total | 593.3 | 593.3 | - |
| Health and Long-term Care (Base) | 53,762.8 | 53,762.8 | - |
| Time-Limited Investments in Affordable and Supportive Housing | - | - | - |
| Health and Long-term Care Total | 53,762.8 | 53,762.8 | - |
| Indigenous Relations and Reconciliation (Base) | 85.8 | 85.7 | (0.1) |
| Green Investment Fund Initiatives | - | - | - |
| One-Time Investments Including Settlements | 5.0 | 19.8 | 14.8 |
| Indigenous Relations and Reconciliation Total | 90.8 | 105.5 | 14.7 |
| Infrastructure (Base) | 173.0 | 173.0 | - |
| Federal-Provincial Infrastructure Programs | 689.4 | 689.4 | - |
| Infrastructure Total | 862.4 | 862.4 | - |
| International Trade Total | 61.6 | 62.2 | 0.6 |
| Labour Total | 311.8 | 311.8 | - |
| Municipal Affairs/Housing (Base) | 955.0 | 955.0 | - |
| Green Investment Fund Initiatives | - | - | - |
| Time-Limited Investments | 10.0 | 10.0 | - |
| Time-Limited Investments in Municipal, Social and Affordable Housing | 297.0 | 297.0 | - |
| Municipal Affairs/Housing Total | 1,262.0 | 1,262.0 | - |
| Natural Resources and Forestry (Base) | 754.6 | 754.6 | - |
| Emergency Forest Firefighting | 69.8 | 69.8 | - |
| Natural Resources and Forestry Total | 824.4 | 824.4 | - |
| Northern Development and Mines Total | 767.1 | 767.2 | 0.0 |
| Senior Affairs Total | 35.3 | 35.6 | 0.3 |
| Status of Women Total | 25.8 | 25.8 | - |
| Tourism, Culture and Sport (Base) | 1,390.5 | 1,388.4 | (2.1) |
| Time-Limited Investments to Support 2015 Pan/Parapan American Games | - | - | - |
| Tourism, Culture and Sport Total | 1,390.5 | 1,388.4 | (2.1) |
| Transportation (Base) | 4,213.7 | 4,213.7 | - |
| Green Investment Fund Initiatives | - | - | - |
| Time-Limited Investments in Infrastructure | 1,112.6 | 1,112.6 | - |
| Transportation Total | 5,326.2 | 5,326.2 | - |
| Treasury Board Secretariat (Base) | 336.8 | 336.8 | - |
| Employee and Pensioner Benefits | 1,208.0 | 1,208.0 | - |
| Operating Contingency Fund | 515.0 | 410.0 | (105.0) |
| Capital Contingency Fund | 100.0 | 100.0 | - |
| Treasury Board Secretariat Total | 2,159.8 | 2,054.8 | (105.0) |
| Interest on Debt1 | 11,581.3 | 11,581.3 | - |
| Year-End Savings2 | (1,200.0) | (1,200.0) | - |
| Total Expense | 141,050.0 | 141,195.0 | 145.0 |
[1] Interest on debt is net of interest capitalized during construction of tangible capital assets of $292 million in 2017–18.
[2] As in past years, the Year-End Savings provision reflects efficiencies through in-year expenditure management and underspending due to factors such as program management, and changes in project startups and implementation plans.
Note: Numbers may not add due to rounding.
2017–18 Infrastructure expenditures
| Sector | 2017–18 Current Outlook Investment in Capital Assets1 |
2017–18 Current Outlook Transfers and Other Infrastructure Expenditures2 |
2017–18 Current Outlook Total Infrastructure Expenditures3 |
|---|---|---|---|
| Transportation - Transit | 5,440 | 1,736 | 7,176 |
| Transportation - Provincial Highways | 2,900 | 120 | 3,020 |
| Transportation - Other Transportation, Property and Planning | 172 | 180 | 352 |
| Health - Hospitals | 2,588 | 295 | 2,883 |
| Health - Other Health | 81 | 261 | 342 |
| Education | 2,636 | 53 | 2,689 |
| Postsecondary - Colleges and Other | 976 | 13 | 989 |
| Postsecondary - Universities | – | 399 | 399 |
| Social | 20 | 454 | 474 |
| Justice | 107 | 227 | 334 |
| Other Sectors4 | 646 | 973 | 1,620 |
| Total | 15,566 | 4,711 | 20,277 |
[1] Includes $292 million in interest capitalized during construction.
[2] Includes transfers to municipalities, universities and non-consolidated agencies.
[3] Includes third-party investments in hospitals, colleges and schools, and federal contributions to provincial infrastructure investments.
[4] Includes government administration, natural resources, culture and tourism sectors.
Note: Numbers may not add due to rounding.
Review of selected financial and economic statistics
| Item | 2013–14 | 2014–15 | 2015–16 | Interim 2016–17 |
Current Outlook 2017–18 |
|---|---|---|---|---|---|
| Revenue | 115,911 | 118,546 | 128,377 | 133,228 | 141,795 |
| Expense - Programs1 | 115,792 | 118,225 | 120,925 | 123,502 | 129,614 |
| Expense - Interest on Debt2 | 10,572 | 10,635 | 10,967 | 11,250 | 11,581 |
| Total Expense | 126,364 | 128,861 | 131,891 | 134,752 | 141,195 |
| Surplus/(Deficit) Before Reserve | (10,453) | (10,314) | (3,514) | (1,524) | 600 |
| Reserve | – | – | – | – | 600 |
| Surplus/(Deficit) | (10,453) | (10,314) | (3,514) | (1,524) | – |
| Net Debt | 267,190 | 284,576 | 294,564 | 301,916 | 311,921 |
| Accumulated Deficit | 176,634 | 187,511 | 192,028 | 193,544 | 193,544 |
| Gross Domestic Product (GDP) at Market Prices | 695,349 | 727,962 | 763,276 | 798,484 | 832,888 |
| Primary Household Income | 472,921 | 490,023 | 511,781 | 531,116 | 551,691 |
| Population – July (000s) | 13,556 | 13,685 | 13,797 | 13,983 | 14,230 |
| Net Debt per Capita (dollars) | 19,710 | 20,795 | 21,350 | 21,592 | 21,921 |
| Household Income per Capita (dollars) | 34,886 | 35,807 | 37,094 | 37,983 | 38,771 |
| Interest on Debt as a Per Cent of Revenue | 9.1% | 9.0% | 8.5% | 8.4% | 8.2% |
| Net Debt as a Per Cent of GDP | 38.4% | 39.1% | 38.6% | 37.8% | 37.5% |
| Accumulated Deficit as a Per Cent of GDP | 25.4% | 25.8% | 25.2% | 24.2% | 23.2% |
[1] All years presented reflect recognizing jointly sponsored net pension assets for the Ontario Public Service Employees' Union Pension Plan (OPSEUPP) and Ontario Teachers' Pension Plan (OTPP) on the Province's financial statements.
[2] Interest on debt is net of interest capitalized during construction of tangible capital assets of $134 million in 2013–14, $202 million in 2014–15, $165 million in 2015–16, $121 million in 2016–17, and $292 million in 2017–18.
Note: Numbers may not add due to rounding.
Sources: Ontario Ministry of Finance and Statistics Canada.
Section F: Ontario's 2017–18 borrowing program
Borrowing program
| Item | 2017–18 Budget Plan |
2017–18 Current Outlook |
2017–18 In-Year Change |
|---|---|---|---|
| Deficit/(Surplus) | 0 | 0 | – |
| Investment in Capital Assets | 13.1 | 13.1 | – |
| Non-Cash Adjustments | (6.7) | (6.7) | – |
| Loans to Infrastructure Ontario | 0.4 | 0.4 | – |
| Other Net Loans/Investments | (0.8) | (0.8) | – |
| Debt Maturities | 17.5 | 17.5 | – |
| Debt Redemptions | 0.1 | 0.1 | – |
| Total Funding Requirement | 23.7 | 23.7 | – |
| Canada Pension Plan Borrowing | – | – | – |
| Decrease/(Increase) in Short-Term Borrowing | – | – | – |
| Increase/(Decrease) in Cash and Cash Equivalents | 6.0 | 6.0 | – |
| Preborrowing from 2016–17 | (3.2) | (3.2) | – |
| Total Long-Term Public Borrowing Requirement | 26.4 | 26.4 | – |
Note: Numbers may not add due to rounding.
Borrowing program status (as at June 30, 2017)
| Item | Completed | Remaining | Total |
|---|---|---|---|
| Province | 12.9 | 11.9 | 24.8 |
| Ontario Electricity Financial Corporation | 0.1 | 1.5 | 1.6 |
| Total | 13.0 | 13.4 | 26.4 |
Note: Numbers may not add due to rounding.
Long-Term Public Borrowing completed as at June 30, 2017 totalled $13.0 billion, as follows:
| Item | ($ Billions) |
|---|---|
| Domestic Issues | 6.7 |
| Global/US Dollar/Other Issues | 6.3 |
| Total | 13.0 |
As of June 30, 2017, approximately 51 per cent of this year's borrowing was completed in Canadian dollars.
Ministry of Finance
For general inquiries regarding the 2017–18 First Quarter Finances, please call:
Toll-free English & French inquiries:
Teletypewriter
© Queen's Printer for Ontario, 2017
Chart description
Chart: Ontario Real GDP Growth
This bar chart shows the 2017 Budget forecast and private-sector average forecast for Ontario real GDP growth in 2017 and 2018. The 2017 Budget projected Ontario real GDP to rise by 2.3 per cent in 2017 and 2.1 per cent in 2018. As of July 18, 2017, private-sector forecasters, on average, projected Ontario real GDP to increase by 2.7 per cent in 2017, up from the 2.4 per cent increase expected at the time of the 2017 Budget. The private-sector forecast average for Ontario real GDP growth in 2018 is unchanged at 2.2 per cent.