Chief Drinking Water Inspector Annual Report 2014-2015
The Chief Drinking Water Inspector Annual Report provides information on the performance of Ontario’s regulated drinking water systems and laboratories, drinking water test results, and the ministry’s enforcement activities and programs.
For news and information on Ontario’s drinking water, email drinking.water@ontario.ca with "subscribe" in the subject line.
Data provided in this report can be found at the Ontario.ca open data catalogue.
Message from the Chief Drinking Water Inspector
I am pleased to present the 2014-2015 annual drinking water report for Ontario.
In this report you will find information on the performance of Ontario’s regulated drinking water systems and laboratories, drinking water test results, and the ministry’s enforcement activities and programs. We are committed to providing high quality drinking water to the people of Ontario.
Ontario has a comprehensive safety net that protects drinking water from source to tap. It provides a multi-barrier approach to drinking water protection through strong legislation, stringent health-based standards, regular and reliable testing, highly trained operators, regular inspections and a source water protection program.
Drinking water test results for our regulated systems show that they continue to provide high quality drinking water to the people of Ontario. In 2014-15:
- 99.8 per cent of 533,457 drinking water test results from municipal residential drinking water systems met Ontario’s strict drinking water quality standards.
- 99.4 per cent of inspections of municipal residential drinking water systems resulted in inspection ratings higher than 80 per cent, and 67 per cent scored 100 per cent.
In his message, Dr. David C. Williams, the Acting Chief Medical Officer of Health for Ontario, provides an update on the performance of the province’s small drinking water systems and how the program is helping protect the health of Ontarians.
In line with our strong belief in transparency and in support of the Province’s commitment to Open Government, we are also providing information from this report on the Province’s Open Data catalogue at the Ontario.ca open data catalogue. Watch for regular updates to the catalogue in the near future.
To learn more about how your drinking water is protected from source-to-tap, visit the Ontario.ca drinking water information webpage.
Susan Lo,
Chief Drinking Water Inspector
Ministry of the Environment and Climate Change
Protecting Ontario’s drinking water
Source water protection
Ontario’s source protection program requires communities to design watershed-based source protection plans that identify potential risks and strategies to reduce or eliminate risks to sources of drinking water.
Nineteen source protection committees produced 22 plans built on scientific research. Representatives from municipalities, First Nations, farmers, industry and the general public are a part of these committees, which are helping to protect the sources of over 450 municipal drinking water systems across Ontario.
All 22 plans have been submitted to the Minister of the Environment and Climate Change for approval. All of these plans have been approved:
| Number | Source Protection Plan | Plan Effective Date |
|---|---|---|
| 1 | Lakehead | October 1, 2013 |
| 2 | Mattagami | October 1, 2014 |
| 3 | Niagara Peninsula | October 1, 2014 |
| 4 | Catfish Creek | January 1, 2015 |
| 5 | Kettle Creek | January 1, 2015 |
| 6 | Mississippi-Rideau | January 1, 2015 |
| 7 | Quinte Conservation | January 1, 2015 |
| 8 | Trent Conservation Coalition | January 1, 2015 |
| 9 | Ausable Bayfield Maitland Valley | April 1, 2015 |
| 10 | Cataraqui | April 1, 2015 |
| 11 | Raisin-South Nation | April 1, 2015 |
| 12 | Sudbury | April 1, 2015 |
| 13 | North Bay-Mattawa | July 1, 2015 |
| 14 | Sault Ste. Marie Region | July 1, 2015 |
| 15 | South Georgian Bay Lake Simcoe | July 1, 2015 |
| 16 | Essex Region | October 1, 2015 |
| 17 | Central Lake Ontario, Toronto Region and Credit Valley (CTC) | December 31, 2015 |
| 18 | Halton-Hamilton | December 31, 2015 |
| 19 | Thames-Sydenham and Region | December 31, 2015 |
| 20 | Saugeen, Grey Sauble, Northern Bruce Peninsula | July 1, 2016 |
| 21 | Long Point | July 1, 2016 |
| 22 | Grand River | July 1, 2016 |
Ontario’s drinking water report card
Drinking water quality results
In 2014-15, 99.8 per cent of 642,373 drinking water tests from regulated drinking water systems met Ontario’s Drinking Water Quality Standards. For further details see appendix 1.
- 99.79 per cent of the 533,457 drinking water test results from 660[1] municipal residential drinking water systems met the standards
- 99.46 per cent of 42,339 test results from 441 non-municipal year-round residential systems met the standards
- 99.60 per cent of 66,577 test results from 1,355 systems serving designated facilities met the standards
Figure 1: Trends in percentage of drinking water tests meeting Ontario Drinking Water Quality Standards, by type of facility1
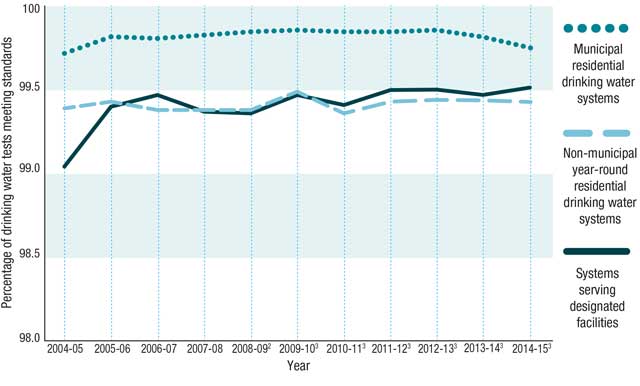
1 There were slight variations in the methods used to tabulate the percentages year-over-year due to regulatory changes and different counting methods.
2 Lead results were not included as they were reported separately. (2008 - 2009)
3 Lead distribution results were included and lead plumbing results were reported separately. (2009 - 2015)
Drinking water quality standards
Our drinking water must meet Ontario’s 158 health-based standards for microbiological, chemical and radiological parameters. These standards are listed in O. Reg. 169/03 of the Safe Drinking Water Act.
Drinking water quality standards and test results
Microbiological standards and test results
The presence of microbiological organisms in drinking water could result in serious health problems. For example, if total coliforms or Escherichia coli (E. coli) are positively confirmed in a drinking water sample, an adverse water quality incident is deemed to have occurred and the owner and/or operator of the drinking water system must take immediate corrective action.
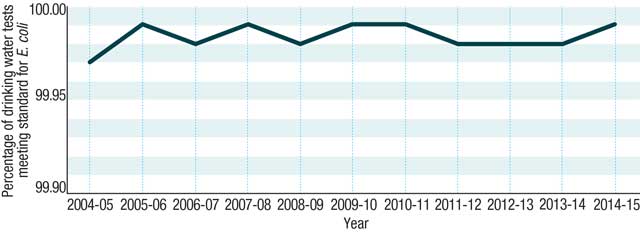
Over the past 11 years, the percentage of drinking water test results meeting microbiological standards has remained consistently high.
Figure 2: Percentage of test results from municipal residential drinking water systems meeting Ontario’s Drinking Water Quality Standard, for E. coli by year
Tables 2A-C: Breakdown of microbiological test results in 2014-15
| Parameter | Number of test results | Number of test results meeting standards | Number of adverse test results | Number of systems submitting test results1 | Number of systems with adverse test results | Percentage of test results meeting Ontario’s Drinking Water Quality Standards |
|---|---|---|---|---|---|---|
| E. coli | 236,911 | 236,876 | 35 | 654 | 19 | 99.99 |
| Total coliform | 236,949 | 236,077 | 872 | 654 | 170 | 99.63 |
| Parameter | Number of test results | Number of test results meeting standards | Number of adverse test results | Number of systems submitting test results1 | Number of systems with adverse test results | Percentage of test results meeting Ontario’s Drinking Water Quality Standards |
|---|---|---|---|---|---|---|
| E. coli | 15,343 | 15,332 | 11 | 441 | 9 | 99.93 |
| Total coliform | 15,352 | 15,208 | 144 | 441 | 68 | 99.06 |
| Parameter | Number of test results | Number of test results meeting standards | Number of adverse test results | Number of systems submitting test results1 | Number of systems with adverse test results | Percentage of test results meeting Ontario’s Drinking Water Quality Standards |
|---|---|---|---|---|---|---|
| E. coli | 20,065 | 20,041 | 24 | 1,325 | 19 | 99.88 |
| Total coliform | 20,078 | 19,944 | 134 | 1,325 | 98 | 99.33 |
1 Regulatory requirements for testing vary by category and source of water and are identified in O. Reg. 170/03.
Chemical and radiological standards and test results
Ontario’s drinking water quality standards establish the maximum allowable concentration of chemicals that can be present in drinking water. However, naturally occurring deposits such as fluoride or selenium may result in adverse chemical test results.
Parts of the province also contain naturally occurring deposits of radiological parameters such as uranium. In these areas, regular drinking water testing is required to monitor the level of these parameters in water to ensure that Ontario’s drinking water quality standards are being met.
Tables 3A-C: Number of chemical standard adverse test results by type of facility in 2014-15 1
| Parameter | Number of adverse test results | Number of systems with adverse test results |
|---|---|---|
| Arsenic2 | 1 | 1 |
| Bromate | 1 | 1 |
| Fluoride2 | 76 | 20 |
| Lead3 | 28 | 18 |
| Selenium2 | 7 | 1 |
| Total trihalomethanes4 | 76 | 28 |
| Parameter | Number of adverse test results | Number of systems with adverse test results |
|---|---|---|
| Arsenic2 | 1 | 1 |
| Barium2 | 1 | 1 |
| Benzo(a)pyrene | 1 | 1 |
| Fluoride2 | 2 | 1 |
| Lead3 | 1 | 1 |
| Nitrate (as nitrogen) | 29 | 5 |
| Nitrate + Nitrite (as nitrogen) | 29 | 5 |
| Total trihalomethanes4 | 10 | 4 |
| Parameter | Number of adverse test results | Number of systems with adverse test results |
|---|---|---|
| Benzo(a)pyrene | 2 | 2 |
| Fluoride2 | 34 | 14 |
| Lead | 5 | 4 |
| Nitrate (as nitrogen) | 30 | 7 |
| Nitrite (as nitrogen) | 1 | 1 |
| Nitrate + Nitrite (as nitrogen) | 30 | 7 |
| Selenium2 | 1 | 1 |
| Uranium2 | 2 | 1 |
1 Sampling frequency varies according to regulated requirements and facility type.
2 In some parts of the province, there are naturally-occurring deposits of arsenic, barium, fluoride, selenium and uranium that may result in adverse test results.
3 The lead parameter did not include lead sampled in plumbing for municipal residential and non-municipal year- round residential drinking water systems; however, lead sampled in the distribution system was included.
4 Total trihalomethanes are reported as the running annual average of quarterly samples.
Tables 4A-C: Percentage of test results meeting Ontario Drinking Water Quality Standards by type of system
| Parameter | 2012-13 % meeting standards | 2013-14 % meeting standards | 2014-15 % meeting standards |
|---|---|---|---|
| Microbiological1 | 99.90 | 99.85 | 99.81 |
| Chemical2 | 99.76 | 99.68 | 99.68 |
| Radiological | 100.00 | 100.00 | 100.00 |
| Total | 99.88 | 99.83 | 99.79 |
| Parameter | 2012-13 % meeting standards | 2013-14 % meeting standards | 2014-15 % meeting standards |
|---|---|---|---|
| Microbiological1 | 99.52 | 99.49 | 99.50 |
| Chemical2 | 99.34 | 99.38 | 99.36 |
| Total | 99.47 | 99.46 | 99.46 |
| Parameter | 2012-13 % meeting standards | 2013-14 % meeting standards | 2014-15 % meeting standards |
|---|---|---|---|
| Microbiological1 | 99.49 | 99.42 | 99.61 |
| Chemical | 99.67 | 99.59 | 99.60 |
| Total | 99.57 | 99.49 | 99.60 |
1 Microbiological includes only E. coli and total coliform results.
2 Lead plumbing results were not included in chemical analysis; however, lead distribution results were included. See Table 8 for additional details about lead in plumbing.
3 Radiological parameters are tested in drinking water systems where directed by the ministry.
Tables 5A-C: Summary of drinking water test results for all facility types in 2014-15
| Parameter | Number of test results | Number of test results meeting standards | Number of adverse test results | Percentage of adverse test results | Number of systems submitting test results1 | Number of systems with adverse test results2 |
|---|---|---|---|---|---|---|
| Microbiological3 | 473,860 | 472,953 | 907 | 0.19 | 654 | 170 |
| Chemical4 | 59,594 | 59,405 | 189 | 0.32 | 659 | 67 |
| Radiological | 3 | 3 | 0 | 0.00 | 1 | 0 |
| Total | 533,457 | 532,361 | 1,096 | 0.21 | 660 | 215 |
| Parameter | Number of test results | Number of test results meeting standards | Number of adverse test results | Percentage of adverse test results | Number of systems submitting test results1 | Number of systems with adverse test results2 |
|---|---|---|---|---|---|---|
| Microbiological3 | 30,695 | 30,540 | 155 | 0.50 | 441 | 68 |
| Chemical4 | 11,644 | 11,570 | 74 | 0.64 | 410 | 14 |
| Total | 42,339 | 42,110 | 229 | 0.54 | 441 | 79 |
| Parameter | Number of test results | Number of test results meeting standards | Number of adverse test results | Percentage of adverse test results | Number of systems submitting test results1 | Number of systems with adverse test results2 |
|---|---|---|---|---|---|---|
| Microbiological3 | 40,143 | 39,985 | 158 | 0.39 | 1,325 | 98 |
| Chemical | 26,434 | 26,329 | 105 | 0.40 | 1,289 | 29 |
| Total | 66,577 | 66,314 | 263 | 0.40 | 1,355 | 121 |
1 Regulatory requirements for testing vary by category and source of water and are identified in O. Reg. 170/03.
2 A single system could have adverse test results for multiple parameters. This type of system is counted only once when calculating the total number of systems with adverse results.
3 Microbiological includes only E. coli and total coliform results.
4 Lead plumbing results were not included in this analysis; but, lead distribution results were included. See Table 8 for additional details about lead in plumbing.
5 Radiological parameters are tested in drinking water systems where directed by the ministry.
Adverse water quality incidents and corrective actions
An adverse water quality incident is deemed to have occurred if a drinking water test result indicates a drinking water quality standard has not been met, or if an operational problem such as insufficient disinfection, high turbidity or equipment malfunction occurs at the drinking water system or facility. The report of an adverse water quality incident does not necessarily mean the drinking water is unsafe; it indicates that an incident has occurred and that corrective action must be taken.
Tables 6A-C: Summary of adverse water quality incidents (AWQIs) by drinking water facility type
| 2012-13 | 2013-14 | 2014-15 | |
| # of Systems submitting test results | 661 | 660 | 660 |
| # of Systems with AWQIs | 381 | 402 | 372 |
| # of AWQIs | 1,446 | 1,573 | 1,9542 |
| # of Results within AWQIs1 | 1,700 | 1,920 | 2,2122 |
| 2012-13 | 2013-14 | 2014-15 | |
| # of Systems submitting test results | 434 | 438 | 441 |
| # of Systems with AWQIs | 179 | 181 | 181 |
| # of AWQIs | 359 | 401 | 427 |
| # of Results within AWQIs1 | 415 | 511 | 556 |
| 2012-13 | 2013-14 | 2014-15 | |
| # of Systems submitting test results | 1,389 | 1,376 | 1,355 |
| # of Systems with AWQIs | 390 | 309 | 288 |
| # of AWQIs | 625 | 493 | 450 |
| # of Results within AWQIs1 | 740 | 623 | 532 |
1 An adverse water quality incident may occur as a result of a single issue or multiple issues such as presence of microbiological or chemical parameters and/or operational issues.
2 The increase was due to an administrative change in the reporting process of adverse water quality incidents, an increase in sampling frequency and a change in sampling locations.
Drinking water advisories
If there is concern that the water may not be safe for the public to drink, the local health unit may issue a drinking water advisory. A broken watermain, low water pressure, microbiological parameters in the water, low disinfectant levels or equipment failure at a drinking water system are some of the factors that could trigger an advisory.
In 2014-15, there were two municipal residential drinking water systems with long-term drinking water advisories:
Richmond Community Drinking Water System, located near St. Thomas, was issued a drinking water advisory in 2002 due to high nitrate levels in the source water. The Municipality of Bayham has installed a treatment system to help lower the nitrate levels below the standard and is monitoring drinking water monthly. As the treatment process to remove the nitrate led to high concentrations of sodium in drinking water, a second advisory was also issued specifically for those users who were on a sodium reduced diet.
The nitrate advisory was rescinded in October 2015 as there was no nitrate exceedance in the source water since January 2014. The sodium advisory remains in effect.
Lynden Drinking Water System, located near Hamilton, continues to have a long-term drinking water advisory due to lead in their drinking water. Although the test results are below the Ontario Drinking Water Quality Standard for lead in drinking water, the advisory will remain in place until lead concentrations in the drinking water supply are stable. According to the local medical officer of health, the current level of lead exposure does not represent an immediate health risk to residents. The advisory was issued to prevent potential long-term exposure to elevated concentrations of lead.
The affected residents continue to be offered on-tap filters that are certified to remove lead. Studies to identify the source of the lead and options to address the issue, including searching for a replacement water source, are ongoing.
Lead action plan
In 2007, as part of Ontario’s Lead Action Plan, regulations were made to help minimize lead in drinking water. These regulations require regulated drinking water systems, schools and day nurseries[2] to submit drinking water samples to laboratories to test for lead.
Lead testing results for municipal residential and non-municipal year-round residential systems
All municipal residential and non-municipal year-round residential drinking water systems are required to collect samples from homes (i.e. plumbing) and submit them to laboratories to test for lead.
Lead test results from these regulated systems indicate the vast majority of them continued to meet the provincial standard for lead in drinking water in 2014-15.
| Drinking water facility type1 | 2012-13 % meeting standards | 2013-14 % meeting standards | 2014-15 % meeting standards |
|---|---|---|---|
| Municipal residential systems | 95.23 | 92.69 | 95.10 |
| Non-municipal year-round residential systems | 98.95 | 99.85 | 99.08 |
1 Systems serving designated facilities are exempt from this requirement.
| Drinking water facility type1 | Parameter | Number of results | Number of lead exceedances | Number of systems submitting results2 | Number of systems with lead exceedances |
|---|---|---|---|---|---|
| Municipal residential systems | Lead in plumbing3 | 6,200 | 304 | 107 | 21 |
| Non-municipal year-round residential systems | Lead in plumbing3 | 1,416 | 13 | 137 | 10 |
1 Systems serving designated facilities are exempt from this requirement.
2 Regulatory requirements for testing vary by category and population and are identified in O. Reg. 170/03.
3 Samples are taken after system is flushed.
Lead control strategies
Where lead levels exceed the provincial standard for municipal residential drinking water systems, owners/operating authorities are required to develop a control strategy to reduce lead levels. These strategies may be comprised of one or a combination of:
- A corrosion control plan which may include the addition of a corrosion inhibitor to the treated water or the adjustment of the pH of the treated water.
- Replacement of lead service lines.
- Upgrades to a treatment plant.
- Public education and outreach to encourage homeowners to replace fixtures and plumbing that contain lead.
Owners and/or operating authorities of municipal residential drinking water systems that serve more than 100 private residences must develop corrosion control plans if:
- More than 10 per cent of the samples from homes (i.e. plumbing) confirm lead concentrations greater than the standard of 10 micrograms per litre in two out of three sampling rounds; and
- In those two rounds, at least two sample results exceed the standard.
No additional municipal residential drinking water systems had to prepare lead control strategies in 2014-15. The 20 municipalities that were previously required to prepare strategies continue to make significant progress to help address lead issues:
- Four municipalities have completed implementing their corrosion control plans.
- Two municipalities have completed implementing their corrosion control plans and are replacing lead service lines.
- Four municipalities are in the process of implementing their corrosion control plans.
- Two municipalities are in the process of implementing their corrosion control plans and replacing their lead service lines.
- Two municipalities replaced their lead service lines.
- Six municipalities are replacing lead service lines.
For further details, see appendix 2.
Lead testing results for schools and day nurseries
Schools and day nurseries are required to regularly flush their plumbing and must also test their drinking water regularly for lead. Flushing reduces potential lead levels in drinking water because it prevents water from standing in the plumbing, thereby reducing contact time with the pipes and plumbing. These facilities are required to sample their drinking water before and after they flush their plumbing.
Lead test results from schools and day nurseries continue to show that flushing significantly reduces lead in drinking water.
| Parameter | 2012-13 % meeting standards | 2013-14 % meeting standards | 2014-15 % meeting standards |
|---|---|---|---|
| Lead - Flushed | 96.74 | 97.49 | 97.71 |
| Lead - Standing | 90.79 | 91.90 | 92.66 |
| Parameter | Number of results | Number of lead exceedances | Number of schools and day nurseries submitting results1 | Number of schools and day nurseries with lead exceedances |
|---|---|---|---|---|
| Lead - Flushed | 8,095 | 185 | 6,859 | 112 |
| Lead - Standing | 8,028 | 589 | 6,870 | 438 |
1 Facilities that share the same plumbing system, known as co-located facilities, may submit a single set of samples. There are allowances for facilities to reduce sampling frequency to once every 36 months from the required annual testing, based on a sufficient number of samples and satisfactory test results.
[1] There were 663 registered municipal residential drinking water systems in 2014-15. Three systems that received their water from another municipal residential drinking water system had their samples represented within the samples collected and submitted by municipal residential drinking water systems that supplied water to them.
[2] The Child Care and Early Years Act replaces the term "day nursery" with "child care centre" after August 31, 2015.
Inspecting drinking water systems and issuing orders
Municipal residential drinking water systems
Municipal residential drinking water systems are inspected annually by the ministry to determine whether they are meeting Ontario’s regulatory requirements.
Inspection results
During 2014-15, ministry staff inspected all 662[3] municipal residential drinking water systems:
- Of these, 443 systems (or 67 per cent) received a perfect score (100 per cent rating).
- Six hundred and fifty-eight of the 662 (or 99.4 per cent) inspections resulted in inspection ratings greater than 80 per cent.
For further details see appendix 1.
Figure 3: Yearly comparison of municipal residential drinking water system inspection ratings1
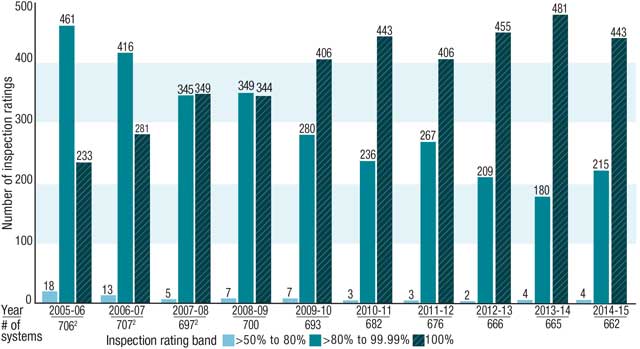
1 The decline in the total number of municipal residential drinking water systems is due to amalgamations of these systems.
2 Between 2005-06 and 2007-08 the ministry completed its planned annual inspection program of all municipal residential drinking water systems in Ontario generating its annual inspection rating for each system. During this period, for a number of reasons some systems were inspected twice, e.g., to capture both their water treatment works and distribution systems or to ensure equipment had been properly decommissioned.
Orders and order resolutions
Contravention and/or preventative measures orders can be issued as a result of inspections, in response to incidents identified outside of an inspection or to prevent incidents from occurring. Ministry inspectors may issue orders to resolve and/or prevent non-compliance at a drinking water system.
In 2014-15, one municipal residential drinking water system owner received one preventative measures order as a result of an inspection, whereby watermains were not integrated into the system’s drawings within 12 months of the projects being completed. These incidents of non- compliance were reoccurrences from the inspection in 2013-14. The order has now been complied with.
Individuals who are responsible for delivering safe drinking water to the people of Ontario are held legally accountable for their actions. Ministry inspectors may refer violations of Ontario’s Safe Drinking Water Act to the ministry’s Investigations and Enforcement Branch for further action.
| Systems with inspection-related orders | 2012-13 | 2013-14 | 2014-15 |
|---|---|---|---|
| Total number of inspections of municipal residential drinking water systems | 666 | 665 | 662 |
| Total number of municipal residential drinking water systems with inspection-related orders | 2 | 2 | 1 |
| Systems with non-inspection-related orders1 | 7 | 1 | 0 |
| Total | 9 | 3 | 1 |
1 Non-inspection-related orders are issued as a result of an issue at a drinking water system that occurred outside of the context of a scheduled inspection.
For further details on these orders, please see appendix 3.
Non-municipal year-round residential drinking water systems and systems serving designated facilities
The ministry uses a proactive, risk-based approach to determine which non-municipal year-round residential drinking water systems and systems serving designated facilities to inspect. Staff also take into consideration a system’s compliance history, how many adverse water quality incidents were issued and why, as well as recommendations from local public health units.
Inspection results and orders
In 2014-15, the ministry inspected 121 of the 454[4] registered non-municipal year-round residential drinking water systems and issued six contravention and two preventative measures orders to eight systems.
In addition, 321 of 1,476[5] registered systems serving designated facilities were inspected and two contravention orders were issued to two systems.
Orders were issued for the following reasons:
- Not operating a drinking water system with a certified operator
- Not meeting minimum treatment requirements
- Not sampling raw water for microbiological parameters according to legislation
- Not ensuring that a system is maintained in a fit state of repair
Local services boards
Seven local services boards in Ontario operate drinking water systems in northern communities without municipal government structures. In 2014-15, all were inspected. No orders were issued.
Schools and day nurseries
Whether connected to a municipal drinking water system or not, registered schools and day nurseries are inspected by the ministry to help reduce the risk of children being exposed to lead in drinking water. As with non-municipal year-round residential systems, the ministry uses a risk-based approach to determine which facilities should be inspected.
Over 98 per cent of the 6,859 Ontario schools and day nurseries that submitted flushed samples met the standard for lead. Less than two per cent that submitted flushed samples did not meet the lead standard. When this happens, these facilities take immediate corrective actions as directed by the local Medical Officer of Health. These actions may include one or more of the following:
- Increased flushing
- Resampling
- Bagging of water fountains
- Providing alternative sources of water until the issue is resolved
- Replacing of pipes or fixtures containing lead
- Posting signs
The ministry conducted 276 inspections and 110 compliance audits of 11,040 registered schools and day nurseries in 2014-15. No orders were issued.
To supplement the inspection program, the ministry requests newly registered schools and day nurseries to submit an online self-report. This allows the ministry to take a risk-based approach when selecting schools and day nurseries for inspection. In 2014-15, 445 newly registered schools and day nurseries participated in this annual self-reporting component. Of those facilities who reported a lead exceedance, 90.6 per cent indicated they followed the correct reporting and notification procedure.
[3] In 2014-15, there were 663 registered municipal residential drinking water systems. During the year, the Norwich Drinking Water System amalgamated with the Otterville-Springford Drinking Water System forming the Oxford South Drinking Water System.
[4] In 2014-15, some non-municipal year-round residential drinking water systems ceased to operate and/or data was not provided to the ministry.
[5] The number of designated facilities that were registered in 2014-15 was less than those that submitted samples for the following reasons: some systems ceased to operate and/or data was not provided to the ministry, while some received drinking water for their cistern from municipal residential drinking water systems which carried out the required sampling on their behalf. Sampling was not required for those systems that posted notices advising people not to drink the water.
Inspecting licensed and eligible laboratories
Ontario laboratories that test drinking water must be accredited by an accreditation body and licensed by the ministry. The ministry also uses laboratories that are located outside the province. For these laboratories to test Ontario’s drinking water, they too must be appropriately accredited and added to the ministry’s eligibility list.
To determine whether they are meeting regulatory requirements, all licensed and eligible laboratories are inspected by the ministry at least twice every year.
In 2014-15, all 52 licensed and eligible laboratories that conduct testing of Ontario’s drinking water were inspected twice. Sixty per cent of licensed and eligible laboratories had inspection ratings of 100 per cent. The ratings of all inspections were greater than 85 per cent.
One contravention order was issued to a non-licensed facility during this period. For further details on this order, please see appendix 4.
| Inspection type | 2012-13 | 2013-14 | 2014-15 |
|---|---|---|---|
| Announced | 53 | 52 | 52 |
| Unannounced | 53 | 52 | 52 |
| Other1 | 2 | 0 | 2 |
| Total | 108 | 104 | 106 |
| Number of laboratories inspected | 542 | 52 | 52 |
1 Other inspections included laboratory pre-licensing or relocation inspections.
2 During 2012-13, one laboratory that joined the licensing program in the second half of the fiscal year was not inspected; another laboratory voluntarily withdrew its licence during this time and was not inspected.
| 2012-13 | 2013-14 | 2014-15 | |
| Number of licensed laboratories that received inspection-related orders | 0 | 0 | 0 |
| Number of licensed laboratories that received non-inspection-related orders | 1 | 0 | 0 |
| Number of non-licensed facilities that received non-inspection-related orders | 1 | 0 | 1 |
| Total number of orders issued to licensed laboratories and non-licensed facilities (inspection and non-inspection) | 2 | 0 | 1 |
Compliance and Enforcement Regulation requirements
The Compliance and Enforcement Regulation (O. Reg. 242/05) of the Safe Drinking Water Act requires the Ministry of the Environment and Climate Change to carry out a number of specific activities such as taking mandatory actions and conducting inspections of municipal residential drinking water systems and laboratories that test Ontario’s drinking water.
Under the Compliance and Enforcement Regulation, the ministry is required to ensure all municipal residential drinking water systems are inspected annually and that one out of every three inspections is unannounced. In addition, the ministry must inspect all licensed and eligible laboratories at least twice a year ensuring that at least one inspection is unannounced.
In 2014-15, the ministry ensured all 662 municipal residential drinking water systems were inspected. As a result of administrative and scheduling issues, 10 of the drinking water systems inspected annually were not completed as unannounced but rather as announced. The ministry is taking corrective action to ensure all requirements under the Compliance and Enforcement Regulation are met including stricter adherence to standard operating procedures concerning scheduling of unannounced inspections. In addition, training will be provided to staff on the importance of the Compliance and Enforcement Regulation and its requirements.
The ministry met all its obligations for laboratories that test Ontario’s drinking water under this regulation.
Convictions
In 2014-15, there were 17 cases with convictions involving 20 regulated drinking water systems and facilities resulting in fines totalling $161,000.
| Facility type | Number of facilities | Number of cases with convictions1 | Fines |
|---|---|---|---|
| Municipal residential drinking water systems 2,3 | 1 | 1 | $19,000 |
| Non-municipal year-round residential drinking water systems 2,3 | 7 | 7 | $50,100 |
| Systems serving designated facilities 2,3 | 11 | 8 | $75,900 |
| Schools and day nurseries | 0 | 0 | $0 |
| Licensed laboratories | 0 | 0 | $0 |
| Non-licensed facility 2,3 | 14 | 1 | $16,000 |
| Total | 20 | 17 | $161,000 |
1 A case may involve one or more charges.
2 For further details, please see appendices 5, 6, 7, 8 and 9.
3 Includes convictions against legal entities and individuals.
4 Includes a conviction against a drinking water consultant.
Operator certification and training
Drinking water operators in Ontario must be trained according to the type and class of facility they operate. The more complex a system is (the higher the class of system), the more training an operator must complete. If an operator works in more than one type of drinking water system, he or she may hold multiple certificates.
In 2014-15, 1,299 operator-in-training certificates were issued to 754 operators. Of these, four were issued to four First Nations operators.
As of March 31, 2015, 6,388 drinking water operators held 8,916 certificates. One hundred and fifty-one of them were employed as First Nations system operators across the province. These operators held a total of 220 drinking water operator certificates.
Figure 4: Number of certified drinking water operators in Ontario
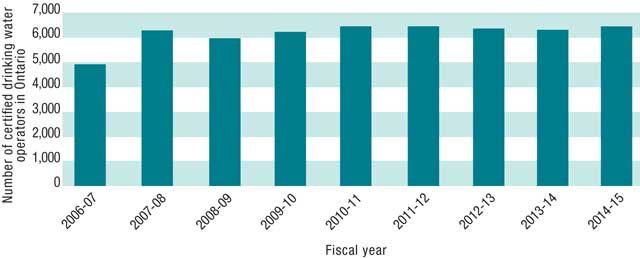
One of the ministry’s key training partners is the Walkerton Clean Water Centre. The centre offers high quality hands-on operator training both on-site and throughout the province. As of March 31, 2015, the Walkerton Clean Water Centre has trained more than 55,700 new and existing professionals since it opened in 2004.
Operator certification — disciplinary actions
Operators play a key role in safeguarding Ontario’s drinking water, and ensuring the public is protected. Unethical behaviour does not happen often, but when it does, the ministry takes it very seriously. Depending on the severity of the incident, the ministry will revoke or suspend operator certificates/licences, or bar an operator from holding future certificates/licences.
During 2014-15, the ministry revoked one drinking water certificate held by one operator. One exam applicant also received a written reprimand. Please see appendix 10 for further details.
Small Drinking Water Systems Program – Ministry of Health and Long-term Care
Message from the Chief Medical Officer of Health
I am pleased to report that Ontario’s Small Drinking Water Systems Program continues to demonstrate its value in protecting the health of Ontarians with the release of the 2014-2015 program results.
Since 2008, this innovative program has been overseen by the Ministry of Health and Long- Term Care and administered by local boards of health. Public health inspectors conduct detailed inspections and risk assessments of all small drinking water systems in Ontario, and provide owner/operators with a customized site-specific plan to keep their drinking water safe. This individualized approach rather than a one-size-fits-all program, has reduced unnecessary burden on small system owner/operators while upholding strict provincial drinking water standards.
The success of the Small Drinking Water Systems Program is being realized through the identification of and corrective actions taken to reduce adverse water quality incidents in systems that were not previously inspected. This milestone in drinking water protection was made possible through effective partnerships with provincial and local public health officials.
I want to take this opportunity to thank the local boards of health and all of our partners for their ongoing efforts and leadership in the protection of public health on this key part of Ontario’s drinking water safety net.
David C. Williams, MD, MHSc, FRCPC
Acting Chief Medical Officer of Health
Ministry of Health and Long-Term Care
Information in the Small Drinking Water Systems Program Results Section was provided by the Ministry of Health and Long-Term Care. For more information about the Ministry of Health and Long-Term Care’s Small Drinking Water Systems Program, please click the link.
Small drinking water systems program results
Risk assessments
Across Ontario, thousands of businesses and other community sites in semi-rural to remote communities supply drinking water to the public. Many of these facilities do not obtain their drinking water from a municipal system. Most of these systems are classified as small drinking water systems.
As of March 31, 2015, there were approximately 10,000 small drinking water systems in Ontario. A number of small drinking water systems have multiple water sources with individual system units for each source. Many of these systems provide drinking water in restaurants, places of worship and community centres, resorts, rental cabins, motels, lodges, bed and breakfasts, and campgrounds, among other public settings.
Owners and operators of small drinking water systems have primary responsibility for protecting the drinking water they provide to the public. They are also responsible for meeting Ontario’s regulatory requirements, including regular drinking water sampling and testing, and maintaining up-to-date records.
Through the Ministry of Health and Long-Term Care’s Small Drinking Water Systems Program, regulated under the Health Protection and Promotion Act and its regulations, local boards of health (public health units) support operators in determining how to keep their water safe by applying a risk-based approach. Public health inspectors conduct a risk assessment of each small drinking water system and provide a customized directive for the owner and/or operator which may include requirements for water sampling, water treatment options, operational checks and operator training.
Information is collected during the initial on-site inspection about the water source, system equipment and components, and records relating to the system’s water testing. Data is inputted by the public health inspector into a web-based Risk Categorization Assessment Tool (RCat) that evaluates all the factors that could influence the drinking water produced by a system. Through the use of the RCat, the public health inspector determines a level of risk (low, moderate or high) for the drinking water system.
Systems categorized as "high risk" are monitored through more frequent sampling and testing, and are required to be inspected every two years. Moderate and low risk systems are also monitored through routine sampling and inspected at a frequency of every four years. During the scheduled inspections every two or four year cycle, the risk category is reviewed and updated. While many risk categories stay the same, some systems are re-classified to a lower category based on improved performance of the system and demonstrating a lower risk of unsafe water. Risk assessment data in Table 14 below includes initial site specific risk assessments and those conducted as part of the scheduled inspection cycle.
As of March 31, 2015, 14,584[6] initial or scheduled risk assessments have been conducted for the approximately 10,000 small drinking water systems.
| Risk assessments | As of March 31, 2014 | As of March 31, 2015 |
|---|---|---|
| Completed (includes initial risk assessments and those completed over the two and four year cycles) | 12,690 | 14,584 |
| Finalized risk assessment: High | 1,968 (15.51%) | 2, 048 (14.04%) |
| Finalized risk assessment: Moderate | 1,938 (15.27%) | 2,097 (14.38%) |
| Finalized risk assessment: Low | 8,784 (69.22%) | 10,439 (71.58%) |
Adverse water quality incidents for small drinking water systems
| Parameter type | Total # of test results | Total # of test results meeting standards | Total # of adverse test results | % meeting standards |
|---|---|---|---|---|
| Microbiological | 95,535 | 93,312 | 2,223 | 97.67% |
| Chemical/Inorganic | 670 | 580 | 90 | 86.57% |
| Organic | 57 | 57 | 0 | 100.00% |
| Total | 96,262 | 93,949 | 2,313 | 97.60% |
In 2014-15, we continued to see gradual improvement in water sample quality with 97.60 per cent (up from 97.24 per cent in 2013-14) of test results submitted by laboratories on behalf of small drinking water systems meeting the provincial standards (see Table 15). The majority of adverse test results were microbiological (2,223), which is expected as over 99 per cent of water samples are tested for bacteria.
Operators are required to test for microbiological indicator organisms such as total coliform and E. coli at a frequency set out in their directive (or as per the regulation). Testing for other contaminants such as chemicals (e.g., nitrates) is only required where the risk assessment determines that other possible contaminants (e.g., agricultural runoff) could potentially pose a risk.
Regular sampling of drinking water systems is performed by operators who then submit the water samples to accredited laboratories for testing. Test results are recorded in the Laboratory Result Management System. In the event of an adverse test result, the laboratory notifies both the owner and/or operator of the small drinking water system and the local public health unit for immediate response.
An adverse test result does not necessarily mean that users are at risk of becoming ill. When an adverse test result occurs, immediate precautions are taken and drinking water advisories are issued where appropriate. During the current reporting period, 1,151 adverse water quality incidents (AWQIs) were identified by water test results and an additional 145 AWQIs were identified through other means such as observation of treatment malfunction. If an AWQI is suspected through observation or detected by a test result, a response process is initiated which includes notification of users and the local medical officer of health. Further follow-up is immediately taken (e.g., re-testing of water) to determine if the water poses a risk to health if consumed or used and additional action is taken as required.
The Laboratory Result Management System is used for review of small drinking water systems' sampling compliance, test results and AWQIs. In 2014-15, we saw decreases in adverse test results (17.42 per cent) and AWQIs (14.57 per cent) from the previous year, while the number of samples submitted remained relatively stable (five per cent decrease). The reduction in adverse results and incidents may be attributed to the implementation of the Small Drinking Water Systems Program which is now well established across the province.
The adverse water quality incident data continues to demonstrate the importance of the Small Drinking Water Systems Program by identifying and tracking these incidents so that immediate action is taken to help protect drinking water users.
Response to adverse water quality incidents for small drinking water systems
When an AWQI is detected, the owner and/or operator of the small drinking water system is required to notify the local medical officer of health and to follow up with any action that may be required. The public health unit will perform a risk analysis and take appropriate action to inform and protect the public.
Response to an AWQI may include issuing a drinking water advisory that will notify potential users whether the water is safe to use and drink or if it requires boiling to render it safe for use. The public health unit may also provide the owners and/or operators of a drinking water system with necessary corrective action(s) to be taken on the affected drinking water system to address the risk.
The comprehensive and proactive approach of the Small Drinking Water Systems Program is helping to minimize the occurrence of AWQIs and safeguard water that comes from small systems. The program supports operators who are working closely with the public health units to learn how to protect their water from contaminants at the source; how and when to test their water; treatment options and maintenance of equipment; notification procedures; and actions to address a problem.
The Small Drinking Water Systems Program demonstrates the Ontario government’s commitment to reduced regulatory burden, increased accountability and public transparency. Together we are upholding Justice O'Connor’s recommendations to ensure that drinking water quality standards established for the province are not compromised, and meeting these standards in a way that supports the needs of small system operators.
[6] The reported number of finalized risk assessments will change as new small drinking water systems are built/ come into use, when there is a change in use or operation is discontinued, and when systems become due for a routine re-inspection and risk assessment. The proportion of systems categorized as high, moderate or low risk may also fluctuate (e.g., if recommended improvements are taken to reduce the system’s risk, a reassessment may reduce the level of risk). Similarly, a system may require reassessment to determine if the risk level has changed (e.g., if the water source and/or system’s integrity has been affected by adverse weather events and/or system modifications are made).
Glossary
- Contravention order:
- an order a provincial officer may issue under section 105 of the Safe Drinking Water Act if the provincial officer reasonably believes a person is contravening or has contravened a provision of the act or its regulations, an order issued under the act, or a condition in a certificate, permit, licence or approval issued under the act. It may require the ordered party to comply with any directions set out in the order within the time specified.
- Corrosion inhibitor:
- a chemical that prevents deterioration and leaching of lead from the interior surface of a service line or plumbing.
- Drinking water advisory:
- notice issued by a local medical officer of health when a drinking water problem cannot be corrected simply by boiling the water or through disinfection. Under a drinking water advisory, consumers are advised to use another source of drinking water until further notice.
- Drinking water systems serving designated facilities:
- drinking water systems that only serve designated facilities such as schools (elementary and public), universities, colleges, children and youth care facilities (including day nurseries), health care facilities, children’s camps and delivery agent care facilities (including certain hostels).
- Escherichia coli (E. coli):
- a species of bacteria naturally present in the intestines of humans and animals. If animal or human waste containing E. coli contaminates drinking water it may cause gastrointestinal disease in humans. Most types of E. coli are harmless, but some active strains produce harmful toxins and can cause severe illness and even death.
- Local services boards:
- provide services (including, in some cases, water services) to communities in areas of Northern Ontario without municipal structure. They are established pursuant to the Northern Services Boards Act. Drinking water systems run by local services boards are generally categorized as non-municipal year-round residential drinking water systems under O. Reg. 170/03.
- Municipal residential drinking water systems:
- drinking water systems (or part of a drinking water system) that are owned by and/or supply water to a municipality, that serve six or more private residences, and that meet other relevant criteria under the Safe Drinking Water Act and its regulations.
- Non-municipal year-round residential drinking water systems:
- drinking water systems that are not municipal systems (and are not seasonal residential systems) that serve six or more private residences or a trailer park or campground with more than five service connections.
- Preventative measures order:
- an order that a provincial officer may issue under section 106 of the Safe Drinking Water Act to a person who owns, manages or has control of a municipal drinking water system or a regulated non-municipal drinking water system, if the provincial officer considers it necessary for the purposes of the act. Such an order may be issued in the absence of a contravention, and is used to prevent possible future adverse effects.
- Radiological parameter:
- refers to radionuclides which are an unstable form of a chemical element that decays and results in the emission of nuclear radiation.
- Risk-based approach:
- a method for which the goal is to prevent, reduce and/or eliminate adverse effects.
- Total coliform:
- a group of waterborne bacteria consisting of three main groups with common characteristics that are used to indicate water quality. The presence of total coliform bacteria in water leaving a treatment plant or in any treated water immediately after treatment could indicate inadequate treatment and possible water contamination.
- Trihalomethanes:
- a group of compounds that can form when the chlorine used to disinfect drinking water reacts with naturally occurring organic matter (e.g., decaying leaves and vegetation).
- Water quality:
- a term used to describe the biological, chemical, physical and radiological characteristics of water, usually with respect to its suitability for a particular purpose, such as drinking.
Appendices
Appendix 1: Municipal residential drinking water systems' 2014-15 inspection ratings and drinking water quality results (percentage of tests meeting standards)
| Municipal location (municipality where the drinking water system is located) | Drinking water system name | 2014-15 Inspection rating | 2014-15 Drinking water quality (% tests meeting standards) |
|---|---|---|---|
| Adjala-Tosorontio, Township of | Colgan Drinking Water System | 100.00% | 100.00% |
| Adjala-Tosorontio, Township of | Everett Drinking Water System | 100.00% | 100.00% |
| Adjala-Tosorontio, Township of | Hockley Drinking Water System | 100.00% | 100.00% |
| Adjala-Tosorontio, Township of | Lisle Drinking Water System | 100.00% | 100.00% |
| Adjala-Tosorontio, Township of | Loretto Heights Drinking Water System | 97.05% | 100.00% |
| Adjala-Tosorontio, Township of | Rosemont Drinking Water System | 100.00% | 100.00% |
| Adjala-Tosorontio, Township of | Weca Drinking Water System | 100.00% | 100.00% |
| Ajax, Town of | Oshawa-Whitby-Ajax Drinking Water System - Ajax | 98.98% | 99.79% |
| Alfred and Plantagenet, Township of | Lefaivre and Plantagent Drinking Water System | 100.00% | 100.00% |
| Alfred and Plantagenet, Township of | Wendover Drinking Water System | 100.00% | 99.25% |
| Alnwick/Haldimand, Township of | Grafton Drinking Water System | 100.00% | 100.00% |
| Amaranth, Township of | Waldemar Drinking Water System | 100.00% | 100.00% |
| Amherstburg, Town of | Amherstburg Drinking Water System | 100.00% | 100.00% |
| Armstrong, Township of | Earlton Drinking Water System | 100.00% | 100.00% |
| Arnprior, Town of | Arnprior Drinking Water System | 97.29% | 99.88% |
| Arran-Elderslie, Municipality of | Arran-Elderslie Drinking Water System | 97.52% | 100.00% |
| Arran-Elderslie, Municipality of | Tara Drinking Water System | 100.00% | 100.00% |
| Ashfield-Colborne- Wawanosh, Township of | Benmiller Drinking Water System | 90.21% | 97.50% |
| Ashfield-Colborne- Wawanosh, Township of | Century Heights Subdivision Drinking Water System | 86.74% | 98.46% |
| Ashfield-Colborne- Wawanosh, Township of | Courtney Subdivision Distribution System | 94.63% | 100.00% |
| Ashfield-Colborne- Wawanosh, Township of | Dungannon Drinking Water System | 95.82% | 99.44% |
| Ashfield-Colborne- Wawanosh, Township of | Huron Sands Drinking Water System | 94.00% | 98.00% |
| Ashfield-Colborne- Wawanosh, Township of | South Lucknow Distribution System | 100.00% | 100.00% |
| Asphodel-Norwood, Township of | Norwood Drinking Water System | 100.00% | 100.00% |
| Asphodel-Norwood, Township of | Trentview Estates Distribution System | 100.00% | 100.00% |
| Assiginack, Township of | Manitowaning Drinking Water System | 100.00% | 100.00% |
| Assiginack, Township of | Sunsite Estates Subdivision Drinking Water System | 100.00% | 100.00% |
| Atikokan, Township of | Atikokan Drinking Water System | 86.28% | 99.75% |
| Aurora, Town of | Town of Aurora Distribution System | 100.00% | 99.73% |
| Aurora, Town of | York Drinking Water System - Aurora | 100.00% | 99.91% |
| Aylmer, Town of | Aylmer Area Secondary Water Supply System | 100.00% | 100.00% |
| Aylmer, Town of | Aylmer Distribution System | 92.98% | 99.82% |
| Bancroft, Town of | Bancroft Drinking Water System | 97.67% | 100.00% |
| Barrie, City of | Barrie Drinking Water System | 93.69% | 99.94% |
| Bayham, Municipality of | Municipality of Bayham Distribution System | 100.00% | 99.74% |
| Bayham, Municipality of | Richmond Community Drinking Water System | 100.00% | 100.00% |
| Belleville, City of | Belleville Drinking Water System | 100.00% | 99.80% |
| Belleville, City of | Point Anne Hamlet Drinking Water System | 100.00% | 100.00% |
| Billings, Township of | Kagawong Drinking Water System | 90.47% | 100.00% |
| Black River-Matheson, Township of | Holtyre Drinking Water System | 100.00% | 100.00% |
| Black River-Matheson, Township of | Matheson Drinking Water System | 100.00% | 100.00% |
| Black River-Matheson, Township of | Ramore Drinking Water System | 100.00% | 100.00% |
| Black River-Matheson, Township of | Val Gagne Drinking Water System | 100.00% | 100.00% |
| Blandford-Blenheim, County of | Bright Drinking Water System | 97.17% | 100.00% |
| Blandford-Blenheim, County of | Drumbo Drinking Water System | 99.42% | 100.00% |
| Blandford-Blenheim, County of | Plattsville Drinking Water System | 100.00% | 100.00% |
| Blind River, Town of | Blind River Drinking Water System | 100.00% | 100.00% |
| Bluewater, Municipality of | Bluewater Lakeshore Distribution System | 100.00% | 99.79% |
| Bluewater, Municipality of | Carriage Lane Drinking Water System | 95.28% | 100.00% |
| Bluewater, Municipality of | Harbour Lights Drinking Water System | 95.57% | 100.00% |
| Bluewater, Municipality of | Hensall Distribution System | 100.00% | 100.00% |
| Bluewater, Municipality of | Zurich Drinking Water System | 100.00% | 100.00% |
| Bonnechere Valley, Township of | Eganville Drinking Water System | 100.00% | 100.00% |
| Bracebridge, Town of | Bracebridge (Kirby’s Beach) Drinking Water System | 100.00% | 100.00% |
| Bradford West Gwillimbury, Town of | Bradford/Bondhead Drinking Water System | 100.00% | 99.93% |
| Brant, County of | Airport Drinking Water System | 100.00% | 99.82% |
| Brant, County of | Cainsville-King George Road Distribution System - Cainsville Distribution System | 100.00% | 100.00% |
| Brant, County of | Cainsville-King George Road Distribution System - King George Road Distribution System | 100.00% | 100.00% |
| Brant, County of | Mt. Pleasant Drinking Water System | 97.98% | 100.00% |
| Brant, County of | Paris Drinking Water System | 100.00% | 99.92% |
| Brant, County of | St. George Drinking Water System | 100.00% | 100.00% |
| Brantford, City of | City of Brantford Drinking Water System | 100.00% | 99.86% |
| Brighton, Municipality of | Brighton Springs Drinking Water System | 100.00% | 100.00% |
| Brock, Township of | Cannington Drinking Water System | 98.44% | 100.00% |
| Brock, Township of | Sunderland Drinking Water System | 98.58% | 100.00% |
| Brock, Township of | Beaverton Drinking Water System | 98.97% | 100.00% |
| Brockton, Municipality of | Chepstow Drinking Water System | 100.00% | 98.47% |
| Brockton, Municipality of | Lake Rosalind Drinking Water System | 97.17% | 100.00% |
| Brockton, Municipality of | Walkerton Drinking Water System | 99.47% | 98.52% |
| Brockton, Municipality of | Town of Hanover Drinking Water System | 100.00% | 100.00% |
| Brockville, City of | Brockville Drinking Water System | 99.53% | 99.68% |
| Brooke-Alvinston, Municipality of | Alvinston Distribution System | 95.54% | 100.00% |
| Bruce Mines, Town of | Bruce Mines Drinking Water System | 99.47% | 100.00% |
| Burk’s Falls, Village of | Burk’s Falls Drinking Water System | 95.01% | 99.47% |
| Burlington, City of | South Halton Drinking Water System- Snake Road Distribution System | 100.00% | 100.00% |
| Burlington, City of | South Halton Drinking Water System- Bridgeview Community Distribution System | 100.00% | 100.00% |
| Burlington, City of | South Halton Drinking Water System- Burlington | 100.00% | 99.68% |
| Burlington, City of | South Halton Drinking Water System- North Aldershot Distribution System | 100.00% | 99.55% |
| Caledon, Town of | Caledon Village and Alton Drinking Water System | 100.00% | 100.00% |
| Caledon, Town of | Cheltenham Drinking Water System | 100.00% | 100.00% |
| Caledon, Town of | Inglewood Drinking Water System | 97.29% | 100.00% |
| Caledon, Town of | Palgrave-Caledon East Drinking Water System | 100.00% | 99.94% |
| Callander, Municipality of | Callander Drinking Water System | 91.65% | 100.00% |
| Cambridge, City of | Cambridge Distribution System | 100.00% | 99.89% |
| Cambridge, City of | Region of Waterloo Drinking Water System - Cambridge | 97.47% | 100.00% |
| Carleton Place, Town of | Carleton Place Drinking Water System | 94.38% | 100.00% |
| Casselman, Village of | Casselman Drinking Water System | 100.00% | 100.00% |
| Cavan-Monaghan, Township of | Millbrook Drinking Water System | 100.00% | 100.00% |
| Central Elgin, Municipality of | Belmont Drinking Water System | 100.00% | 100.00% |
| Central Elgin, Municipality of | Central Elgin Distribution System | 100.00% | 99.88% |
| Central Elgin, Municipality of | Elgin Area Primary Water Supply System | 100.00% | 100.00% |
| Central Huron, Municipality of | Auburn Drinking Water System | 100.00% | 100.00% |
| Central Huron, Municipality of | Clinton Drinking Water System | 100.00% | 100.00% |
| Central Huron, Municipality of | Kelly Drinking Water System | 100.00% | 100.00% |
| Central Huron, Municipality of | McClinchey Drinking Water System | 100.00% | 100.00% |
| Central Huron, Municipality of | S.A.M. Drinking Water System | 100.00% | 100.00% |
| Central Huron, Municipality of | Van De Wetering Drinking Water System | 100.00% | 100.00% |
| CentralManitoulin, Municipality of | Mindemoya Drinking Water System | 95.83% | 99.80% |
| Centre Wellington, Township of | Centre Wellington Drinking Water System | 98.46% | 99.97% |
| Champlain, Township of | Laurentian Park Distribution System | 100.00% | 98.33% |
| Champlain, Township of | L'Orignal Distribution System | 100.00% | 99.06% |
| Champlain, Township of | Vankleek Hill Distribution System | 100.00% | 100.00% |
| Chapleau, Township of | Chapleau Drinking Water System | 96.32% | 99.63% |
| Chapple, Township of | Barwick Drinking Water System | 100.00% | 95.95% |
| Charlton and Dack, Municipality of | Bradley Subdivision Distribution System | 100.00% | 93.44% |
| Charlton and Dack, Municipality of | Charlton Drinking Water System | 100.00% | 100.00% |
| Chatham-Kent, Municipality of | Bothwell Distribution System | 88.62% | 99.84% |
| Chatham-Kent, Municipality of | Chatham-Kent Drinking Water System - Chatham | 100.00% | 99.80% |
| Chatham-Kent, Municipality of | Chatham-Kent Drinking Water System - Wallaceburg | 100.00% | 99.87% |
| Chatham-Kent, Municipality of | Ridgetown Drinking Water System | 100.00% | 99.50% |
| Chatham-Kent, Municipality of | Chatham-Kent Drinking Water System - South Chatham-Kent | 100.00% | 100.00% |
| Chatham-Kent, Municipality of | Chatham-Kent Drinking Water System - Wheatley | 98.96% | 99.85% |
| Chatham-Kent, Municipality of | Highgate Drinking Water System | 99.22% | 98.44% |
| Chatsworth, Township of | Chatsworth Drinking Water System | 100.00% | 100.00% |
| Chatsworth, Township of | Walter’s Falls Drinking Water System | 100.00% | 100.00% |
| Clarence-Rockland, City of | Rockland Drinking Water System | 100.00% | 100.00% |
| Clarington, Municipality of | Bowmanville Drinking Water System | 98.94% | 100.00% |
| Clarington, Municipality of | Newcastle Drinking Water System | 98.33% | 99.93% |
| Clarington, Municipality of | Orono Drinking Water System | 98.22% | 100.00% |
| Clearview, Township of | Buckingham Woods Drinking Water System | 100.00% | 98.60% |
| Clearview, Township of | Colling-Woodlands Drinking Water System | 100.00% | 100.00% |
| Clearview, Township of | Creemore Drinking Water System | 96.38% | 99.61% |
| Clearview, Township of | New Lowell Drinking Water System | 95.94% | 100.00% |
| Clearview, Township of | Nottawa Drinking Water System | 96.10% | 99.75% |
| Clearview, Township of | Stayner Drinking Water System | 93.52% | 100.00% |
| Cobalt, Town of | Cobalt Drinking Water System | 100.00% | 100.00% |
| Cobourg, Town of | Cobourg Drinking Water System | 100.00% | 100.00% |
| Cochrane, Town of | Cochrane Drinking Water System | 100.00% | 100.00% |
| Coleman, Township of | Coleman Distribution System | 100.00% | Not applicable1 |
| Collingwood, Town of | Collingwood Drinking Water System | 96.84% | 100.00% |
| Cornwall, City of | Cornwall Drinking Water System | 100.00% | 100.00% |
| Cramahe, Township of | Colborne Drinking Water System | 100.00% | 100.00% |
| Dawn-Euphemia, Township of | Dawn-Euphemia Distribution System | 100.00% | 100.00% |
| Deep River, Town of | Deep River Drinking Water System | 100.00% | 99.52% |
| Deseronto, Town of | Deseronto Drinking Water System | 100.00% | 99.80% |
| Dryden, City of | Dryden Drinking Water System | 88.96% | 99.91% |
| Dubreuilville, Township of | Dubreuilville Drinking Water System | 97.26% | 100.00% |
| Dutton-Dunwich, Municipality of | Dutton-Dunwich Distribution System | 100.00% | 99.78% |
| Ear Falls, Township of | Ear Falls Drinking Water System | 95.88% | 99.14% |
| East Garafraxa, Township of | Marsville Subdivision Drinking Water System | 100.00% | 100.00% |
| East Gwillimbury, Town of | Holland Landing/Queensville/Sharon Distribution System | 100.00% | 100.00% |
| East Gwillimbury, Town of | Mount Albert Distribution System | 100.00% | 100.00% |
| East Gwillimbury, Town of | Mount Albert Drinking Water System | 100.00% | 100.00% |
| East Gwillimbury, Town of | Yonge-Green Lane Distribution System | 100.00% | 100.00% |
| East Gwillimbury, Town of | York Drinking Water System - Holland Landing | 95.24% | 100.00% |
| East Gwillimbury, Town of | York Drinking Water System - Queensville | 95.88% | 100.00% |
| East Luther Grand Valley, Township of | Grand Valley Drinking Water System | 100.00% | 100.00% |
| East Zorra-Tavistock, Township of | Hickson Drinking Water System | 100.00% | 100.00% |
| East Zorra-Tavistock, Township of | Innerkip Drinking Water System | 100.00% | 100.00% |
| East Zorra-Tavistock, Township of | Tavistock Drinking Water System | 100.00% | 100.00% |
| Edwardsburgh/Cardinal, Township of | Bennett Street Drinking Water System | 100.00% | 100.00% |
| Edwardsburgh/Cardinal, Township of | Cardinal Drinking Water System | 100.00% | 100.00% |
| Edwardsburgh/Cardinal, Township of | Edwardsburgh Industrial Park Distribution System | 100.00% | 100.00% |
| Elizabethtown-Kitley, Township of | Elizabethtown - Kitley Distribution System | 100.00% | Not applicable1 |
| Elliot Lake, City of | Elliot Lake Drinking Water System | 97.37% | 100.00% |
| Emo, Township of | Emo Drinking Water System | 97.67% | 99.43% |
| Englehart, Town of | Englehart Drinking Water System | 100.00% | 99.44% |
| Enniskillen, Township of | Enniskillen Township Distribution System | 100.00% | 99.83% |
| Erin, Town of | Erin Drinking Water System | 97.17% | 100.00% |
| Erin, Town of | Hillsburgh Drinking Water System | 100.00% | 100.00% |
| Espanola, Town of | Espanola Drinking Water System | 91.54% | 99.84% |
| Essa, Township of | Angus Drinking Water System | 95.33% | 100.00% |
| Essa, Township of | Baxter Distribution System | 100.00% | 100.00% |
| Essa, Township of | Glen Avenue (Thornton) Drinking Water System | 100.00% | 100.00% |
| Essex, Town of | Essex Drinking Water System - Essex Distribution System | 100.00% | 99.85% |
| Essex, Town of | Essex Drinking Water System - Harrow-Colchester South | 98.44% | 100.00% |
| Fauquier-Strickland, Township of | Fauquier Drinking Water System | 88.71% | 99.50% |
| Fort Erie, Town of | Fort Erie Distribution System | 100.00% | 99.58% |
| Fort Erie, Town of | Rosehill Drinking Water System | 100.00% | 100.00% |
| Fort Frances, Town of | Fort Frances Drinking Water System | 80.71% | 99.82% |
| Front of Yonge, Township of | Miller Manor Apartments Drinking Water System | 100.00% | 100.00% |
| Galway-Cavendish and Harvey, Township of | Alpine/Pirates Glen Drinking Water System | 95.82% | 100.00% |
| Galway-Cavendish and Harvey, Township of | Buckhorn Lake Estates Drinking Water System | 100.00% | 100.00% |
| Gananoque, Town of | James W. King Drinking Water System | 99.47% | 99.70% |
| Georgian Bay, Township of | Mactier (Beech) Drinking Water System | 100.00% | 100.00% |
| Georgian Bay, Township of | Port Severn (Lone Pine) Drinking Water System | 100.00% | 100.00% |
| Georgian Bluffs, Township of | East Linton Drinking Water System | 100.00% | 100.00% |
| Georgian Bluffs, Township of | Oxenden Distribution System | 100.00% | 100.00% |
| Georgian Bluffs, Township of | Pottawatomi Drinking Water System | 92.01% | 98.54% |
| Georgian Bluffs, Township of | Shallow Lake Drinking Water System | 99.52% | 99.77% |
| Georgina, Town of | Georgina Drinking Water System - Georgina | 100.00% | 100.00% |
| Georgina, Town of | Georgina Drinking Water System - Keswick | 100.00% | 100.00% |
| Georgina, Town of | Keswick-Sutton Distribution System | 100.00% | 100.00% |
| Goderich, Town of | Goderich Drinking Water System | 78.75% | 100.00% |
| Gore Bay, Town of | Gore Bay Drinking Water System | 96.89% | 99.80% |
| Gravenhurst, Town of | Gravenhurst (Muskoka Beach) Drinking Water System | 95.83% | 100.00% |
| Greater Napanee, Town of | A.L. Dafoe Drinking Water System | 100.00% | 99.88% |
| Greater Napanee, Town of | Sandhurst Shores Drinking Water System | 100.00% | 100.00% |
| Greater Sudbury, City of | Dowling Drinking Water System | 100.00% | 100.00% |
| Greater Sudbury, City of | Falconbridge Drinking Water System | 100.00% | 100.00% |
| Greater Sudbury, City of | Onaping/Levack Drinking Water System | 100.00% | 100.00% |
| Greater Sudbury, City of | Sudbury Drinking Water System - David St. | 100.00% | 99.88% |
| Greater Sudbury, City of | Sudbury Drinking Water System - Garson | 100.00% | 100.00% |
| Greater Sudbury, City of | Sudbury Drinking Water System - Wahnapitei | 100.00% | 99.94% |
| Greater Sudbury, City of | Valley Drinking Water System | 97.47% | 99.97% |
| Greater Sudbury, City of | Vermillion Distribution System | 100.00% | 100.00% |
| Greater Sudbury, City of | Vermilion Drinking Water System | 100.00% | 100.00% |
| Greenstone, Municipality of | Beardmore Drinking Water System | 100.00% | 100.00% |
| Greenstone, Municipality of | Caramat Drinking Water System | 98.36% | 100.00% |
| Greenstone, Municipality of | Geraldton Drinking Water System | 84.01% | 100.00% |
| Greenstone, Municipality of | Longlac Drinking Water System | 100.00% | 100.00% |
| Greenstone, Municipality of | Nakina Drinking Water System | 100.00% | 99.76% |
| Grey Highlands, Municipality of | Kimberley-Amik-Talisman Drinking Water System | 100.00% | 100.00% |
| Grey Highlands, Municipality of | Markdale Drinking Water System | 100.00% | 100.00% |
| Grimsby, Town of | Grimsby Distribution System | 100.00% | 99.93% |
| Grimsby, Town of | Grimsby Drinking Water System | 100.00% | 100.00% |
| Guelph, City of | Guelph Drinking Water System | 100.00% | 100.00% |
| Guelph/Eramosa, Township of | Gazer Mooney Subdivision Distribution System | 100.00% | 100.00% |
| Guelph/Eramosa, Township of | Hamilton Drive Drinking Water System | 100.00% | 99.82% |
| Guelph/Eramosa, Township of | Rockwood Drinking Water System | 100.00% | 100.00% |
| Haldimand County | Caledonia and Cayuga Distribution System | 100.00% | 100.00% |
| Haldimand County | Dunnville Drinking Water System | 100.00% | 100.00% |
| Haldimand County | Nanticoke Drinking Water System | 97.68% | 99.92% |
| Halton Hills, Town of | Acton Drinking Water System | 100.00% | 100.00% |
| Halton Hills, Town of | Georgetown Drinking Water System | 100.00% | 99.92% |
| Hamilton, City of | Carlisle Drinking Water System | 100.00% | 99.94% |
| Hamilton, City of | Freelton Drinking Water System | 100.00% | 99.33% |
| Hamilton, City of | Greensville Drinking Water System | 100.00% | 100.00% |
| Hamilton, City of | Hamilton Drinking Water System - Fifty Road Distribution System | 100.00% | 99.15% |
| Hamilton, City of | Hamilton Drinking Water System - Woodward | 100.00% | 99.84% |
| Hamilton, City of | Lynden Drinking Water System | 97.31% | 99.72% |
| Hamilton, Township of | Camborne Drinking Water System | 100.00% | 100.00% |
| Hamilton, Township of | Creighton Heights Drinking Water System | 100.00% | 99.77% |
| Hamilton, Township of | Hamilton Township Distribution System | 100.00% | Not applicable1 |
| Havelock-Belmont- Methuen, Township of | Havelock Drinking Water System | 100.00% | 100.00% |
| Hawkesbury, Town of | Hawkesbury Drinking Water System | 100.00% | 99.81% |
| Hearst, Town of | Hearst Drinking Water System | 93.04% | 99.46% |
| Highlands East, Municipality of | Cardiff Drinking Water System | 100.00% | 100.00% |
| Highlands East, Municipality of | Dyno Estates Drinking Water System | 100.00% | 100.00% |
| Hilton Beach, Village of | Hilton Beach Drinking Water System | 100.00% | 100.00% |
| Hornepayne, Township of | Herbert Avenue Drinking Water System | 100.00% | 99.45% |
| Huntsville, Town of | Huntsville (Fairyview) Drinking Water System | 100.00% | 99.88% |
| Huntsville, Town of | Port Sydney (Clarke Well) Drinking Water System | 100.00% | 99.29% |
| Huron East, Municipality of | Brucefield Drinking Water System | 100.00% | 100.00% |
| Huron East, Municipality of | Brussels Drinking Water System | 100.00% | 100.00% |
| Huron East, Municipality of | Seaforth Drinking Water System | 100.00% | 99.63% |
| Huron East, Municipality of | Vanastra Distribution System | 100.00% | 100.00% |
| Huron-Kinloss, Township of | Huronville Subdivision Distribution System | 100.00% | 100.00% |
| Huron-Kinloss, Township of | Lakeshore Drinking Water System | 85.63% | 99.30% |
| Huron-Kinloss, Township of | Lucknow Drinking Water System | 95.92% | 99.33% |
| Huron-Kinloss, Township of | Ripley Drinking Water System | 100.00% | 99.45% |
| Huron-Kinloss, Township of | Whitechurch Drinking Water System | 100.00% | 100.00% |
| Ignace, Township of | Ignace Drinking Water System | 87.47% | 100.00% |
| Ingersoll, Town of | Ingersoll Drinking Water System | 100.00% | 99.05% |
| Innisfil, Town of | Alcona Drinking Water System | 100.00% | 99.94% |
| Innisfil, Town of | Churchill Drinking Water System | 100.00% | 100.00% |
| Innisfil, Town of | Goldcrest Drinking Water System | 100.00% | 100.00% |
| Innisfil, Town of | Innisfil Heights Drinking Water System | 100.00% | 100.00% |
| Innisfil, Town of | Stroud Drinking Water System | 100.00% | 100.00% |
| Iroquois Falls, Town of | Iroquois Falls Drinking Water System | 100.00% | 99.82% |
| Iroquois Falls, Town of | Monteith Correctional Complex Drinking Water System | 100.00% | 100.00% |
| Iroquois Falls, Town of | Monteith Distribution System | 100.00% | 100.00% |
| Iroquois Falls, Town of | Porquis Junction Drinking Water System | 100.00% | 100.00% |
| James, Township of | Elk Lake Drinking Water System | 95.33% | 100.00% |
| Johnson, Township of | Desbarats Drinking Water System | 100.00% | 100.00% |
| Kapuskasing, Town of | Kapuskasing Drinking Water System | 100.00% | 100.00% |
| Kawartha Lakes, City of | Birchpoint Estates Drinking Water System | 100.00% | 100.00% |
| Kawartha Lakes, City of | Bobcaygeon Drinking Water System | 100.00% | 99.61% |
| Kawartha Lakes, City of | Canadiana Shores Drinking Water System | 100.00% | 100.00% |
| Kawartha Lakes, City of | Fenelon Falls Drinking Water System | 100.00% | 99.61% |
| Kawartha Lakes, City of | Janetville Drinking Water System | 100.00% | 100.00% |
| Kawartha Lakes, City of | King’s Bay Drinking Water System | 100.00% | 100.00% |
| Kawartha Lakes, City of | Kinmount Drinking Water System | 100.00% | 100.00% |
| Kawartha Lakes, City of | Lindsay Drinking Water System | 100.00% | 99.94% |
| Kawartha Lakes, City of | Manilla Drinking Water System | 100.00% | 100.00% |
| Kawartha Lakes, City of | Manorview Drinking Water System | 100.00% | 100.00% |
| Kawartha Lakes, City of | Mariposa Estates Drinking Water System | 100.00% | 100.00% |
| Kawartha Lakes, City of | Norland Drinking Water System | 100.00% | 100.00% |
| Kawartha Lakes, City of | Omemee Drinking Water System | 100.00% | 100.00% |
| Kawartha Lakes, City of | Pinewood Drinking Water System | 100.00% | 99.34% |
| Kawartha Lakes, City of | Pleasant Point Drinking Water System | 100.00% | 100.00% |
| Kawartha Lakes, City of | Sonya Village Subdivision Drinking Water System | 100.00% | 100.00% |
| Kawartha Lakes, City of | Southview Estates Drinking Water System | 100.00% | 100.00% |
| Kawartha Lakes, City of | Victoria Place Drinking Water System | 96.94% | 99.76% |
| Kawartha Lakes, City of | Western Trent/Palmina Drinking Water System | 96.15% | 100.00% |
| Kawartha Lakes, City of | Woodfield Drinking Water System | 100.00% | 100.00% |
| Kawartha Lakes, City of | Woodville Drinking Water System | 98.38% | 100.00% |
| Kenora, City of | Kenora Area Drinking Water System | 100.00% | 99.09% |
| Killaloe, Hagarty and Richards, Township of | Killaloe Drinking Water System | 100.00% | 100.00% |
| Killarney, Municipality of | Killarney Drinking Water System | 100.00% | 99.76% |
| Kincardine, Municipality of | Armow Drinking Water System | 100.00% | 100.00% |
| Kincardine, Municipality of | Kincardine Drinking Water System | 100.00% | 100.00% |
| Kincardine, Municipality of | Scott Point Drinking Water System | 100.00% | 98.51% |
| Kincardine, Municipality of | Tiverton Drinking Water System | 91.52% | 100.00% |
| Kincardine, Municipality of | Underwood Drinking Water System | 100.00% | 100.00% |
| King, Township of | Ansnorveldt Distribution System | 100.00% | 100.00% |
| King, Township of | Ansnorveldt Drinking Water System | 100.00% | 100.00% |
| King, Township of | King City Distribution System | 100.00% | 100.00% |
| King, Township of | King City Drinking Water System | 100.00% | 100.00% |
| King, Township of | Nobleton Distribution System | 100.00% | 100.00% |
| King, Township of | Nobleton Drinking Water System | 100.00% | 100.00% |
| King, Township of | Schomberg Distribution System | 100.00% | 99.70% |
| King, Township of | Schomberg Drinking Water System | 100.00% | 100.00% |
| Kingston, City of | Cana Drinking Water System | 100.00% | 99.58% |
| Kingston, City of | Kingston Drinking Water System - King Street | 100.00% | 99.80% |
| Kingston, City of | Kingston Drinking Water System - Point Pleasant | 100.00% | 100.00% |
| Kingsville, Town of | Kingsville Distribution System | 100.00% | 100.00% |
| Kingsville, Town of | Union Area Water Supply System | 96.77% | 100.00% |
| Kirkland Lake, Town of | Kirkland Lake Drinking Water System | 100.00% | 100.00% |
| Kitchener, City of | Kitchener Distribution System | 91.03% | 99.40% |
| Kitchener, City of | Region of Waterloo Drinking Water System - Kitchener | 100.00% | 100.00% |
| Kitchener, City of | Region of Waterloo Drinking Water System - Mannheim | 100.00% | 100.00% |
| Lake of Bays, Township of | Birch Glen (Baysville) Drinking Water System | 95.87% | 99.61% |
| Lakeshore, Town of | Town of Lakeshore Drinking Water System | 100.00% | 99.90% |
| Lakeshore, Town of | Town of Lakeshore Drinking Water System - Stoney Point | 100.00% | 100.00% |
| Lakeshore, Town of | Town of Lakeshore Drinking Water System - Tecumseh Distribution System | 100.00% | 100.00% |
| Lakeshore, Town of | Town of Lakeshore Drinking Water System - Union Distribution System | 100.00% | 100.00% |
| Lambton Shores, Municipality of | East Lambton Shores Distribution System | 100.00% | 99.94% |
| Lambton Shores, Municipality of | West Lambton Shores Distribution System | 100.00% | 100.00% |
| Larder Lake, Township of | Larder Lake Drinking Water System | 100.00% | 100.00% |
| LaSalle, Town of | Town of Lasalle Distribution System | 100.00% | 100.00% |
| Latchford, Town of | Latchford Drinking Water System | 98.83% | 100.00% |
| Laurentian Hills, Town of | Chalk River Drinking Water System | 100.00% | 99.40% |
| Laurentian Valley, Township of | Laurentian Valley Distribution System | 96.57% | 100.00% |
| Leamington, Municipality of | Leamington Distribution System - Union Distribution System | 100.00% | 99.91% |
| Leamington, Municipality of | Leamington Distribution System - Wheatley Distribution System | 100.00% | 100.00% |
| Leeds and the Thousand Islands, Township of | Lansdowne Drinking Water System | 100.00% | 100.00% |
| Lincoln, Town of | Beamsville Distribution System | 100.00% | 99.75% |
| Lincoln, Town of | Jordan-Vineland Distribution System | 100.00% | 99.49% |
| London, City of | City of London Distribution System | 98.98% | 99.71% |
| Loyalist, Township of | Bath Drinking Water System | 100.00% | 99.85% |
| Loyalist, Township of | Fairfield Drinking Water System | 100.00% | 100.00% |
| Lucan Biddulph, Township of | Lucan Biddulph Distribution System | 91.35% | 100.00% |
| Macdonald, Meredith and Aberdeen Additional, Township of | Echo Bay Drinking Water System | 100.00% | 100.00% |
| Machin, Township of | Vermilion Bay Drinking Water System | 95.80% | 100.00% |
| Madawaska Valley, Township of | Barry’s Bay Drinking Water System | 100.00% | 100.00% |
| Madoc, Township of | Madoc Drinking Water System | 99.27% | 100.00% |
| Malahide, Township of | Malahide Distribution System | 100.00% | 100.00% |
| Malahide, Township of | Port Burwell Area Secondary Water Supply System | 100.00% | 100.00% |
| Manitouwadge, Township of | Manitouwadge Drinking Water System | 96.88% | 100.00% |
| Mapleton, Township of | Drayton Drinking Water System | 100.00% | 100.00% |
| Mapleton, Township of | Moorefield Drinking Water System | 100.00% | 100.00% |
| Marathon, Town of | Marathon Drinking Water System | 85.45% | 100.00% |
| Markham, City of | Markham Distribution System | 100.00% | 99.82% |
| Markham/Richmond Hill/Vaughan, Municipalities of | York Drinking Water System - York Distribution System | 100.00% | 100.00% |
| Markstay-Warren, Municipality of | Markstay Distribution System | 93.37% | 100.00% |
| Markstay-Warren, Municipality of | Warren Drinking Water System | 96.06% | 99.52% |
| Marmora and Lake, Municipality of | Deloro Drinking Water System | 100.00% | 100.00% |
| Marmora and Lake, Municipality of | Marmora Drinking Water System | 100.00% | 100.00% |
| Matachewan, Township of | Matachewan Drinking Water System | 100.00% | 100.00% |
| Mattawa, Town of | Mattawa Drinking Water System | 100.00% | 100.00% |
| Mattice-Val Côté, Township of | Mattice Drinking Water System | 100.00% | 99.28% |
| McDougall, Township of | McDougall Nobel Distribution System | 84.59% | 99.71% |
| McGarry, Township of | Virginiatown-Kearns Drinking Water System | 100.00% | 100.00% |
| Meaford, Municipality of | Leith Distribution System | 96.34% | 99.59% |
| Meaford, Municipality of | Meaford Drinking Water System | 100.00% | 100.00% |
| Merrickville-Wolford, Village of | Merrickville Drinking Water System | 100.00% | 100.00% |
| MiddlesexCentre, Municipality of | Birr Drinking Water System | 95.70% | 100.00% |
| MiddlesexCentre, Municipality of | Melrose Drinking Water System | 91.53% | 100.00% |
| MiddlesexCentre, Municipality of | Middlesex Centre Distribution System - Middlesex Centre Distribution System | 100.00% | 100.00% |
| Midland, Town of | Midland Drinking Water System | 87.53% | 99.53% |
| Milton, Town of | Campbellville Drinking Water System | 100.00% | 100.00% |
| Milton, Town of | South Halton Drinking Water System- Milton | 100.00% | 100.00% |
| Minden Hills, Township of | Lutterworth Pines Drinking Water System | 100.00% | 100.00% |
| Minden Hills, Township of | Minden Drinking Water System | 97.28% | 100.00% |
| Minto, Town of | Clifford Drinking Water System | 100.00% | 100.00% |
| Minto, Town of | Harriston Drinking Water System | 100.00% | 100.00% |
| Minto, Town of | Minto Pines Subdivision Drinking Water System | 100.00% | 100.00% |
| Minto, Town of | Palmerston Drinking Water System | 100.00% | 100.00% |
| Mississauga, City of | South Peel Distribution System | 95.69% | 99.86% |
| Mississauga, City of | South Peel Drinking Water System - Lakeview | 95.75% | 100.00% |
| Mississauga, City of | South Peel Drinking Water System - Lorne Park | 95.67% | 100.00% |
| Mississippi Mills, Town of | Mississippi Mills Drinking Water System | 96.51% | 100.00% |
| Mono, Town of | Cardinal Woods Drinking Water System | 91.46% | 100.00% |
| Mono, Town of | Island Lake Drinking Water System | 97.27% | 100.00% |
| Montague, Township of | Montague Distribution System | 95.42% | 100.00% |
| Moonbeam, Township of | Moonbeam Drinking Water System | 98.22% | 100.00% |
| Moosonee, Town of | Moosonee Drinking Water System | 95.70% | 99.65% |
| Morris-Turnberry, Municipality of | Belgrave Drinking Water System | 100.00% | 99.71% |
| Mulmur, Township of | Mansfield Drinking Water System | 96.91% | 100.00% |
| Muskoka Lakes, Township of | Bala (Minto) Drinking Water System | 100.00% | 99.61% |
| Muskoka Lakes, Township of | Port Carling (Ferndale) Drinking Water System | 100.00% | 100.00% |
| Nairn and Hyman, Township of | Nairn Centre Drinking Water System | 95.38% | 100.00% |
| New Tecumseth, Town of | Alliston Drinking Water System | 93.04% | 100.00% |
| New Tecumseth, Town of | Tottenham Drinking Water System | 88.78% | 99.45% |
| Newbury, Village of | Newbury (West Elgin Area Well Supply) Distribution System | 100.00% | 100.00% |
| Newmarket, Town of | Newmarket Distribution System | 91.14% | 99.82% |
| Newmarket, Town of | York Drinking Water System - Newmarket | 95.21% | 100.00% |
| Niagara Falls, City of | City of Niagara Falls Distribution System | 100.00% | 99.96% |
| Niagara Falls, City of | Decew Falls-Niagara Falls Drinking Water System - Niagara Falls | 100.00% | 100.00% |
| Niagara-on-the-Lake, Town of | Bevan Heights Distribution System | 77.84% | 100.00% |
| Niagara-on-the-Lake, Town of | Niagara-on-the-Lake Distribution System | 78.28% | 100.00% |
| Nipigon, Township of | Nipigon Drinking Water System | 79.19% | 100.00% |
| Norfolk County | Delhi Drinking Water System | 100.00% | 100.00% |
| Norfolk County | Port Dover Drinking Water System | 100.00% | 100.00% |
| Norfolk County | Port Rowan Drinking Water System | 97.46% | 99.62% |
| Norfolk County | Simcoe Drinking Water System | 100.00% | 100.00% |
| Norfolk County | Waterford Drinking Water System | 100.00% | 100.00% |
| North Bay, City of | North Bay Drinking Water System | 96.33% | 99.91% |
| North Dumfries, Township of | Ayr Drinking Water System | 95.33% | 100.00% |
| North Dumfries, Township of | Branchton Drinking Water System | 100.00% | 100.00% |
| North Dumfries, Township of | Region of Waterloo Drinking Water System - Lloyd Brown Distribution System | 100.00% | 100.00% |
| North Dumfries, Township of | Roseville Drinking Water System | 100.00% | 100.00% |
| North Dundas, Township of | Chesterville Drinking Water System | 100.00% | 100.00% |
| North Glengarry, Township of | Alexandria Drinking Water System | 100.00% | 100.00% |
| North Glengarry, Township of | Glen Robertson Drinking Water System | 100.00% | 100.00% |
| North Grenville, Municipality of | Kemptville Drinking Water System | 97.22% | 100.00% |
| North Huron, Township of | Blyth Drinking Water System | 100.00% | 99.62% |
| North Huron, Township of | Wingham Drinking Water System | 100.00% | 100.00% |
| North Middlesex, Municipality of | North Middlesex Distribution System | 100.00% | 99.69% |
| NorthPerth, Municipality of | Atwood Drinking Water System | 100.00% | 99.70% |
| NorthPerth, Municipality of | Gowanstown Subdivision Drinking Water System | 100.00% | 100.00% |
| NorthPerth, Municipality of | Listowel Drinking Water System | 100.00% | 100.00% |
| NorthPerth, Municipality of | Molesworth Drinking Water System | 100.00% | 100.00% |
| North Stormont, Township of | Crysler Drinking Water System | 100.00% | 100.00% |
| North Stormont, Township of | Finch Drinking Water System | 100.00% | 100.00% |
| North Stormont, Township of | Moose Creek Drinking Water System | 100.00% | 100.00% |
| Northeastern Manitoulin and The Islands, Town of | Little Current Drinking Water System | 98.38% | 100.00% |
| Northeastern Manitoulin and The Islands, Town of | Sheguiandah Drinking Water System | 88.34% | 100.00% |
| Northern Bruce Peninsula, Municipality of | Lion’s Head Drinking Water System | 100.00% | 100.00% |
| Norwich, Township of | Norwich Drinking Water System | Not applicable2 | 100.00% |
| Norwich, Township of | Oxford South Drinking Water System | 96.28% | 100.00% |
| Oakville, Town of | South Halton Drinking Water System- Burloak | 100.00% | 100.00% |
| Oakville, Town of | South Halton Drinking Water System- Oakville | 100.00% | 100.00% |
| Oakville, Town of | South Halton Drinking Water System- South Halton Distribution System | 100.00% | 99.95% |
| Oil Springs, Village of | Oil Springs Water Distribution System | 100.00% | 100.00% |
| Oliver Paipoonge, Municipality of | Rosslyn Village Subdivision Drinking Water System | 94.97% | 100.00% |
| Opasatika, Township of | Opasatika Drinking Water System | 100.00% | 100.00% |
| Orangeville, Town of | Orangeville Drinking Water System | 100.00% | 99.97% |
| Orillia, City of | Orillia Drinking Water System | 99.06% | 99.87% |
| Oro-Medonte, Township of | Canterbury Drinking Water System | 100.00% | 98.67% |
| Oro-Medonte, Township of | Cedar Brook Drinking Water System | 95.10% | 100.00% |
| Oro-Medonte, Township of | Craighurst Drinking Water System | 100.00% | 100.00% |
| Oro-Medonte, Township of | Harbourwood Drinking Water System | 100.00% | 100.00% |
| Oro-Medonte, Township of | Horseshoe Highlands Drinking Water System | 100.00% | 100.00% |
| Oro-Medonte, Township of | Maplewood Drinking Water System | 100.00% | 100.00% |
| Oro-Medonte, Township of | Medonte Hills Drinking Water System | 100.00% | 100.00% |
| Oro-Medonte, Township of | Robin Crest Drinking Water System | 96.92% | 100.00% |
| Oro-Medonte, Township of | Shanty Bay Drinking Water System | 95.37% | 100.00% |
| Oro-Medonte, Township of | Sugar Bush Drinking Water System | 100.00% | 100.00% |
| Oro-Medonte, Township of | Warminster Drinking Water System | 100.00% | 99.70% |
| Oshawa, City of | Oshawa-Whitby-Ajax Drinking Water System - Oshawa | 98.99% | 99.96% |
| Otonabee-South Monaghan, Township of | Elgeti and Crystal Springs Subdivisions Drinking Water System | 100.00% | 100.00% |
| Otonabee-South Monaghan, Township of | Keene Heights Subdivision Drinking Water System | 97.77% | 100.00% |
| Ottawa, City of | Carp Drinking Water System | 100.00% | 100.00% |
| Ottawa, City of | Central Drinking Water System - Britannia | 100.00% | 99.84% |
| Ottawa, City of | Central Drinking Water System - Lemieux Island | 100.00% | 100.00% |
| Ottawa, City of | Kings Park Drinking Water System | 100.00% | 99.90% |
| Ottawa, City of | Munster Hamlet Drinking Water System | 100.00% | 100.00% |
| Ottawa, City of | Shadow Ridge Drinking Water System | 100.00% | 99.76% |
| Ottawa, City of | Vars Drinking Water System | 100.00% | 100.00% |
| Owen Sound, City of | Owen Sound Drinking Water System | 96.06% | 100.00% |
| Parry Sound, Town of | Parry Sound Drinking Water System | 100.00% | 100.00% |
| Pelham, Town of | Pelham Distribution System | 100.00% | 99.78% |
| Pembroke, City of | Pembroke Drinking Water System | 98.26% | 99.73% |
| Penetanguishene, Town of | Lepage Subdivision (Penetanguishene) Drinking Water System | 100.00% | 100.00% |
| Penetanguishene, Town of | Payette (Penetanguishene) Drinking Water System | 100.00% | 100.00% |
| Perth East, Township of | Milverton Drinking Water System | 92.74% | 100.00% |
| Perth East, Township of | Shakespeare Drinking Water System | 93.53% | 99.70% |
| Perth South, Township of | Sebringville Drinking Water System | 87.47% | 98.78% |
| Perth South, Township of | St. Pauls Drinking Water System | 88.40% | 98.80% |
| Perth, Town of | Perth Drinking Water System | 98.30% | 100.00% |
| Petawawa, Town of | Petawawa Drinking Water System | 100.00% | 99.88% |
| Peterborough, City of | Peterborough Drinking Water System | 100.00% | 99.78% |
| Petrolia, Town of | Petrolia Drinking Water System | 97.39% | 99.73% |
| Pickle Lake, Township of | Pickle Lake Drinking Water System | 98.20% | 100.00% |
| Plympton-Wyoming, Town of | Plympton-Wyoming Distribution System | 97.56% | 100.00% |
| Point Edward, Village of | Village of Point Edward Distribution System | 98.59% | 100.00% |
| Port Colborne, City of | Port Colborne Distribution System | 100.00% | 99.88% |
| Port Colborne, City of | Port Colborne Drinking Water System | 100.00% | 100.00% |
| Port Hope, Municipality of | Port Hope Drinking Water System | 100.00% | 100.00% |
| Powassan, Municipality of | Powassan Drinking Water System | 92.53% | 100.00% |
| Prescott, Town of | Prescott Drinking Water System | 100.00% | 100.00% |
| Prince Edward, County of | Ameliasburgh Hamlet Drinking Water System | 95.67% | 100.00% |
| Prince Edward, County of | Consecon/Carrying Place Distribution System | 98.90% | 100.00% |
| Prince Edward, County of | Fenwood Gardens/Rossmore Distribution System | 100.00% | 100.00% |
| Prince Edward, County of | Peats Point Subdivision Drinking Water System | 96.27% | 100.00% |
| Prince Edward, County of | Picton Drinking Water System | 95.83% | 99.47% |
| Prince Edward, County of | Wellington Drinking Water System | 100.00% | 100.00% |
| Quinte West, City of | Bayside Drinking Water System | 100.00% | 99.82% |
| Quinte West, City of | Frankford-Batawa Drinking Water System | 98.22% | 100.00% |
| Quinte West, City of | Trenton Drinking Water System | 100.00% | 99.90% |
| Rainy River, Town of | Rainy River Drinking Water System | 95.73% | 98.80% |
| Ramara, Township of | Bayshore Village Subdivision Drinking Water System | 100.00% | 100.00% |
| Ramara, Township of | Brechin and Lagoon City Drinking Water System | 95.26% | 100.00% |
| Ramara, Township of | Davy Drive Subdivision Drinking Water System | 100.00% | 100.00% |
| Ramara, Township of | Park Lane Subdivision Drinking Water System | 100.00% | 100.00% |
| Ramara, Township of | Somerset/ Knob Hill Distribution System | 100.00% | 99.56% |
| Ramara, Township of | South Ramara Drinking Water System | 100.00% | 100.00% |
| Ramara, Township of | Val Harbour Subdivision Drinking Water System | 100.00% | 100.00% |
| Red Lake, Municipality of | Balmertown Cochenour Mackenzie Island Drinking Water System | 95.80% | 99.87% |
| Red Lake, Municipality of | Madsen Drinking Water System | 92.45% | 100.00% |
| Red Lake, Municipality of | Red Lake Drinking Water System | 93.35% | 99.44% |
| Red Rock, Township of | Red Rock Drinking Water System | 87.73% | 100.00% |
| Renfrew, Town of | Renfrew Drinking Water System | 90.75% | 99.51% |
| Richmond Hill, Town of | Richmond Hill Distribution System | 100.00% | 99.52% |
| Russell, Township of | Russell Distribution System | 100.00% | 99.54% |
| Sables-Spanish Rivers, Township of | Massey Drinking Water System | 98.61% | 99.58% |
| Sarnia, City of | Lambton Area Water Supply System | 100.00% | 100.00% |
| Sarnia, City of | Sarnia Distribution System | 98.77% | 99.95% |
| Saugeen Shores, Town of | Saugeen Shores Drinking Water System | 100.00% | 100.00% |
| Sault Ste. Marie, City of | Sault Ste. Marie Drinking Water System | 100.00% | 100.00% |
| Schreiber, Township of | Schreiber Drinking Water System | 100.00% | 100.00% |
| Scugog, Township of | Blackstock Drinking Water System | 98.22% | 99.86% |
| Scugog, Township of | Greenbank Drinking Water System | 98.27% | 99.81% |
| Scugog, Township of | Port Perry Drinking Water System | 95.46% | 99.66% |
| Severn, Township of | Bass Lake Woodlands Drinking Water System | 100.00% | 100.00% |
| Severn, Township of | Coldwater Drinking Water System | 100.00% | 100.00% |
| Severn, Township of | Sandcastle Estates Drinking Water System | 95.83% | 99.24% |
| Severn, Township of | Severn Estates Drinking Water System | 100.00% | 100.00% |
| Severn, Township of | Washago Drinking Water System | 100.00% | 100.00% |
| Severn, Township of | West Shore Drinking Water System | 100.00% | 99.80% |
| Shelburne, Town of | Shelburne Drinking Water System | 100.00% | 100.00% |
| Sioux Lookout, Municipality of | Hudson Drinking Water System | 100.00% | 100.00% |
| Sioux Lookout, Municipality of | Sioux Lookout Urban Drinking Water System | 87.09% | 99.41% |
| Smith Falls, Town of | Smiths Falls Drinking Water System | 95.34% | 100.00% |
| Smith-Ennismore- Lakefield, Township of | Lakefield Drinking Water System | 100.00% | 100.00% |
| Smith-Ennismore- Lakefield, Township of | Woodland Acres Subdivision Distribution System | 100.00% | 100.00% |
| Smooth Rock Falls, Town of | Smooth Rock Falls Drinking Water System | 100.00% | 99.77% |
| South Bruce Peninsula, Town of | Amabel-Sauble Drinking Water System | 100.00% | 100.00% |
| South Bruce Peninsula, Town of | Foreman Drinking Water System | 100.00% | 100.00% |
| South Bruce Peninsula, Town of | Huron Woods Drinking Water System | 100.00% | 100.00% |
| South Bruce Peninsula, Town of | Oliphant Drinking Water System | 100.00% | 100.00% |
| South Bruce Peninsula, Town of | Wiarton Drinking Water System | 100.00% | 100.00% |
| South Bruce, Municipality of | Mildmay Drinking Water System | 98.30% | 100.00% |
| South Bruce, Municipality of | Teeswater Drinking Water System | 98.43% | 99.81% |
| South Dundas, Township of | South Dundas Regional Drinking Water System | 100.00% | 99.61% |
| South Frontenac, Township of | Sydenham Drinking Water System | 100.00% | 100.00% |
| South Glengarry, Township of | Glen Walter Drinking Water System | 100.00% | 100.00% |
| South Glengarry, Township of | Lancaster Drinking Water System | 96.74% | 100.00% |
| South Glengarry, Township of | Redwood Estates Drinking Water System | 100.00% | 99.23% |
| South Huron, Municipality of | Lake Huron Primary Water Supply System | 94.48% | 100.00% |
| South Huron, Municipality of | South Huron Distribution System | 100.00% | 100.00% |
| South River, Village of | South River Drinking Water System | 94.37% | 100.00% |
| South Stormont, Township of | Long Sault/Ingleside Regional Drinking Water System | 98.21% | 100.00% |
| South Stormont, Township of | Newington Drinking Water System | 98.33% | 100.00% |
| South Stormont, Township of | St. Andrews/Rosedale Terrace Distribution System | 98.36% | 100.00% |
| Southgate, Township of | Dundalk Drinking Water System | 97.37% | 99.88% |
| Southwest Middlesex, Municipality of | Southwest Middlesex Distribution System | 94.37% | 99.86% |
| South-West Oxford, Township of | Beachville Drinking Water System | 96.77% | 100.00% |
| South-West Oxford, Township of | Brownsville Drinking Water System | 98.10% | 99.40% |
| South-West Oxford, Township of | Dereham Centre Drinking Water System | 100.00% | 100.00% |
| South-West Oxford, Township of | Mount Elgin Drinking Water System | 100.00% | 100.00% |
| Southwold, Township of | Southwold Distribution System | 99.20% | 100.00% |
| Spanish, Town of | Spanish Drinking Water System | 88.12% | 100.00% |
| Springwater, Township of | Anten Mills Drinking Water System | 100.00% | 99.74% |
| Springwater, Township of | Del Trend Subdivision Drinking Water System | 96.54% | 100.00% |
| Springwater, Township of | Elmvale Drinking Water System | 100.00% | 100.00% |
| Springwater, Township of | Hillsdale Drinking Water System | 100.00% | 100.00% |
| Springwater, Township of | Midhurst Drinking Water System | 100.00% | 100.00% |
| Springwater, Township of | Minesing Drinking Water System | 100.00% | 100.00% |
| Springwater, Township of | Phelpston Drinking Water System | 100.00% | 100.00% |
| Springwater, Township of | Snow Valley Highlands Drinking Water System | 100.00% | 100.00% |
| Springwater, Township of | Vespra Downs Subdivision Drinking Water System | 100.00% | 100.00% |
| St. Catharines, City of | Decew Falls-Niagara Falls Drinking Water System - Decew Falls | 100.00% | 99.92% |
| St. Catharines, City of | St. Catharines Distribution System | 91.18% | 99.97% |
| St. Clair, Township of | St. Clair Distribution System | 92.28% | 100.00% |
| St. Joseph, Township of | Richards Landing Drinking Water System | 100.00% | 100.00% |
| St. Marys, Town of | St. Marys Drinking Water System | 93.68% | 100.00% |
| St. Thomas, City of | St. Thomas Area Secondary Water Supply System | 86.04% | 100.00% |
| St. Thomas, City of | City of St. Thomas Distribution System | 100.00% | 99.87% |
| Stirling-Rawdon, Township of | Stirling Drinking Water System | 96.70% | 100.00% |
| Stratford, City of | Stratford Drinking Water System | 98.13% | 98.97% |
| Strathroy-Caradoc, Township of | Strathroy-Caradoc Distribution System - Strathroy Distribution System | 95.84% | 99.67% |
| Tay, Township of | Rope Drinking Water System | 100.00% | 100.00% |
| Tay, Township of | Victoria Harbour Drinking Water System | 91.94% | 99.92% |
| Tecumseh, Town of | Tecumseh Distribution System | 91.49% | 99.91% |
| Tehkummah, Township of | South Baymouth Drinking Water System | 100.00% | 100.00% |
| Temagami, Municipality of | Temagami North Drinking Water System | 98.19% | 100.00% |
| Temagami, Municipality of | Temagami South Drinking Water System | 98.19% | 100.00% |
| Temiskaming Shores, City of | Dymond Drinking Water System | 93.35% | 100.00% |
| Temiskaming Shores, City of | Haileybury Drinking Water System | 98.41% | 100.00% |
| Temiskaming Shores, City of | New Liskeard Drinking Water System | 98.85% | 100.00% |
| Terrace Bay, Township of | Terrace Bay Drinking Water System | 93.29% | 100.00% |
| Thames Centre, Municipality of | Dorchester Drinking Water System | 100.00% | 100.00% |
| Thames Centre, Municipality of | Thorndale Drinking Water System | 97.00% | 99.70% |
| The Blue Mountains, Town of | Thornbury Drinking Water System | 92.71% | 99.92% |
| The Nation, Municipality of | Limoges Drinking Water System | 95.79% | 99.24% |
| The Nation, Municipality of | St. Isidore Distribution System | 100.00% | 100.00% |
| The North Shore, Township of | Pronto East Subdivision Drinking Water System | 100.00% | 98.26% |
| The North Shore, Township of | Serpent River Drinking Water System | 100.00% | 100.00% |
| Thessalon, Town of | Thessalon Drinking Water System | 100.00% | 100.00% |
| Thorold, City of | Thorold (Decew) Distribution System | 100.00% | 100.00% |
| Thorold, City of | Thorold (Port Robinson) Distribution System | 100.00% | 99.70% |
| Thunder Bay, City of | Bare Point Road Drinking Water System | 97.39% | 99.87% |
| Tillsonburg, Town of | Tillsonburg Drinking Water System | 96.20% | 100.00% |
| Timmins, City of | Timmins Drinking Water System | 100.00% | 100.00% |
| Tiny, Township of | Bluewater Drinking Water System | 100.00% | 99.79% |
| Tiny, Township of | Castle Cove Drinking Water System | 100.00% | 100.00% |
| Tiny, Township of | Cook’s Lake Drinking Water System | 100.00% | 100.00% |
| Tiny, Township of | Georgian Bay Estates Drinking Water System | 100.00% | 100.00% |
| Tiny, Township of | Lafontaine Drinking Water System | 94.25% | 100.00% |
| Tiny, Township of | Lefaive Drinking Water System | 100.00% | 100.00% |
| Tiny, Township of | Pennorth Drinking Water System | 95.10% | 100.00% |
| Tiny, Township of | Perkinsfield Drinking Water System | 98.90% | 99.56% |
| Tiny, Township of | Rayko Drinking Water System | 100.00% | 100.00% |
| Tiny, Township of | Sawlog Bay Drinking Water System | 96.71% | 99.21% |
| Tiny, Township of | Tee Pee Point Drinking Water System | 100.00% | 100.00% |
| Tiny, Township of | Thunder Bay Drinking Water System | 100.00% | 99.21% |
| Tiny, Township of | Vanier Woods Drinking Water System | 100.00% | 100.00% |
| Tiny, Township of | Whip-Poor-Will Drinking Water System | 96.27% | 100.00% |
| Tiny, Township of | Woodland Beach Drinking Water System | 100.00% | 100.00% |
| Tiny, Township of | Wyevale Drinking Water System | 100.00% | 99.82% |
| Toronto, City of | City of Toronto Drinking Water System - F. J. Horgan | 100.00% | 100.00% |
| Toronto, City of | City of Toronto Drinking Water System - R. L.Clark | 100.00% | 99.97% |
| Toronto, City of | City of Toronto Drinking Water System - R.C.Harris | 100.00% | 100.00% |
| Toronto, City of | City of Toronto Drinking Water System - Toronto Distribution System | 100.00% | 97.26% |
| Toronto, City of | City of Toronto Drinking Water System - Toronto Island | 100.00% | 100.00% |
| Trent Hills, Municipality of | Campbellford Drinking Water System | 100.00% | 100.00% |
| Trent Hills, Municipality of | Hastings Drinking Water System | 100.00% | 99.81% |
| Trent Hills, Municipality of | Warkworth Drinking Water System | 100.00% | 99.76% |
| Tweed, Municipality of | Tweed Drinking Water System | 100.00% | 100.00% |
| Uxbridge, Township of | Uxbridge Drinking Water System | 98.51% | 100.00% |
| Val Rita-Harty, Township of | Val Rita Drinking Water System | 100.00% | 100.00% |
| Vaughan, City of | Kleinburg Drinking Water System | 100.00% | 100.00% |
| Vaughan, City of | Vaughan Distribution System | 100.00% | 99.85% |
| Warwick, Township of | Township of Warwick Distribution System | 97.45% | 100.00% |
| Wasaga Beach, Town of | Wasaga Beach Drinking Water System | 96.92% | 100.00% |
| Waterloo, City of | City of Waterloo Distribution System | 100.00% | 99.69% |
| Waterloo, City of | Region of Waterloo Drinking Water System - Waterloo | 100.00% | 100.00% |
| Wawa, Municipality of | Wawa Drinking Water System | 100.00% | 99.67% |
| Welland, City of | Welland Distribution System | 100.00% | 99.91% |
| Welland, City of | Welland Drinking Water System | 100.00% | 100.00% |
| Wellesley, Township of | Linwood Drinking Water System | 100.00% | 99.78% |
| Wellesley, Township of | St. Clements Drinking Water System | 100.00% | 100.00% |
| Wellesley, Township of | Wellesley Drinking Water System | 100.00% | 100.00% |
| Wellington North, Township of | Arthur Drinking Water System | 100.00% | 100.00% |
| Wellington North, Township of | Mount Forest Drinking Water System | 100.00% | 100.00% |
| West Elgin, Municipality of | Tri-County Drinking Water System | 94.03% | 99.85% |
| West Elgin, Municipality of | West Elgin Distribution System | 100.00% | 100.00% |
| West Grey, Municipality of | Durham Drinking Water System | 97.35% | 100.00% |
| West Grey, Municipality of | Neustadt Drinking Water System | 100.00% | 100.00% |
| West Lincoln, Township of | Smithville Distribution System | 100.00% | 99.26% |
| West Nipissing, Municipality of | Sturgeon Falls Drinking Water System | 100.00% | 100.00% |
| West Nipissing, Municipality of | Verner Drinking Water System | 94.66% | 100.00% |
| West Perth, Municipality of | Mitchell Drinking Water System | 95.86% | 99.71% |
| Westport, Village of | Westport Drinking Water System | 96.07% | 99.13% |
| Whitby, Town of | Oshawa-Whitby-Ajax Drinking Water System - Whitby | 98.98% | 99.96% |
| Whitchurch-Stouffville, Town of | Ballantrae-Musselman Lake Distribution System | 100.00% | 99.43% |
| Whitchurch-Stouffville, Town of | Ballantrae-Musselman’s Drinking Water System | 100.00% | 100.00% |
| Whitchurch-Stouffville, Town of | Stouffville Distribution System | 100.00% | 99.94% |
| Whitchurch-Stouffville, Town of | York Drinking Water System - Stouffville | 100.00% | 100.00% |
| White River, Township of | White River Drinking Water System | 99.49% | 99.00% |
| Whitewater Region, Township of | Beachburg Drinking Water System | 100.00% | 100.00% |
| Whitewater Region, Township of | Cobden Drinking Water System | 96.95% | 99.77% |
| Whitewater Region, Township of | Haley Drinking Water System | 100.00% | 100.00% |
| Wilmot, Township of | Foxboro Drinking Water System | 94.34% | 99.46% |
| Wilmot, Township of | New Dundee Distribution System | 95.65% | 100.00% |
| Wilmot, Township of | New Dundee Drinking Water System | 100.00% | 100.00% |
| Wilmot, Township of | New Hamburg-Baden Distribution System | 83.40% | 100.00% |
| Wilmot, Township of | Region of Waterloo Drinking Water System - Mannheim Village | 100.00% | 100.00% |
| Wilmot, Township of | Region of Waterloo Drinking Water System - New Hamburg-Baden | 100.00% | 100.00% |
| Wilmot, Township of | Region of Waterloo Drinking Water System -Shingletown | 100.00% | 100.00% |
| Wilmot, Township of | St. Agatha Distribution System | 96.71% | 99.10% |
| Windsor, City of | City of Windsor Drinking Water System | 100.00% | 99.88% |
| Woodstock, City of | Woodstock Drinking Water System | 100.00% | 99.68% |
| Woolwich, Township of | Conestogo Golf Distribution System | 100.00% | 100.00% |
| Woolwich, Township of | Conestogo Golf Drinking Water System | 100.00% | 100.00% |
| Woolwich, Township of | Conestogo Plains Distribution System | 100.00% | 100.00% |
| Woolwich, Township of | Conestogo Plains Drinking Water System | 100.00% | 100.00% |
| Woolwich, Township of | Elmira-St. Jacobs-Breslau Distribution System - Breslau Distribution System | 100.00% | 100.00% |
| Woolwich, Township of | Elmira-St. Jacobs-Breslau Distribution System - Elmira-St. Jacobs Distribution System | 100.00% | 99.56% |
| Woolwich, Township of | Heidelberg Distribution System | 100.00% | 100.00% |
| Woolwich, Township of | Heidelberg Drinking Water System | 100.00% | 100.00% |
| Woolwich, Township of | Maryhill Drinking Water System - Maryhill | 100.00% | 100.00% |
| Woolwich, Township of | Maryhill Drinking Water System - Maryhill Village Heights | 100.00% | 100.00% |
| Woolwich, Township of | Maryhill Heights Distribution System | 100.00% | 100.00% |
| Woolwich, Township of | Maryhill Isley Distribution System | 100.00% | 100.00% |
| Woolwich, Township of | West Montrose Distribution System | 100.00% | 100.00% |
| Woolwich, Township of | West Montrose Drinking Water System | 100.00% | 100.00% |
| Zorra, Township of | Embro Drinking Water System | 100.00% | 100.00% |
| Zorra, Township of | Lakeside Drinking Water System | 95.25% | 99.40% |
| Zorra, Township of | Thamesford Drinking Water System | 100.00% | 99.79% |
1 Three systems that received their water from another municipal residential drinking water system had their samples represented within the samples collected and submitted by municipal residential drinking water systems that supplied water to them.
2 In 2014-15, the Norwich Drinking Water System amalgamated with the Otterville-Springford Drinking Water System forming the Oxford South Drinking Water System. The inspection and subsequent inspection rating of the Oxford South Drinking Water System included data review and an inspection of the Norwich and Otterville- Springford Drinking Water Systems during the 2014-15 inspection cycle. The percentage of drinking water quality tests meeting standards represents samples taken up to the point of the amalgamation.
Appendix 2: Status of lead control strategy in 2014-15
| Municipality | Date municipality identified for corrosion control | Lead control strategy | Corrosion control status | Lead service line replacement status |
|---|---|---|---|---|
| Lucan Biddulph, The Corporation of the Township of | October 15, 2008 |
|
|
|
| Owen Sound, The Corporation of the City of | October 15, 2008 |
|
|
|
| Red Lake, The Corporation of the Municipality of | October 15, 2008 |
|
|
|
| Smiths Falls, The Corporation of the Separated Town of | October 15, 2008 |
|
|
|
| Terrace Bay, The Corporation of the Township of | October 15, 2008 |
|
|
|
| Ear Falls, The Corporation of the Township of | April 1, 2009 |
|
|
|
| London, The Corporation of the City of | October 15, 2008 |
|
|
|
| Toronto, City of | October 15, 2009 |
|
|
|
| Arnprior, The Corporation of the Town of | October 15, 2008 |
|
|
|
| Brantford, The Corporation of the City of | October 15, 2008 |
|
|
|
| Gananoque, The Corporation of the Separated Town of | October 15, 2008 |
|
|
|
| Guelph, The Corporation of the City of | October 15, 2008 |
|
|
|
| Hamilton, City of | October 15, 2008 |
|
|
|
| Sarnia, The City of | October 15, 2008 |
|
|
|
| Sault Ste. Marie, City of | October 15, 2008 |
|
|
|
| Sioux Lookout, The Corporation of the Municipality of | October 15, 2008 |
|
|
|
| Thunder Bay, The Corporation of the City of | October 15, 2008 |
|
|
|
| Welland, The Corporation of the City of | October 15, 2008 |
|
|
|
| Windsor, City of | October 15, 2008 |
|
|
|
| Woolwich, The Corporation of the Township of | October 15, 2009 |
|
|
|
Appendix 3: Summary of municipal residential drinking water systems receiving orders in 2014-15
| Drinking water system owner | Name of system related to order | Type of order | Date order issued | Order synopsis |
|---|---|---|---|---|
| Niagara Falls, The Corporation of The City of | City of Niagara Falls Distribution System | Preventative measures order | July 25, 2014 |
|
Appendix 4: Summary of non-licensed facilities receiving orders in 2014-15
| Laboratory name | Municipal location | Type of order | Date order issued | Order synopsis |
|---|---|---|---|---|
| 2293560 Ontario Inc. | Orillia, City of | Contravention | March 30, 2015 |
|
Appendix 5: Summary of municipal residential drinking water system convictions – April 1, 2014 to March 31, 20151
| Operator of drinking water system | Name of system related to conviction | Synopsis | Date charges laid | Conviction date | Total fines |
|---|---|---|---|---|---|
| 7064152 Canada Ltd. | Westport Drinking Water System | A legal entity and one individual were convicted for offences related to operator certificates for water quality analysts, proper maintenance of log/record keeping mechanisms, for providing false or misleading information to a Provincial Officer and for failing to comply with a Provincial Officer’s Order. | July 23, 2013 | May 30, 2014 | $19,000.00 |
| Total | $19,000.00 | ||||
1 The conviction statistics include date of charge and conviction, not offence date.
Appendix 6: Summary of non-municipal year-round residential drinking water system convictions – April 1, 2014 to March 31, 20151
| Name of system related to conviction | Synopsis | Date charges laid | Conviction date | Total fines |
|---|---|---|---|---|
| The Olde Hotel Apartments Well Supply | An individual was convicted for failing to ensure that at least one distribution sample was taken every two weeks and tested for microbiological parameters. | January 14, 2015 | March 17, 2015 | $1,600 |
| Ravenscliffe Road Apartments Well Supply | An individual was convicted for failing to collect required distribution samples. | March 19, 2014 | September 16, 2014 | $2,000 |
| Muskoka All Seasons Resort Well Supply | A legal entity was convicted for failing to ensure that a drinking water treatment system was being maintained by a licenced operator. | March 13, 2014 | September 12, 2014 | $7,000 |
| Michael Tierney’s Apartments Well Supply | An individual was convicted for offences related to failing to ensure the provision of adequate water treatment equipment, failing to ensure system operation by trained personnel and failing to adequately sample the distribution system. | January 14, 2015 | February 17, 2015 | $7,500 |
| Peace Valley Trailer Haven Well Supply | An individual was convicted for failing to comply with a Provincial Officer’s Order related to the operation of a drinking water system. | July 5, 2013 | February 13, 2015 | $5,000 |
| Willowdale Trailer Court Well Supply | An individual was convicted for failing to ensure that a drinking water system at a trailer park was operated in compliance with the Safe Drinking Water Act and for failing to comply with a Provincial Officer’s Order issued to address the non- compliance. | January 15, 2014 | September 4, 2014 | $20,000 |
| 374 Front Road East Well Supply | An individual was convicted for operating a drinking water system without a valid operator’s certificate and for failing to ensure that a licenced engineering practitioner prepared a report within thirty days after the system commenced operation. | September 9, 2013 | April 3, 2014 | $7,000 |
| Total | $50,100.00 | |||
1 The conviction statistics include date of charge and conviction, not offence date.
Appendix 7: Summary of systems serving designated facilities convictions – April 1, 2014 to March 31, 20151
| Name of system related to conviction | Synopsis | Date charges laid | Conviction date | Total fines |
|---|---|---|---|---|
| YMCA-YMCA Camp Stephens Water Treatment Plant | A legal entity was convicted for failing to report that inadequately treated water was directed to users of a drinking water system. | August 30, 2013 | May 8, 2014 | $24,000 |
| Choices - Harvest Well Supply,Choices - Orkney Well Supply, Choices - Rockton Well Supply, Choices - Westfield Well Supply | A legal entity was convicted for offences related to issues at four different drinking water systems, including offences related to sampling, operator training, preparation of a maintenance schedule and notifying the Director of any change in information. | July 18, 2013 | July 17, 2014 | $14,000 |
| Jaamiah Al Uloom Al Islamiyyah Well Supply | An individual was convicted for failing to comply with a Provincial Officer’s Order to provide written confirmation from a Certified Operator that drinking water treatment equipment was in good repair. | July 18, 2012 | April 2, 2014 | $5,000 |
| Christian Horizons Simcoe 3 Well Supply | A legal entity and an individual were convicted for failing to properly operate drinking water treatment equipment and for providing false and misleading information to a Provincial Officer. | March 19, 2014 | June 18, 2014 & August 11, 2014 | $10,500 |
| Cairn Well Supply | A legal entity was convicted for failing to report a prescribed adverse water quality result, failing to ensure the maintenance schedule was followed by trained personnel and failing to ensure that no drinking water was supplied to users of water after a shutdown period of seven or more consecutive days until samples had been taken and tested. | September 18, 2014 | November 18, 2014 | $5,000 |
| Camp Seedrioru Well Supply | A legal entity was convicted for failing to take water samples and have them tested after a shutdown for a period of seven or more consecutive days prior to supplying water to the users of the water. | May 5, 2014 | September 8, 2014 | $2,500 |
| Weechi-It-Te-Win Ganawendaasowin Treatment Program Well Supply | A legal entity was convicted for failing to immediately report that drinking water had not been properly disinfected. | June 2, 2014 | August 29, 2014 | $2,400 |
| Lake Joseph Centre (CNIB) Well Supply | A legal entity and an individual were convicted for failing to ensure that water samples for sodium and fluoride were taken, failing to ensure that an annual report had been prepared, and for including false or misleading information in a document. | September 27, 2013 | November 18, 2014 | $12,500 |
| Total | $75,900.00 | |||
1 The conviction statistics include date of charge and conviction, not offence date.
Appendix 8: Summary of non-licensed facility convictions – April 1, 2014 to March 31, 20151
| Non-licensed facility | Synopsis | Date charges laid | Conviction date | Total fines |
|---|---|---|---|---|
| GAP EnviroMicrobial Services Ltd. | A legal entity and one individual were convicted for failing to immediately report prescribed adverse results for a drinking water test. | January 30, 2014 | January 6, 2015 | $13,500.00 |
| Total | $13,500.00 | |||
1 The conviction statistics include date of charge and conviction, not offence date.
Appendix 9: Summary of drinking water consultant convictions – April 1, 2014 to March 31, 20151
| Drinking water consultant | Synopsis | Date charges laid | Conviction date | Total fines |
|---|---|---|---|---|
| Garry Palmateer Consulting Inc.2 | An individual was convicted of offering and providing a drinking water testing service without a valid drinking water testing licence. | January 30, 2014 | December 9, 2014 | $2,500.00 |
| Total | $2,500.00 | |||
1 The conviction statistics include date of charge and conviction, not offence date.
2 The corporation was not charged in this case.
Appendix 10: Disciplinary actions taken against certified drinking water operators in 2014-2015
| Operator: | Reason for action: | Action taken: |
|---|---|---|
| #11 | Operator failed to exercise the level of care, diligence and skill that a reasonably prudent operator would be expected to exercise; failed to act honestly, competently and with integrity; worked as an operator without being certified as such. | Revoked: Class II Water Distribution and Supply Certificate. |
| #2 | Operator candidate did not follow exam procedures. | Written notice issued to candidate by Director. |
1 In addition to the disciplinary actions described above, the operator was convicted under the Safe Drinking Water Act and fined under $1,000.