Economic impact of infrastructure investments across asset categories in Ontario
This report examines the long-term quantitative economic impacts of Ontario’s infrastructure investment across a range of asset categories.
Executive Summary
Background and study objectives
The Province of Ontario is served by a large, complex portfolio of public infrastructure with an estimated replacement value of nearly $400 billion
In this context, the Ministry required a credible and quantitatively robust assessment of infrastructure investment impacts in Ontario that provides insight into the effects of historical infrastructure investment on the economic performance of the Province. To assist in this process, the Ministry retained Deloitte LLP (“Deloitte”) to lead a study (“Study”) to examine the long-term quantitative economic impacts of Ontario’s infrastructure investment across a range of asset categories. The findings from this Study presented in this report (“Report”) are intended to serve as an important input into the Ministry’s broader consideration of an investment allocation framework in support of future Provincial infrastructure investment decisions.
Scope of study and overview of approach
- Summarize Ontario infrastructure trends
- Conducting a review of data and key trends associated with historical infrastrcture investment in Ontario, including total infrastructure investiment, infrastructure investment trends by sector / asset category and additional metrics.
- Conduct summary of various liture reviews
- Preparing a literature review summary, including a review of different analytical methods for estimating the relative impack across asset categories on economic growth resulting in the identification of the prefered approach for estimating the long-term economic impact of infrastructure across assets in Ontario.
- Assess long-term exonomic impact of infrastructure investment in Ontario
- Conducting robust and reliable assessment estimating the long-term exonomic impact of infrastructure investment spending in Ontari, ncluding aggregate and sectore effects of aggregate infrastructure investment in Ontario.
- Interpretation of quantitative results, by exploring the conceptual link between investment and drivers of economic growth.
- Identify future investment allocation framework consideration
- Summarize potential applicability of findings to support investment decision making
- Identify additional parameters to be condifered in developing optimal infrastructure investment allocation.
Long-term economic impact assessment of public infrastructure investments in Ontario
Infrastructure asset categories
In this Study, economic effects are analyzed for investments across different infrastructure asset categories, allowing for the identification of which sectors have been the most economically beneficial for the Province over the long-term. These sectors include:
- Highways, Roads and Bridges
- Transit
- Education
- Health
- Waste, Water and Wastewater
- Government Administration and other infrastructure (including justice, public safety, and defence)
The data utilized in the Study includes annual data for the period 1976 to 2011, obtained from Statistics Canada and the Infrastructure Policy and Planning Division of MOI. The data reflect important general trends in Ontario, namely, growing infrastructure investment during the 1960s (a period outside our sample period), a subsequent slowdown in infrastructure investment during the 1970s, 1980s and 1990s, and a renewal in investment efforts since 2000. Public infrastructure investment was 4.3% of the GDP in the 1960s and declined to 2.6% during the 1980s and 1990s and has now reached 2.8% in the last decade.
A breakdown of historical total public and private investment trends by asset category is provided in the figure below. With respect to total investment, Ontario has typically committed a relatively high portion of total investment in Highways, Roads and Bridges (34% of total investment in 2011), followed by Government Administration (22%), Education (13%), Health (13%), Transit (10%) and Waste, Water and Wastewater (8%).
Total infrastructure investment by sector, 1961-2011 (% proportion of total infrastructure investment)
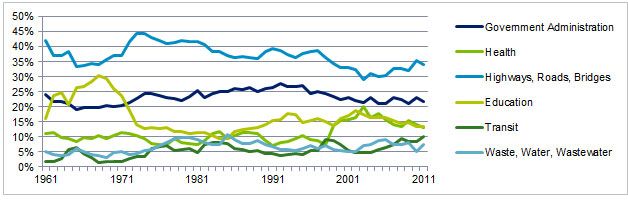
Source: Ontario Ministry of Infrastructure, Infrastructure Policy & Planning Division
Notes: Based on infrastructure investment in 2007 dollars
Overview of methodology
To meet the MOI’s requirement for a robust and credible methodology to quantitatively assess the long-term economic impacts of historical infrastructure investments in Ontario by asset category, Deloitte engaged Professor Alfredo Pereira, a leading applied economist from the College of William and Mary in Williamsburg, Virginia, to utilize a tested methodology within an Ontario context. Professor Pereira has published a number of research papers in the economics literature investigating the economic impact of infrastructure investments across different infrastructure types or asset categories, including developing such analysis for the United States, Portugal and Spain. In addition to applying a methodology that is well-accepted in the literature, Pereira is one of few researchers in recent years who has looked beyond impacts of investing in infrastructure at the aggregate level and quantified the effect of infrastructure investment in specific sectors of the economy.
The objective of Pereira’s methodology is to understand the long-term effects of public infrastructure spending on the economy. Pereira’s approach produces an econometric determination of the long-run sensitivity of GDP to investment for each sector, identifying a numerical value which captures the dynamic effects that GDP and investment spending each have on the other. The approach employs Vector Autoregressive (VAR) modelling to analyze the impact of public infrastructure investment on economic performance in Ontario, first at the aggregate level, and then considering different asset categories or sectors. The analysis produces estimates of elasticities of GDP, employment, and private investment with respect to public infrastructure investments, and more importantly from a policy perspective, the marginal productivities of public infrastructure investment when considering the observed levels of relative infrastructure scarcity. In this context, “scarcity” refers to the value of the existing stock of an infrastructure asset as a proportion of GDP. Increases in the infrastructure stock relative to GDP indicate less “scarcity” of infrastructure that is available in an economy.
Overview of results
As noted above, the key quantitative results of the Study are expressed in the form of elasticities and marginal products. An “elasticity” is generally defined as the ratio of the percentage change in one variable (e.g., GDP) to the percentage change in another variable (e.g., infrastructure investment) and is meant to measure the responsiveness of one variable to another in a ‘unitless’ way. The long-term elasticities in this Study measure the total percentage point changes in the economic variables for a long-term accumulated percentage point change in public infrastructure investment.
In turn, the long-term accumulated marginal products measure the dollar changes in the economic variables for each dollar of accumulated change in public infrastructure investment
The table below provides estimates of the economic impact of public infrastructure investment on GDP as measured through elasticities, marginal products and rates of return at the asset category level
| - | Elasticity of GDP with respect to infrastructure investment by asset category | Marginal Product of GDP with respect to infrastructure Investment by asset category | Implied rate of return by infrastructure asset category (30 year lifespan) | Implied rate of return by infrastructure asset category (50 year lifespan) |
|---|---|---|---|---|
| Government Administration and Other | 0.001 | $0.16 | - | - |
| Health | 0.113 | $23.46 | 11.1% | 6.5% |
| Highways, Roads, Bridges | -0.038 | -$3.78 | - | - |
| Education | 0.068 | $14.17 | 9.2% | 5.4% |
| Transit | 0.068 | $29.19 | 11.9% | 7.0% |
| Waste, water and wastewater | 0.019 | $8.29 | 7.3% | 4.3% |
Source: Alfredo Marvão Pereira and Rui Manuel Pereira, Department of Economics- The College of William and Mary
The effects of the different types of public infrastructure on output (as measured by elasticities) are positive, with the exception of Highways, Roads and Bridges, which is negative and Government Administration, which is rather small. The strongest effect on output is derived from investments in the infrastructure sectors of Health followed by Education, Transit, and Waste, Water, and Wastewater.
Marginal product figures can be considered a better measure (vis-à-vis elasticities alone) of the relative effects of different types of public infrastructure investments on output, because they reflect the relative scarcity of the different types of public investment at the margin of the sample period. The marginal products of output with respect to public infrastructure investment are computed using the ratio of GDP to the stock of capital and the ratio of the stock of capital to investment volumes over the past ten years. Infrastructure investment in Transit and Health infrastructure generate the highest marginal returns, followed by Education and Waste, Water and Wastewater. Investment in Government Administration infrastructure has a marginal product that is not statistically different from zero and investment in Highways has a negative marginal product. The interpretation of these results is discussed further in the following section.
Comparisons of results obtained in any study with the existing results in the relevant literature are always useful, although subject to important caveats around differences in data definitions and scope, methodologies used, jurisdictional context etc. For the purpose of this Study, we are well-positioned to compare the results for Ontario with the results developed in other jurisdictions by Pereira and his research team that have been published in the economics literature. Given the prior application of this methodology, we can compare the results obtained for Ontario with those developed by Pereira (2000) for the United States, the most widely cited and recognizable results.
The U.S. provides a comparison with an economy at a similar level of development and infrastructure scarcity as Ontario. Based on US data from 1956 to 1997, it is interesting to note that the directionality of sector-specific results is generally consistent. For example, for Transit, the U.S. elasticity of public infrastructure investment with respect to GDP is 0.021 (with a marginal product of $19.8) and Ontario’s corresponding value of 0.068 (with a marginal product of $29.2) are of the same order of magnitude. Transit effects are the largest of any of the asset types considered in the U.S., and are also the largest identified for Ontario. Similarly, the Highways, Roads and Bridges asset category generates the lowest elasticity and marginal products in both the U.S. and Ontario. For the U.S., a positive but low elasticity of 0.006 with a marginal product of $1.9 is estimated, while in the case of Ontario, the effect on GDP is marginally negative (elasticity of -0.038).
The comparisons above, which result in differential estimates between the U.S. and Ontario as would be expected, nevertheless are directionally consistent at the relevant comparable sector level.
Interpretation of results
In order to supplement the long-term quantitative results above, we utilized qualitative analysis and supporting research literature findings to further understand the long-term dynamics and impacts of infrastructure investment across sectors. The long term economic effects of infrastructure investment are to be found in how the services provided by the infrastructure impact various “channels”, namely, population, productivity and participation that drive economic growth in the long term, drawing upon the link between investment types and their effect on these channels.
In the context of this framework, productivity, population and participation are defined as follows:
- population: population growth, and the demographic structure of the population determine the size of the future working age population
- participation: the size of the future working age population combined with expected participation rates will determine the number of persons employed in the economy
- productivity: growth in the number of persons employed and growth in productivity ultimately determine the rate at which the economy will grow in the future
As illustrated in the graph below, the Transit, Health and Education sectors generate the highest marginal products with respect to output (GDP) among the asset categories considered in this Study, indicating that investments in these three sectors in particular have had the most significant impact on GDP growth in Ontario over the historical period assessed.
Estimated marginal products of GDP with respect to public infrastructure investment
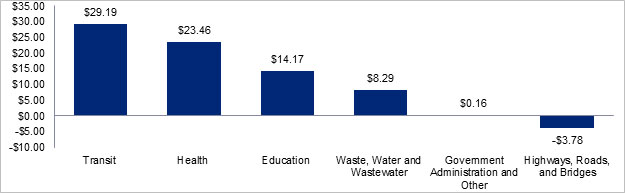
Source: Alfredo Marvão Pereira and Rui Manuel Pereira, Department of Economics- The College of William and Mary
The conceptual understanding of these results in terms of the expected effect of investment on the drivers of economic growth is summarized below for the highest impact categories (Transit, Health and Education) and the lowest impact category (Highways, Roads and Bridges):
- Transit: Investment in transit infrastructure (e.g., rapid transit systems) has the potential to positively impact population, participation and productivity in a number of ways. It helps in reducing traffic congestion and travel times thereby increasing time available for leisure and work activities and reducing lost productivity, in addition to increasing the reliability and safety of transportation. As well, investment can be expected to improve efficiency and accessibility to markets thereby increasing economic activity. It may also potentially serve as an economic development and site selection tool for new business development decisions. Transit infrastructure is also a particularly important form of infrastructure investment in a jurisdiction with a very high degree of urban concentration, as in the case of Ontario.
- Health: Investment in health infrastructure (e.g., hospitals) has the potential to impact population, participation and productivity by ultimately leading to improved health outcomes and its expected knock on effect on the economy. Investment in this sector would be expected to address a population’s growing healthcare needs and demand, drive efficiencies and cost savings within the healthcare system, assist in high quality job creation and potentially serve as an economic development and site selection tool in terms of encouraging businesses to locate in well-serviced areas. It should also be noted that the long term economic impact of health infrastructure investment would be expected to manifest over a potentially long period of time, as greater healthcare efficiencies or ultimately improved health outcomes resulting from improved facilities will be experienced over the course of several years after the investments in infrastructure are made.
- Education: Investment in education infrastructure (e.g., schools, colleges) and thereby the enhanced provision of educational services has the potential to positively impact population, participation and productivity by leading, in the longer term, to a more educated, competent, sophisticated, and knowledgeable and thereby more productive labor force – a human capital effect. The effects may be manifest through the greater provision of skills and training, an improved teaching environment, attracting population growth, potentially serving as an economic development and site selection tool and also facilitating the integration of modern information and learning technologies in education.
The positive elasticity and marginal product results estimated for Ontario for the Transit, Health and Education asset categories are thus consistent with the expected economic impact of investments in these sectors as described above. This is a pattern consistent with the mounting international evidence of the importance of human capital (driven by health and education sector investments) for long term economic performance. The results from this Study can be interpreted as providing high level directional guidance on prioritizing infrastructure sectors from an investment perspective based on historical performance. Thus a potential implication of these findings in terms of input into a forward-looking assessment is that continued emphasis on investment in these specific sectors may be viewed as beneficial to the long-term economic growth prospects of Ontario.
The negative results for the Highways, Roads and Bridges category warrant careful attention in ensuring they are interpreted appropriately. At a conceptual level, there are a number of potential drivers that may be expected to positively impact economic growth through impact of Highways, Roads and Bridges investment on population, participation and productivity, such as congestion reduction, improved accessibility and transportation efficiency and economic development effects. However, in considering the non-significant effect on GDP estimated in this Study in the context of conceptual economic understanding which would generally point to a positive relationship, additional factors may be at play that help to explain the direction of the results obtained in Ontario.
While it is possible that improved highway infrastructure will lead to greater private investment and output, it is also possible that improved highway provision leads to more efficient transportation services which can be accommodated with better equipment and less personnel. Additionally, Ontario is the largest exporting province in Canada, with high level of international trade with U.S. as well as interprovincial trade. This indicates the openness of the Ontario economy with strong links to other provinces and the U.S. and connectedness of its highway infrastructure with other jurisdictions. When demand for transportation services is driven by general patterns of interprovincial and international trade, as may be the case with an open economy as is Ontario, it is possible not to observe any positive output effects. The results found here for Ontario are consistent with evidence found for U.S. states which border the province found in Pereira (2012). In this context, regional spillovers are a particularly important consideration. Additionally, the level of infrastructure development may be a factor to consider as well. Given Ontario’s well-developed state of highway infrastructure, the results may indicate the presence of diminishing returns as the highway network has expanded over time, suggesting that continued maintenance and rehabilitation may have important impacts relative to further expansion in light of the maturity of the highway asset base in Ontario.
To be clear, the negative elasticity and marginal product for the sector does not imply that Ontario should be divesting its highways, but rather the opposite. It likely means that the road network in Ontario is sufficient at meeting transportation needs at the Province-wide level (if not necessarily regional) without significant incremental investments. The important point to note from Pereira (2012) is that ensuring that the network is well-integrated with Ontario’s neighbours is of utmost importance, and that benefits may accrue from expansion in other jurisdictions that may contribute to the economic impact of investments in Ontario.
Future infrastructure investment allocation
The Province has demonstrated its continued focus on investing in public infrastructure, particularly in areas that support economic growth and competitiveness. As the Province is expected to continue to commit significant funds to improve Ontario’s infrastructure beyond the current planning horizon, the need for a systematic investment allocation framework has been identified to assist in the investment decision making across infrastructure sectors. Clearly a comprehensive investment allocation framework requires the consideration of various factors that may include, for example, the stock and quality of current infrastructure assets, an assessment of future demand, needs and priorities, project level benefit-cost analysis etc. in addition to an assessment of historical investment performance.
As noted, this Study has developed a set of important findings using a tested methodology and rigorous quantitative analysis that may feed into the MOI’s investment allocation framework to support decision making. The findings provide an understanding of the economic impact of investments across infrastructure sectors in Ontario, and provide a historical perspective on the most productive investments across infrastructure sectors.
Specifically, the findings presented in the Study establish that public infrastructure investment in aggregate, as well as in most of the sectors considered have a positive impact on private investment, employment and output.
As the results from this Study have shown, investments in transit, health and educational infrastructure have had the most significant impact on GDP growth in Ontario over the period assessed. As noted, the results may be applied to provide high level directional guidance on prioritizing infrastructure sectors from an investment perspective based on historical performance, thus underscoring the continued emphasis on these specific sectors in future infrastructure investment plans as potentially beneficial to the long-term economic growth prospects of Ontario.
As a next step, further analysis of effects of infrastructure investment at the industry and regional level in Ontario as well as the interaction between investments in Ontario and the economic performance of neighbouring provinces and vice versa, may be pursued. This may be particularly important to achieve a more complete understanding of the effects of infrastructure investments, particularly for the highway infrastructure category. Further work may also be considered in analyzing sector-specific spending at a more disaggregated level that may consider breakdown between new infrastructure capital, maintenance/repair expenditures and capital refurbishment for example. This analysis would assist in understanding the potential economic impact of investments at a more detailed level of infrastructure spending, and would potentially further support and inform investment decision making across sectors at a more granular level based on the nature of investment.
Introduction
Background and study objectives
The Province of Ontario is served by a large, complex portfolio of public infrastructure with an estimated replacement value of nearly $400 billion
The Ontario Ministry of Infrastructure (the “Ministry” or “ MOI”) has conducted substantive analysis in understanding the impacts of infrastructure investment in Ontario. However, to date, there has been limited research and analysis examining the long-term economic impacts of investments across specific infrastructure sectors or asset categories in Ontario.
In this context, the Ministry requires a credible and quantitatively robust assessment of infrastructure investment impacts in Ontario across a range of asset categories that provides insight into the effects of historical infrastructure investment on the economic performance of the Province. It is expected that such analysis will assist the Ministry in its broader effort to develop an investment allocation framework across infrastructure sectors going forward. To assist in this process, the Ministry retained Deloitte LLP (“Deloitte”) to lead a study (“Study”) to examine the long-term quantitative economic impacts of Ontario’s infrastructure investment across a range of asset categories.
The key elements of the scope of this Study are illustrated in the figure below and described in more detail below.
Scope of study and overview of approach
The specific phases of the approach and methodology include the following:
- Conducting a review of data and key trends associated with historical infrastructure investment in Ontario and compiling a review of recent external analysis of the impacts of infrastructure investment in Ontario.
- Reviewing key strands in the research literature focused on assessing different analytical methods for estimating the economic impact of infrastructure investments, with the objective of identifying a preferred approach for estimating the long-term economic impact of infrastructure across asset categories in Ontario.
- Applying the selected methodology to Ontario infrastructure investment and economic data to develop reliable quantitative estimates of the long-term economic impact of infrastructure investment in Ontario at two levels:
- Effects of aggregate infrastructure investment in Ontario: The economic effects are measured in terms of elasticities and marginal products of infrastructure investment, whereby the long term accumulated effects of $1 of public infrastructure investment on output, employment and private investment are assessed.
- Effects of different types of infrastructure investment in Ontario: The economic effects are analyzed for different infrastructure investment asset categories thus allowing for the identification of which sectors or asset categories have been the most economically beneficial for the Province over the long-term amongst the following:
- Highways, Roads and Bridges
- Transit
- Education
- Health
- Waste, Water and Wastewater
- Government Administration and other infrastructure (including justice, public safety, and defence)
- Additionally, the quantitative results are augmented with a qualitative interpretation of the economic effects by exploring the conceptual link between investment across each identified infrastructure sector and resulting drivers of economic growth through impacts on productivity, population and participation growth.
- Summarizing the potential applicability of the Study findings and outlining key considerations in the development of future infrastructure investment allocation plans and discussing potential next steps.
Collectively, the analysis developed in this Study is intended to serve as an important input that feeds into the Ministry’s broader development of an investment allocation framework in support of future Provincial infrastructure investment decisions. It should be noted that a comprehensive allocation framework requires the consideration of many factors beyond historical investment impact analysis alone, including the stock and quality of current infrastructure assets, an assessment of future demand, needs and priorities, project level benefit-cost analysis, among other factors.
Structure of report
The balance of this Report presents the analysis of the various elements of the Study, organized as per the following sections:
- Infrastructure investment trends in Ontario (section 2) provides an overview of total and sector specific infrastructure investment trends and additional key metrics in Ontario
- Review of approaches to assess economic impact of infrastructure investments (section 3) provides a summary of existing research literature assessing the economic impact of infrastructure investments, including various approaches, methodologies, examples and results
- Long-term economic impact assessment of infrastructure investments in Ontario (section 4) describes the methodological approach and results of the quantitative and qualitative assessment of long term economic impacts of Ontario infrastructure investment across sectors
- Considerations for development of future infrastructure investment allocation plans (section 5) provides a summary of the potential application of the findings of this Study and a high level overview of additional parameters to be considered in developing infrastructure investment allocation plans going forward
Infrastructure investment trends in Ontario
Infrastructure investment overview
Figure 1: Total provincial infrastructure investment in Ontario, 2000-2013 ($ billions)
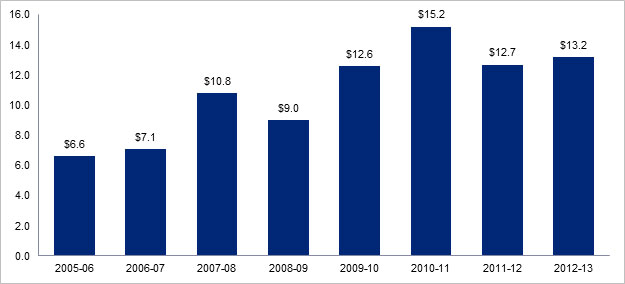
Source: Ontario Ministry of Infrastructure, Infrastructure Policy & Planning Division
Notes:
- Includes third-party contributions to capital investment (in consolidated schools, colleges, hospitals and provincial agencies), and federal government transfers for capital investments.
- Other includes investments in the water/environment sector, justice facilities, and municipal and local infrastructure.
- 2012-13 based on interim outlook forecast.
The following chart shows total investment infrastructure trends from 1961 to 2011 period, including public and private sector investment in publicly owned government administration, health, highways, roads and bridges, post-secondary education, schools, transit, waste, water and wastewater, and other infrastructure investment. In total, Ontario has invested some $515.5 billion in infrastructure from 1961 to 2011.
Figure 2: Total infrastructure investment in Ontario, 1961-2011 ($ billions)
Sources: Ontario Ministry of Infrastructure, Statistics Canada
Notes: These data are modeled, based on data from Statistics Canada that are survey-based and self-reported. Therefore, the responses are given from the perspective of the asset owner and may not correspond to Provincially-reported investments. Further, the definition of public infrastructure may not correspond to individual Provinces’ definitions.
Ontario’s mix of public infrastructure reflects public sector decisions dating back more than 100 years. The current portfolio has been particularly shaped by three distinct eras of investment, starting with the Second World War
1945-1970s: Post-war development period
Between the end of the Second World War in 1945 and the early 1970s, Ontario experienced rapid growth in its economy and population. Infrastructure investment responded to urgent new needs, triggered especially by the baby boom, and earlier shortfalls caused by the war and the Great Depression.
Public policy decisions during this period led to the development of new infrastructure, such as social housing, and also shifted existing infrastructure to public ownership. For example, the introduction of universal health care in the 1960s ultimately resulted in provincial responsibility for hospitals and other health care infrastructure.
This nearly three-decade-long infrastructure boom essentially created the core of Ontario’s current public infrastructure, including many elementary and secondary schools still in use, eleven new universities and the community college system, the two main lines of the Toronto subway system, key portions of the 400-series highway network, and health care infrastructure.
1970s-1990s: Underinvestment period
In the early 1970s, investments in public infrastructure began to decline sharply and remained low for more than two decades, failing to keep pace with either growth in population or gross domestic product. This was in part because government spending had shifted towards other priorities, and also a result of economic conditions. For example, the oil shocks of the 1970s and inflationary pressures of the 1980s both resulted in deferred investments in infrastructure.
These decades of neglect significantly eroded the quality of public infrastructure and its capacity to meet economic and social needs. By the end of the last century, Ontario had accumulated a significant infrastructure deficit, which was threatening its economic competitiveness and standard of living.
2000 onward: Current renewal period
In the past seven years in particular, investments in infrastructure have reached record levels not seen since the 1950s and 1960s. In 2005, the government released ReNew Ontario, a long-term infrastructure plan designed to invest $30 billion over five years. ReNew Ontario also aimed to introduce long-term predictability and sustainability to public infrastructure planning. ReNew Ontario was completed in 2008–09, and resulted in major investments in key infrastructure sectors, including transportation, health and education.
The government has also changed the way infrastructure projects are planned, financed, and managed. Starting in 2004, it took steps to standardize and improve procurement activity, including creating Infrastructure Ontario, a crown corporation guided by provincial capital plans, to build on the success of ReNew Ontario and the Province’s Building a Better Tomorrow framework.
Ontario has also built partnerships to address infrastructure challenges. In response to the global economic downturn, the Province collaborated with the federal government, Ontario municipalities and other stakeholders in 2009 to undertake major stimulus spending, through which nearly 11,000 projects were approved.
The figure below highlights the significant differences across these three eras as measured through the average annual change in per capita net public infrastructure stock over time.
Figure 3: Average annual change in per capita net Ontario public infrastructure stock, 1955-2009 ($ millions)
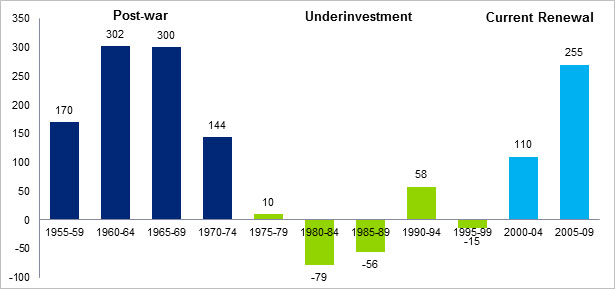
Source: Ontario Ministry of Infrastructure, Infrastructure Policy & Planning Division
Key metrics and trends
The following section presents various metrics and trends of Ontario’s total infrastructure investment, including infrastructure investment relative to GDP, infrastructure investment per capita, net public infrastructure stock per capita, year-end gross infrastructure stock and investment trends by sector.
Infrastructure investment relative to GDP
Economic history has shown that changes in infrastructure systems have often underpinned phases of significant economic growth
Figure 4: Total infrastructure investment in Ontario as a % of total GDP, 1961-2011
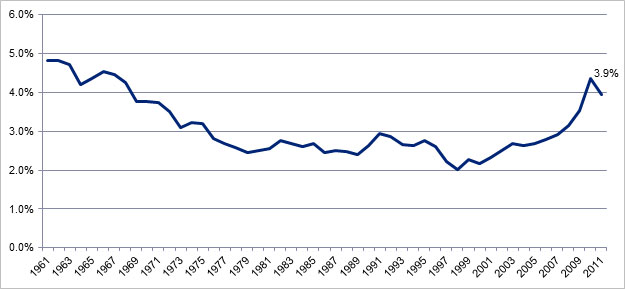
Sources: Ontario Ministry of Infrastructure, Statistics Canada
Notes: These data are modeled, based on data from Statistics Canada that are survey-based and self-reported. Therefore, the responses are given from the perspective of the asset owner and may not correspond to Provincially-reported investments. Further, the definition of public infrastructure may not correspond to individual Provinces’ definitions.
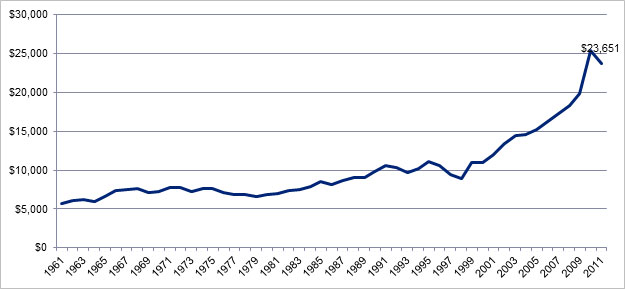
Infrastructure investment per capita
Infrastructure investment in Ontario has fluctuated near $1,000 per capita from the 1960s until 2001, after which infrastructure investment per capita began to rise, reaching $1,753 per capita in 2011. This represents the significant expansion in infrastructure spending over the last decade as discussed earlier.
Figure 5: Total infrastructure investment in Ontario per capita, 1961-2011
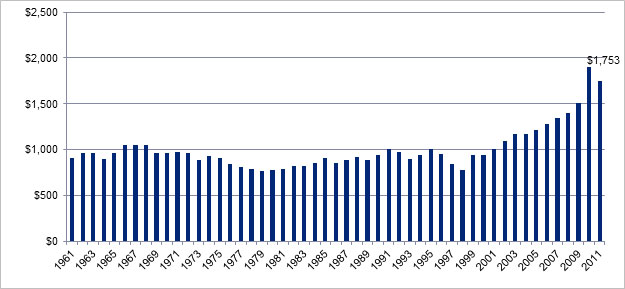
Sources: Ontario Ministry of Infrastructure, Statistics Canada
Notes: These data are modeled, based on data from Statistics Canada that are survey-based and self-reported. Therefore, the responses are given from the perspective of the asset owner and may not correspond to Provincially-reported investments. Further, the definition of public infrastructure may not correspond to individual Provinces’ definitions.
Year-end gross infrastructure stock
Ontario’s year-end gross stock of infrastructure has been on the continuous rise from 1961 to 2011, totalling $387.3 billion by 2011.
Figure 6: Total infrastructure investment in Ontario year-end gross stock, 1961-2011($ millions)
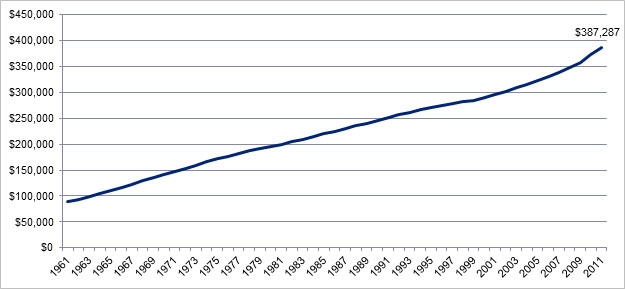
Sources: Ontario Ministry of Infrastructure, Statistics Canada
Notes: These data are modeled, based on data from Statistics Canada that are survey-based and self-reported. Therefore, the responses are given from the perspective of the asset owner and may not correspond to Provincially-reported investments. Further, the definition of public infrastructure may not correspond to individual Provinces’ definitions.
Investment trends by sector
Generally, infrastructure investment across specific sectors has followed a similar pattern, steadily growing from 1961 to the late 1990s, followed by significant increase across the 2000s. After peaking in 2010, total investment in 2011 in Ontario’s Highways, Roads and Bridges totaled nearly $8.0 billion, followed by $5.1 billion in Government Administration, $3.1 billion in Education, $3.1 billion in Health, $2.4 billion in Transit, and $1.8 billion in Waste, Water and Wastewater
Infrastructure investment in Highways, Roads and Bridges reached its highest share of total investment in infrastructure during the 1970s, reaching nearly 41.3% of the total. Since that time, the importance of investment in highways, roads and bridges has been steadily declining in a manner consistent with the fact that Ontario currently possesses a well-developed road infrastructure network. In contrast, after a substantial decline during the 1970s, investment in Education infrastructure has been growing in importance from a minimum of 11.3% of total investment during the 1980s to 16.3% of total public investment in infrastructure between 2000 and 2009. The remaining categories of infrastructure investment present no clear trend, although Health infrastructure has reached its largest share of the total since 2000, accounting for 16% of total infrastructure investment.
Figure 7: Total infrastructure investment in Ontario by sector / asset, 1961-2011 ($ millions)
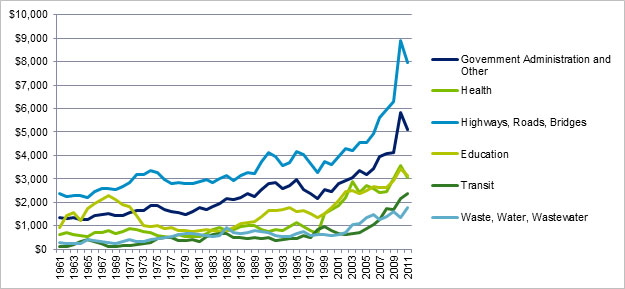
Sources: Ontario Ministry of Infrastructure, Statistics Canada
Notes: These data are modeled, based on data from Statistics Canada that are survey-based and self-reported. Therefore, the responses are given from the perspective of the asset owner and may not correspond to Provincially-reported investments. Further, the definition of public infrastructure may not correspond to individual Provinces’ definitions.
With respect to historical investment allocation across infrastructure sectors, Ontario has typically invested a relatively high portion of total investment in highways, roads and bridges (34% of total investment in 2011), followed by government administration (22%), education (13%), health (13%), transit (10%) and waste, water and wastewater (8%).
Figure 8: Total infrastructure investment in Ontario by sector / asset, 1961-2011 (% proportion of total infrastructure investment)
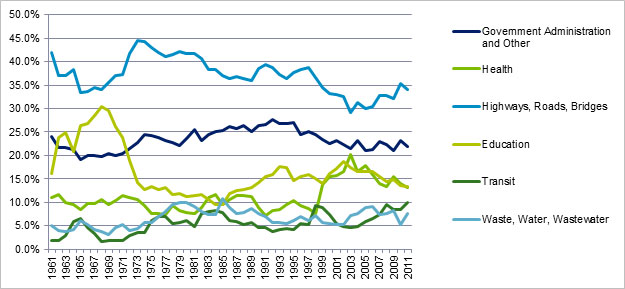
Sources: Ontario Ministry of Infrastructure, Statistics Canada
Notes: These data are modeled, based on data from Statistics Canada that are survey-based and self-reported. Therefore, the responses are given from the perspective of the asset owner and may not correspond to Provincially-reported investments. Further, the definition of public infrastructure may not correspond to individual Provinces’ definitions.
Figure 9: Total Ontario infrastructure year-end gross stock by sector / asset, 1961-2011($ millions)
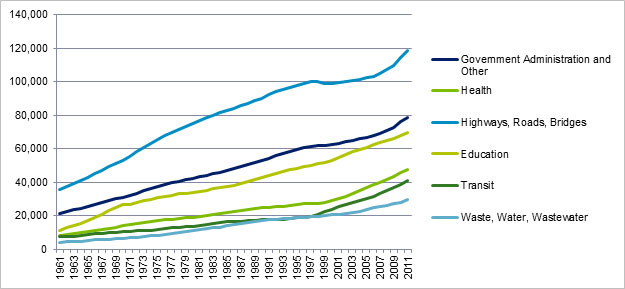
Sources: Ontario Ministry of Infrastructure, Statistics Canada
Notes: These data are modeled, based on data from Statistics Canada that are survey-based and self-reported. Therefore, the responses are given from the perspective of the asset owner and may not correspond to Provincially-reported investments. Further, the definition of public infrastructure may not correspond to individual Provinces’ definitions.
Recent economic impact studies of Ontario’s infrastructure investments
In light of Ontario’s significant increase in infrastructure investment, there has been a range of research and analysis conducted on the economic impact of these investments in recent years. The following section highlights the approaches and findings of four recent Ontario-specific studies which explore the economic impact of provincial infrastructure investments.
Conference Board of Canada, “The Economic Impact of Public Infrastructure in Ontario” (2010)
Background
The Conference Board of Canada (the “Conference Board”) started working with Infrastructure Ontario to assess the economic contribution of Ontario’s infrastructure investment program, ReNew Ontario. In this study, quantitative methods identified through a literature review are used to assess the impact of infrastructure on Ontario’s labour productivity, and an economic impact analysis is conducted to examine the impact that ReNew Ontario is having on employment and output associated with the construction phase of the program.
Approach and methodology
Total factor productivity
The Conference Board uses a growth accounting approach to examine the extent to which investments in public infrastructure have helped drive private sector productivity, output, and competitiveness in Ontario. The contribution is quantified by splitting public capital out from total factor productivity (“TFP”).
TFP is essentially a driver of economic prosperity. According to this study, positive TFP growth contributes, one for one, to overall GDP growth and labour productivity and remains a key long-term driver of competitiveness and real per capita income. Public infrastructure also contributes to output and labour productivity by adding to the stock of capital per worker. Thus, by using the production function framework and accounting for public infrastructure separately from the estimate of TFP, it is possible to account for the contribution of public infrastructure to labour productivity.
Aggregate infrastructure investment shock
As a second set of analyses, aggregate infrastructure investment data were used to “shock” the Conference Board’s provincial economic model of Ontario, and identify the effect the infrastructure spending has had on Ontario’s economy. The model simulations were performed for the years 2006 to 2010. The shock to the Conference Board’s Ontario economic model was to real public construction investment and real public M&E capital outlays. The government construction and M&E deflators from Statistics Canada’s Provincial Economics Account were used to deflate the public investment data.
Results
Total factor productivity
The Conference Board finds that public capital has been a strong contributor to private sector performance in Ontario
| - | 1980–89 | 1990–99 | 2000–08 | 1980–08 |
|---|---|---|---|---|
| Labour productivity | 1.39 | 2.03 | 0.93 | 1.47 |
| Business capital contribution | 0.63 | 0.61 | -0.01 | 0.43 |
| Labour composition contribution |
0.00 | -0.04 | -0.13 | -0.05 |
| Total factor productivity (TFP) | 0.76 | 1.46 | 1.07 | 1.10 |
| Public capital contribution | 0.16 | 0.16 | 0.23 | 0.18 |
| TFP net of public capital | 0.60 | 1.30 | 0.84 | 0.92 |
Source: The Conference Board of Canada, 2010
The public capital contribution to labour productivity has been relatively constant over the past 30 years, averaging 0.2% per year. However public capital had a larger impact on labour productivity in the 2000s than in other decades: it accounted for 24% of labour productivity growth in the 2000s, compared with only 8% in the 1990s, when budget balancing resulted in fewer funds for infrastructure. While public infrastructure programs such as Move Ontario and ReNew Ontario contributed to this larger share, so did the significant decline in the contributions from business capital and labour intensity.
Aggregate infrastructure investment shock
In real terms, the cumulative $53.6 billion in public infrastructure spending generates a total of $59.3 billion in real GDP over 2006 to 2010. In other words, each dollar of real public infrastructure spending generates $1.11 in real GDP. Over the same period, a total of 822,335 person-years of employment are created in the province, with annual job creation expected to peak in 2010 with over 223,000 jobs supported, when the unemployment rate edges down 1.3 percentage points.
| Investment | 2006 | 2007 | 2008 | 2009 | 2010 | Total |
|---|---|---|---|---|---|---|
| Total investment generated ($M) | 6,753 | 9,451 | 8,476 | 13,931 | 17,934 | 56,545 |
| Total investment generated (2002 $M) | 6,644 | 9,164 | 8,011 | 13,061 | 16,677 | 53,557 |
| Effects | 2006 | 2007 | 2008 | 2009 | 2010 | Total |
|---|---|---|---|---|---|---|
| Real GDP at market prices (2002 $M) | 10,328 | 11,619 | 8,375 | 13,150 | 15,819 | 59,292 |
| Personal income ($M) | 7,798 | 8,223 | 7,364 | 11,342 | 13,975 | 48,701 |
| Labour force | 86,682 | 98,077 | 69,724 | 113,917 | 138,849 | 507,248 |
| Employment (person-years of employment) | 141,855 | 160,487 | 113,827 | 182,897 | 223,268 | 822,335 |
| Unemployment rate (difference in percentage points) | -0.86 | -0.96 | -0.67 | -1.07 | -1.29 | - |
| Retail sales ($M) | 2,268 | 4,636 | 5,946 | 7,418 | 9,052 | 29,320 |
| Housing starts | 3,863 | 9,289 | 2,546 | 8,935 | 9,397 | 34,031 |
| Total indirect taxes ($M) | 423 | 784 | 1,062 | 926 | 1,084 | 4,280 |
| Federal personal income tax collections ($M) | 793 | 901 | 811 | 1,248 | 1,538 | 5,291 |
| Provincial personal income tax collections ($M) | 472 | 485 | 426 | 656 | 809 | 2,847 |
| Corporate profits ($M) | 1,055 | 2,566 | 1,547 | 2,485 | 2,633 | 10,286 |
Source: The Conference Board of Canada, 2010
Capital investment spending from the ReNew Ontario program is also estimated to lift personal income by a cumulative $48.7 billion from 2006 to 2010 and add $10.3 billion to corporate profits. Personal income and indirect tax collections are lifted by a cumulative $12.4 billion: 43% accrued to federal coffers, 23% to the province, and the remainder due to a lift in indirect taxes collected by both levels of government.
On a calendar-year basis, the level of infrastructure investment rises by $5 billion in 2009 and a further $3.6 billion in 2010. This boost to infrastructure spending helps lift real GDP growth by 0.9 percentage points in 2009 and a further 0.4 percentage points in 2010. Additionally, if not for the stimulative impact of the increase in public investment, Ontario’s economy would have lost an additional 70,000 jobs in 2009.
Conference Board of Canada, “The Economic Impact of Ontario’s Investment Program” (2013)
Approach and methodology
This paper directly follows the previous study, providing updates to assess the contribution of Ontario’s infrastructure investment program to the province’s economy. As in the original 2010 study, a total factor productivity measure is utilized, and aggregate infrastructure investment data was used to “shock” the Conference Board’s provincial economic model of Ontario. The model simulations were performed over the 2006 to 2014 period.
Results
The range of increases in real productivity capacity lies between 1.1% and 2.6% in 2012, with the range increasing to 1.2% to 3.0% in 2014. At a minimum, the average Ontarian is earning $536 more per year today because of investments in infrastructure that occurred from 2006 to 2012. If investments progress as planned through to 2014, the minimum benefit grows to $620 per person in 2014 (in constant 2012 dollars).
Cumulative infrastructure spending will total an estimated $96.7 billion, in current dollars, from 2006 to 2014. In real 2002 dollars, the cumulative value of the past and planned investment will be an estimated $89.7 billion, with $39.9 billion toward structures and $49.8 billion toward machinery and equipment
For every $100 million (inflation-adjusted) invested in public infrastructure, real GDP is boosted by $114 million and roughly 1,670 person-years of employment are supported. In other words, for each $100 million of public infrastructure investment, about 1,670 jobs will be created for one year.
RiskAnalytica, “Public Infrastructure Investment in Ontario” (2011)
Background
The Residential and Civil Construction Alliance of Ontario (“RCCAO”) commissioned this study developed by RiskAnalytica, which combines a look at the positive impacts infrastructure investment has on GDP and the economy as well as a look at the potential negative impacts that may result from insufficient infrastructure spending
Approach and methodology
To address this analysis, RiskAnalytica first established a demographic model which considers four primary processes: birth, death, migration, and aging. Historically observed trends, such as decreasing mortality rates, are also preserved in the model. The second key component is the economic model, which is integrated with the demographic component through detailed modelling of the labour force. The basis of the economic production model is a Cobb-Douglas function which relates the total economic production to the labour capital, private capital and public capital stocks. The elasticities of production, used in this study are sourced from Macdonald (2008)
Results
This study finds Ontario’s 10-year Building Together infrastructure plan to be a step toward increasing the economic potential of the province. However, there is still additional room for further infrastructure investment from the current levels of 3% of provincial GDP to up to 5% of provincial GDP before the marginal returns disappear.
In parallel with increasing the level of overall infrastructure investment, it is recommended that the allocation to maintenance of existing infrastructure should be increased significantly, by up to 22% of total infrastructure investment. Ontario has historically spent 12% of total infrastructure investment on maintenance, which is well below the Canadian average. Relative to the recent trend in infrastructure investment, the anticipated increase in infrastructure investment and maintenance is estimated to:
- increase after-tax wages by almost 60%, with those entering the work force today having the equivalent of more than $400,000 real wages earned by age 65
- increase net profits after tax by almost 30%, equivalent to a 0.7% annual increase
- increase employment by over 12 million person-years
- result in an additional $7 trillion in cumulative government revenue while costing only $1.5 trillion (over the 50 years)
Haider et al., “Investing in Ontario’s Infrastructure for Economic Growth and Prosperity” (2013)
Background
The RCCAO commissioned another study by Haider, Crowley and DiFrancesco, to explore the potential benefits, costs, and risks associated with investing in public infrastructure to address the adverse economic impacts of recession
- Any investment in critical infrastructure will add to the productive capacity of the economic engine. Thus, when the demand for goods and services starts to increase, the newly added capacity, brought about in part by investments in infrastructure, will sustain and promote continued economic growth.
- Infrastructure development during recessions creates job opportunities at a time when lack of investment and/or expansion by the private sector results in either no new job creation or worse, and, more likely in the emerging context, job losses.
Approach and methodology
In order to address the above areas, this study simulates the impact of infrastructure investments in Ontario using an input-output (IO) model to determine the multiplier effects of infrastructure investments in the socio-economic spheres of Ontario, economy based on a 2008 industry structure.
Results
Using an input-output model of the Ontario economy based on a 2008 industry structure, the simulation exercise estimated the economic impact of a $12 billion public sector investment in non-residential building and engineering construction in Ontario. This infrastructure investment is estimated to have a $38.4-billion impact on the province’s economy. The $12 billion investment would create an estimated 203,000 jobs (person-years of employment) in the provincial economy, generate an estimated $10 billion in employment income and increase the provincial GDP by an estimated $18.5 billion. This investment would also generate an estimated $668.7 million in corporate taxes and $161.2 million in personal income taxes.
These benefits are in addition to the longer term direct benefits of infrastructure investments that would result from the use of new or rehabilitated infrastructure. For instance, a $12 billion investment in transportation infrastructure could result in a significant improvement in accessibility and mobility in the region, and related improvements in labour and business productivity. The monetized impacts of infrastructure investments, however, include more than the positive impacts on accessibility and productivity.
Summary
It is noted that while each study discussed above has made a significant positive contribution to developing a better understanding of the economic effects of infrastructure investments in Ontario, the research conducted to date has not provided a comprehensive assessment of the economic impact of historical investments over a long term horizon nor at the asset category or infrastructure sector level that is the focus of this Study.
Review of approaches to assess economic impact of infrastructure investments
Overview
The subject of public infrastructure and its many implications has prompted the development of an extensive, growing collection of economic research literature in this field. The emerging consensus in many such studies is that public infrastructure contributes to economic growth, and this finding appears stronger in more recent literature. However, there exists relatively limited research and analysis examining the economic impacts of investments across different infrastructure sectors or asset categories in the literature.
Summary of key approaches and methodologies
The following section explores existing research assessing the economic impact of investments in public infrastructure, including various approaches and methodologies utilized and the nature and type of results of several research studies found in the literature. This review represents a summary of various other recent literature reviews and related commentary, as conducted in the following studies:
- Infrastructure Analytics Group - Ontario Ministry of Infrastructure ( MOI), “Optimal Investment in Public Infrastructure in Ontario” (2012)
- The College of William and Mary – Thomas Jefferson Program in Public Policy, “The Economic Impact and Financing of Infrastructure Spending” (2012)
- Residential and Civil Construction Alliance of Ontario – Haider, Crowley and DiFrancesco, “Investing in Ontario’s Infrastructure for Economic Growth and Prosperity” (2013)
Single‐equation model studiesfootnote 13
The standard single‐equation model is an expansion of the typical aggregate production function of private capital and employment, to include public capital and interpret the coefficient as an output elasticity of public capital
Application of single‐equation models include work completed by Aschauer (1989), Munnell (1990), Evans and Karra (1994), Wylie (1996), Nourzad (1998), Paul, Sahni and Biswal (2004), Macdonald (2008), Brox (2008) and Gu and MacDonald (2009)
Some of the key results of these studies include the following:
- Output elasticity of public capital is estimated to be in the range of 0.15 to 0.56 (i.e., $100 spent on public capital increases output by $15‐$56) - Aschauer (1989), Wylie (1996), Munnell (1990)
- Public capital productivity exceeds that of private capital - Aschauer (1989), Wylie (1996)
- Public capital generates a rate of return in the range of approximately 5% to 29% - Paul, Sahni and Biswal (2004), Macdonald (2008), Brox (2008)
As noted in the MOI study cited above, single‐equation models are widely used in public infrastructure studies due to their simplicity, reduced data requirements, and straightforward interpretation. However, their estimates are sometimes found to be on the high side and biased. Their static nature does not account for simultaneity between variables which yields estimates that are unclear about the causality between output and capital. Some studies avoid the problem by estimating public capital sector by sector, assuming that firms do not “cause” public infrastructure.
In spite of such criticism, single‐equation studies tend to demonstrate the positive role of public capital and provide key policy information: the marginal effect of increasing public infrastructure when everything else is held constant. However, other approaches such as theory‐based Endogenous Growth models and Vector Autoregressive (VAR) model are considered to address some of the issues noted above.
Endogenous growth modelsfootnote 15
In growth theory, certain variables are interconnected with economic growth, including savings rates, the level of investment, and population growth. This approach can be used to investigate how much government should spend on public infrastructure to maximize GDP per capita based on the implication that one can choose a level of public capital to obtain the most cost‐effective and achievable total effects (direct and indirect) on output. The underlying idea is based on the nonlinear relationship between public capital and economic growth – which implies a rationality of optimization – where the output elasticity is highest at the growth‐maximizing level of public capital.
Conceptually, the policy rule in growth models implies an optimally stationary equilibrium where the efficient share of public investment can be expressed as a fraction of total output (Barro, 1990). Here, capital, labour and other drivers of economic growth are considered internal to the economic system. The result is that an increase in savings rates in public capital will increase the steady‐state growth rate (permanent income per capita), with elasticity approximately equal to the elasticity of public capital in the aggregate production function.
Application of endogenous growth models include work completed by Barro (1990), Easterly and Rebelo (1993), Devarajan et al. (1996), Aschauer (1998), Sartre and Soares (2003), Bond et al. (2004), Gosh and Roy (2004), Irmen and Kuehnel (2008), RCCAO (2010), and Fosu, et. al. (2011).
Some of the key results of these studies include the following:
- Public capital investment is a necessary condition for growth to reach steady state - Irmen and Kuehnel (2008), and an increase in investment as a share of GDP predicts a higher growth rate of output per worker, both temporarily, and in the steady state - Bond et al. (2004)
- Suggested public investment to Gross Domestic Product ratios of 5% up to 13% - Barro (1990), RiskAnalytica (2010), Fosu, et. al. (2011)
- The growth‐maximizing ratio of public on capital stock yields elasticity of 61% that he called optimal ratio of public to private capital
footnote 16 - Aschauer (1998) - Sartre and Soares (2003) observed that the optimal share of public investment should equal the government capital elasticity of output
An endogenous growth framework appears to be a comprehensive method for analyzing the economy‐wide impacts of public infrastructure. Traditionally, growth theory assumes a balanced government budget, meaning that expenditures on public infrastructure are paid with tax revenues. However, few studies have examined the cases of deficit‐financed government capital spending, and those which did found that public debt crowds out public investment (i.e. Heinemann (2002); Gong et al. (2001)).
Input-output models
There are multiple sets of input-output (IO) multipliers available for use in analyses of the short-run impact of specific spending. The most popular measures provide local or county-level detail, and allow for large multi-sector analyses of geographic and regional impacts. These multipliers are used primarily in local-focused studies, as seen in Krop et al. (2008), Weinstein and Clower (2007), and Wubneh (2008).
The academic literature on the use of input-output analysis to determine short-run impacts notes some points of caution. For example, Zaman et al. (2010) discusses the time stability of input-output findings, and confirms that technical input-output coefficients are valid and consistent in both the short- and medium-run, but not to exceed roughly five years’ time.
Cohen et al. (2012) contend that because input-output models are typically calculated in a closed model with no feedback from price effects and the financial sector, their estimates are biased upward in terms of describing the ultimate economic effect of infrastructure spending. This is a major criticism of input-output models, and partially the reason why such findings can describe only the temporary impact of spending rather than the long-run permanent effects. Without taking into account greater macroeconomic conditions and dynamic relationships between economic output and public investment whereby changes in each variable are both caused by and the causing variation in the other, the consistency of input-output findings should be taken with significant caution
In light of these criticisms, it is apparent that input-output models cannot determine the permanent long-run effects of public infrastructure investment. However, these models are sometimes considered valuable to policymakers as a first step toward understanding these effects. The shortcomings of input-output models in describing lasting and robust effects are best overcome by the long-run vector autoregression (VAR) approach discussed next.
Vector autoregressive (VAR) modelsfootnote 20
A VAR model is considered to be sufficiently able to account for the multiple feedback loops involved in public infrastructure spending, output, and GDP. The VAR approach assumes the relationships between variables are not based on economic theory but on their relational specificities and variables can be ordered in an ad hoc manner. In the VAR approach the modeller is required to identify the variables that are believed to be interacting in the economy and select a number of lags significant enough to capture the effects that the variables have on each other. Given that VAR does not depend on a fully specified structural model, it is suitable for examining the impulse responses of public capital in the economy without any preconceptions.
VAR impulse‐response functions reveal the long‐run effects of shocks to the different variables in the system, provided they are stationary or co‐integrated. Since the VAR model specifies the correlations between realizations of the variables, it is natural and considered easy to use for forecasting purposes, with the knowledge of current and past values of the variables required. This is in contrast to other common econometric forecasting scenarios, where current values of other variables are included on the right-hand side of equations, meaning that before a one-period ahead forecast can be made, it is necessary to have the one-period ahead estimates for the other variables.
Application of VAR models include work completed by Erenburg and Wohar (1995), Otto and Voss (1996), Voss (2000), Mittnik and Neumann (2001), Pereira and Roca‐Sagales (2001), and Kamps (2004).
Some of the key results of these studies include the following:
- Mixed findings in terms of evidence of the presence of crowding-in or feedback effects between public and private investment - Erenburg and Wohar (1995), Voss (2000), Pereira and Roca‐Sagales (2001)
- Positive long‐run elasticities or output effect of public capital, typically smaller than those reported in the production function approach - Otto and Voss (1996), Mittnik and Neumann (2001), Pereira and Roca‐Sagales (2001), Kamps (2004)
As noted in Cohen et al (2012), the key advantage of the VAR approach is that the time-series method allows for the possibility of dynamic feedback effects (i.e., back and forth effects between public capital and private output). It does not impose an a priori restriction on the dynamic relationship, meaning it accounts for observed feedback in its estimates of the elasticity of GDP to public capital.
Summary
The subject of public infrastructure and its many implications has prompted the development of an extensive, growing collection of literature. Based on the literature reviewed above, it is evident that infrastructure investments are strongly linked to economic activity and growth. The primary methodologies observed in these studies include:
- Single‐equation production function models
- Endogenous growth models
- Input-Output models
- Vector Autoregressive (VAR) models
There are a number of challenges associated with each of these methods. For example, single‐equation models are found to be associated with high and biased estimates and their static nature does not account for simultaneity between variables, thus yielding estimates that are unclear about the causality between output and capital. Various authors find that input-output analysis is valid for use in the short to medium term, but is not appropriate for capturing long-term effects.
There is some consensus that the VAR approach is a potentially robust method in assessing the long-term relationship between public capital and private output as a VAR model can sufficiently account for the multiple feedback loops involved in public infrastructure spending, output, and GDP. Cohen et al. (2012) and others note that while the single-equation production function has traditionally been the most commonly used approach in this literature, the use of the VAR approach has grown in popularity in recent years as a more sophisticated analytical method.
Sector-specific studies
As the previous section has shown, a range of methodologies have been adopted to address the impacts of infrastructure investment on an aggregate basis. However, far less focus has been given to investigating the impacts by asset category or infrastructure sector level.
Cohen et al (2012) conducted an extensive literature review to identify findings regarding sector level infrastructure investment impact analysis. They found that several of the research papers that assessed infrastructure investment at the asset category level studied some form of highway spending and to a lesser extent, water and wastewater, but very few studies looked at multiple sectors. Pereira (2000) was an example of such a study that looked at a broad spectrum of asset categories, assessing the economic impact of investment in the United States as measured through elasticities of output relative to investment across a number of sectors that included highways and streets; electric power generation or gas fired power generation and mass transit systems; sewage and water treatment facilities; public buildings; and conservation and development structures.
The following table highlights findings of elasticity by sector, and confirms that Pereira’s research work is one of very few studies that examined economic impacts across a number of sectors. It can be noted from the table that most elasticities across sectors were found to be positive, with the exception of highways, roads and bridges – which yielded negative elasticities in some cases.
| - | Eberts, R. (1986) | Deno, K. (1988) | Aschauer, D. (1989) | Munnell, A. & L. Cook (1990) | Dalenbar, D.R. & R.W. Eberts (1992) | Finn, M. (1993) | Evans, P. & G. Karras (1994) | Moomaw Mullen & M. Williams (1985) | Garcia Mila, T., T. McGuire & R Porter (1986) | Kelejian, H. & D. Robison (1987) | Attaray, E. (1998) | Batina, R. G. (1998) | Pereira, A. (2000) |
|---|---|---|---|---|---|---|---|---|---|---|---|---|---|
| Aggregate | .04 | 0.69 | 0.38-0.56 | 0.15 | - | - | (-0.223)( to 0.102 | 0.07 to 0.26 | - | (-0.102) to 0.145 | - | (-0.11) VAR to 0.022 | 0.043 |
| Highways, roads, bridges | 0.03 | 0.31 | 0.24 | 0.06 | 0.104-0.149 | 0.16 | -0.062 | 0.001 to 0.027 | 0.230 to 0.370 | (-1.93) to 0.101 | 0.25 | (VECM) | 0.006 |
| Water and wastewater systems | 0.08 | 0.12 | - | 0.011 | 0.003 to 0.3045 | 0.043 to 0.069 | (-0.031) to 0.147 | - | 0.024 | 0.009 | |||
| Transit | - | - | - | - | - | - | - | - | - | - | - | 0.021 | |
| Health | - | - | 0.02 | - | - | - | - | - | - | - | - | - | 0.017 |
Long-term economic impact assessment of infrastructure investments in Ontario
Background
Alfredo Pereira, a Professor at the College of William and Mary in Williamsburg, Virginia has published a number of economic papers investigating the economic impact of infrastructure investments across different infrastructure types or asset categories. For example, he developed an analysis of infrastructure investments across various sectors in the United States in his paper, “Is All Public Capital Created Equal?” (2000), published in the Review of Economics and Statistics. The findings from this work were used in a recent research study “The Economic Impact and Financing of Infrastructure Spending” (2012), prepared by Cohen, Freiling and Robinson for the Associated Equipment Distributors (AED) to assess the long-term impact of government spending on infrastructure in the United States. Pereira has applied a similar methodology to study the effects of infrastructure investment in other countries, notably Spain and Portugal.
The objective of Pereira’s research in this field is to understand the long-term effects of public infrastructure spending on the economy. As noted in the previous section, in addition to applying a VAR methodology that is well-accepted in the literature, Pereira is one of few researchers in recent years who has looked beyond impacts at the aggregate level and quantified the effect of infrastructure investment in various sectors on the economy. Pereira’s approach produces an econometric determination of the long-run sensitivity of GDP to investment for each sector, identifying a numerical value which captures the dynamic effects that GDP and investment spending each have on the other.
In light of the review of various methodologies applied in the assessment of long term impacts of infrastructure investment as described in the previous section, it was concluded that Pereira’s methodology offers an appropriate approach to meet the scope requirements of the Study, particularly given its explicit emphasis on the assessment of impacts at the asset category or sector level.
Pereira’s approach offers a credible and proven means through which these long-run effects can be estimated at the sector level. Deloitte engaged Professor Pereira as a sub-consultant to develop the quantitative analysis leveraging his methodology and modeling expertise to apply to Ontario data. Key elements of the methodology, data, testing procedures and results are contained in the following sections.
Approach and methodology
Quantitative analysis
Introduction to VAR approach
The following approach considers the analysis of the impact of public infrastructure investment on economic performance in Ontario, first at the aggregate level, and then considering different asset categories or sectors. The objective of this analysis is to produce elasticities of output, employment, and private investment with respect to public infrastructure investments, and more importantly from a policy perspective, the marginal productivities of public infrastructure investment when considering the observed levels of relative infrastructure scarcity.
This approach utilizes a multivariate dynamic time series methodological approach, based on the use of VAR models, developed in Pereira and Flores (1999) and Pereira (2000, 2001). This methodology has been subsequently applied to, among others, the United States in Pereira and Andraz (2003, 2004), to Portugal in Pereira and Andraz (2005, 2006), and to Spain in Pereira and Roca-Sagales (2003), for example.
This econometric approach addresses the criticisms leveled against the univariate static production function approach conventionally used in the literature – the challenge of the endogeneity of all variables, the absence of a dynamic element, and the inability to establish causation – in a rigorous and comprehensive manner. It also brings a more precise conceptual focus to the debate about whether or not infrastructure capital is productive and how productive it is.
The approach is directed to highlight the dynamic nature of the relationship between infrastructure and the economy. It does so at three distinct levels: first, by addressing explicitly contemporaneous correlations among innovations; second, by considering an intertemporal feedback structure among all variables; and, third, by accommodating the possibility of existence of long-term relationships among the variables. Built into the approach is the ability to determine causality and not only correlations.
Dynamic feedbacks are essential to a conceptual understanding of the relationship between public infrastructure capital and economic performance. Public infrastructure affects output directly as an additional input in the production function. As positive externalities to production, public infrastructure should, all other things being equal, lead to higher production. Public infrastructure also affects production indirectly through effects on capital and labour. It is conceivable that a greater availability of public infrastructure could reduce the demand for inputs (a substitution effect). More public infrastructure, however, also increases the marginal productivity of these inputs, lowering the marginal costs of production, thereby potentially increasing production (a scale effect).
The evolution of inputs and outputs can, in turn, be expected to affect public infrastructure investment. Increasing output provides the government with a growing tax base and the potential for greater investment. Furthermore, declining employment has often led to short-term policy packages that involve increased public infrastructure investment. Therefore there is a significant possibility that reverse causality exists, meaning that it is possible that output and other inputs may be leading to growth in public infrastructure investment and not (or not only) the other way around.
Finally, although this approach is eminently empirical, it is not theoretical, as this analysis is supported by a dynamic model of the economy. In this model, the economy uses a production technology based on the use of capital and labour, as well as public infrastructure capital, to generate output. Given the market conditions and the availability of public infrastructure, the economy decides on the level of input demands and output supply. In turn, the public sector decides on the evolution of the public infrastructure investment using a policy rule that relates public infrastructure to the evolution of the economic variables. The estimated VAR models can be thought of as a reduced form for the production function, input demands and policy function.
Data sources and description
The data utilized within this analysis includes annual data for the period 1976 to 2011, obtained from Statistics Canada. Gross Domestic Product (“gdp”), private investment (“inv”), and public investment (“pinv”) are in millions of constant 2007 Canadian dollars while employment (“emp”) is noted in thousands of employees. The data for private and public investment is sourced from Infrastructure Analytics Group of the Infrastructure Policy and Planning Division of the MOI, based on Statistics Canada data.
In addition to aggregate public infrastructure investment, six different sectors of public infrastructure investment are considered:
- Government Administration and Other Infrastructure (“pinv1”) - includes investments in public administration buildings and also includes a small residual component of public infrastructure investment. It represents 24.5% of public infrastructure investment over the sample period and peaked in the 1990s with 26.2% of the total.
- Health Infrastructure (“pinv2”) - includes fixed non-residential capital investment for ambulatory health care services, hospitals, and nursing and residential care facilities. It represents 11.4% of public infrastructure investment and has seen a sharp increase in the last decade.
- Highways, Roads and Bridges Infrastructure (“pinv3”)
footnote 18 – includes investments in roadway infrastructure including highways, roads and bridges and accounts for 36.2% of public infrastructure investment and peaked at 41.3% in the 1970s. - Education Infrastructure (“pinv4”) - includes investment in fixed assets by elementary and secondary schools, community colleges, universities, business schools and computer and management training centres, technical and trade schools, other schools and institutions and educational support services. It represents 14.1% of total infrastructure investment. It declined to an all-time low of 11.3% in the 1980s and rebounded thereafter.
- Transit Infrastructure (“pinv5”) - includes transit and other ground passenger transportation services. It has sharply increased from 3.4% to 6.5% of total public infrastructure investment for a sample average of 6.3%.
- Waste, Water and Wastewater Infrastructure (“pinv6”) - includes water, sewage and other systems and waste management and remediation services. It accounts for 7.4% of total public infrastructure investment.
The data reflect important general trends in Ontario, namely, growing infrastructure investment during the 1960s (a period outside our sample period), a subsequent slowdown in infrastructure investment during the 1970s, 1980s and 1990s, and a renewal in investment efforts since 2000. Public infrastructure investment was 4.3% of the GDP in the 1960s and declined to 2.6% during the 1980s and 1990s and has now reached 2.8% in the last decade.
The strong levels of infrastructure investment during the 1960s and 1970s are consistent with the construction of the Trans-Canada Highway and other major projects, such as Toronto’s subway system. With the completion of these projects, growth in infrastructure slowed until the late 1990s. As the growth rate of GDP exceeded that of the infrastructure stock, the stock’s share fell steadily during that time.
Since the late 1990s and early 2000s, substantial investment programs have developed. For example, in 1999, the Health Infrastructure Renewal Fund (HIRF) was established to assist public hospitals in the renewal of their healthcare facilities, and in 2002, the Ontario Strategic Infrastructure Financing Authority Act was passed to facilitate investment in clean water infrastructure, sewage treatment facilities, waste management infrastructure and public transit among others infrastructure areas. In addition, the 5-year ReNew Ontario Program (2005-2010), designed to improve education and health infrastructure, and the 2006 Move Ontario Trust, focused on financing new public transit infrastructure, represent sustained efforts on the part of the public sector to expand and improve the quality of infrastructure in Ontario.
Data testing and model specification
In order to determine the order of integration of the variables, the Augmented Dickey-Fuller (ADF) t-test is utilized to test the null hypotheses of a unit root. The Box Information Criterion (BIC) is used to determine the optimal number of lagged differences to be included in the regressions, and included deterministic components in the regressions if they are statistically significant. In all cases, with the exception of Government Administration and Transit, the t-statistics are lower, in absolute levels, than the 5% critical values. Therefore, the ADF tests cannot reject the null hypothesis of a unit root in these variables. Of the results of ADF t-tests applied to the first differences of the log-levels, i.e., the growth rates of the original variables, all critical values are greater, in absolute value, than the 5% critical value. Therefore, we can reject the null hypothesis of unit roots in the growth rates of the variables. We take this evidence as an indication that stationarity in first differences is a good approximation for all the time series under consideration.
A test for cointegration is also used among the different variables, performed both in the case of aggregate public infrastructure investment and with each one of the six types of public infrastructure investment. Following the standard Engle-Granger approach, four tests were performed in each case, as it is possible that one of the variables will enter the cointegrating relationship with a statistically insignificant coefficient. It is not known whether or not this will happen. If it does happen, however, a test that uses such a variable as the endogenous variable will not pick up the cointegration. Therefore, a different variable is endogenous in each of the four tests. The ADF t-test is applied to the residuals from the regressions of each variable on the remaining variables. In all of the tests, the optimal lag structure is chosen using the BIC, and a deterministic component is included if it is statistically significant. For all six public investment variables, the values of the t-statistics are larger than the 5% critical values for at least three of the four cases considered. Moreover, the test statistics are larger than the 1% critical values in five of the six times in which they are smaller than the 5% critical values. Thus, the ADF tests cannot reject the null hypotheses of a random walk, and it cannot be rejected that the variables are not cointegrated.
Given that it is determined that all of the variables have the same order of integration, they are all stationary of first order. It is also determined that they are not cointegrated. Therefore, seven VAR models are estimated, one for aggregate public infrastructure investment and one for each of the six different types of public infrastructure investment. Given the non-stationarity of the variables, standard procedure from the literature are followed and determine the specifications of the VAR models using first differences of log levels, i.e. growth rates of the original variables.
The specifications of the VAR models for the aggregate and the different types of public infrastructure investment are determined using Log-Likelihood tests. In all cases Log-Likelihood tests select a first order specification with a constant and a linear trend term. In all cases, special attention was dedicated to identifying possible structural breaks reflecting fundamental changes in the Canadian or Ontarian economies.
In this context, dummy variables for 1989 (Canada-U.S. Free Trade Agreement), 1994 (North American Free Trade Agreement), 1999 (Health Infrastructure Renewal Fund), 2002 (Ontario Strategic Infrastructure Financing Authority Act), and 2007 (the Great Recession) were included when statistically relevant.
Methodological considerations
Identifying the effects of innovations in public infrastructure investment
The impulse-response functions associated with the estimated VAR models are used to examine the effects of the different types of public infrastructure investment on economic performance. In this context the methodology allows dynamic feedbacks among the different variables to play a critical role. This is true in both the identification of innovations in the public investment variables, and the measurement of the effects of such innovations.
The central issue for the determination of the effects of public investment on the economic variables is the identification of shocks to public infrastructure investment that are not contemporaneously correlated with shocks in these variables, i.e., shocks that are not subject to the reverse causation problem. In dealing with this issue, the approach typically followed in the literature on the effects of monetary policy is drawn upon (for example, Christiano, Eichenbaum and Evans (1996,1998), and Rudebusch (1998) and adopted by Pereira (2000) in the context of the analysis of the effects of public infrastructure investment.
The approach followed to identify innovations in public infrastructure investment stems from theoretical rationale supporting the identification of exogenous innovations in public infrastructure investment – those not affected by, for example, growth in the economy. This theoretical rationale is supported by the statistical evidence which shows that public infrastructure investment is only weakly determined by the state of the economy. Thus the changes in the variable we wish to identify are purely policy driven. Statistically, this approach is through an orthogonalization strategy for the shocks to the different variables that reflects, firstly, that changes in public infrastructure investment follow changes in economic activity and then only with a lag, i.e., the public sector does not have the time, within a single year, to adjust public infrastructure investment decisions to the state of the economy, and secondly, that the changes that we identify are truly exogenous.
Ideally, the identification of shocks to public infrastructure investment which are uncorrelated with shocks in other variables would result from knowing what fraction of the government appropriations in each period is due to purely non-economic reasons. The econometric counterpart to this idea is to imagine a government policy function which relates the rate of growth of public infrastructure investment to the information in the relevant government information set; in this case, the past and current observations of the growth rates of the economic variables. The residuals from this policy function reflect the unexpected component to the evolution of public infrastructure investment and are uncorrelated with other innovations.
In the central case, it is assumed that the relevant information set for the policy function includes past values but not current values of the economic variables. This is equivalent in the context of the standard Choleski decomposition to assuming that innovations in public investment lead innovations in economic variables. This means that while innovations in public infrastructure investment affect the economic variables contemporaneously, the reverse is not true.
There are two reasons for making this the central case. First, it seems reasonable to believe that the economy reacts within a year to innovations in public infrastructure investment decisions. Second, it also seems reasonable to assume that the public sector is unable to adjust public infrastructure investment decisions to innovations in the economic variables within a year. This is due to the time lags involved in information gathering and public decision making. Nevertheless, to determine the robustness of our central case results, all the possible alternatives government information set are considered. This is equivalent to considering all the possible orderings of the variables within the Choleski decomposition framework.
The policy functions for aggregate infrastructure investment as well as the different types of public infrastructure investment relate the evolution of the public investment to the evolution of the economic variables with a one-year lag. The specification of these policy functions was tested. In no case were variables lagged more than one period statistically significant. More importantly, in no case were the contemporary values of the economic variables statistically significant. This confirms that the central case scenario is the most plausible also from an econometric perspective.
The fact that the matrix of variance covariance among the estimated VAR residuals shows in all cases a block-diagonal pattern where innovations in public infrastructure investment show very low correlations with innovation in the economic variables further confirms this strategy.
Measuring the effects of innovations in public infrastructure investment
The effects of one-percentage point, one-time random shocks in the rates of growth of the different types of public infrastructure investment on output, employment, and private investment are considered. These temporary shocks in the growth rates of the different types of public investment are expected to have temporary effects on the growth rates of the other variables. They will, however, have permanent effects on the levels of the economic variables. All of these effects are captured through the impulse response functions and accumulated impulse response functions associated with the estimated VAR models. In all cases standard deviation bands were calculated to ascertain the statistical significance of the results.
To measure the effects of public infrastructure investment, long-term elasticities and marginal products of the different economic variables with respect to each type of public infrastructure investment are calculated. Long term is defined as the time horizon over which the growth effects of innovations disappear, i.e., the accumulated impulse-response functions converge. The long-term elasticities measure the total percentage point changes in the economic variables for a long-term accumulated percentage point change in public infrastructure investment once all the dynamic feedback effects among the different variables have been considered.
In turn, the long-term accumulated marginal products of public infrastructure investment measure the dollar changes in the economic variables per dollar of accumulated change in public infrastructure investment. These are obtained by multiplying the ratio of the economic variable to public infrastructure investment, for the last ten years, by the elasticity of that variable with respect to public infrastructure investment. The choice of ratios for the last ten years reflects the relative scarcity of public infrastructure investment of the different types at the margin of the sample period without letting these ratios be overly affected by business cycle factors.
Overview of results
As noted above, the key quantitative results of the Study are expressed in the form of elasticities and marginal products. An “elasticity” is generally defined as the ratio of the percentage change in one variable (e.g., GDP) to the percentage change in another variable (e.g., infrastructure investment) and is meant to measure the responsiveness of one variable to another in a ‘unitless’ way. The long-term elasticities in this Study measure the total percentage point changes in the economic variables for a long-term accumulated percentage point change in public infrastructure investment. In turn, the long-term accumulated marginal products measure the dollar changes in the economic variables for each dollar of accumulated change in public infrastructure investment
It should be noted that the terms elasticities and marginal products are used in a way that departs from the conventional definitions in most of the literature. In this research, the terms include all of the dynamic feedbacks among the variables. Therefore, these are total and not ceteris paribus effects. That is, they measure both the direct and dynamic effects of public infrastructure investment on the economic variables and the indirect dynamic effects of public infrastructure investment through changes in the evolution of employment and private investment and thus are the relevant concepts from the standpoint of policy making. An alternative means of expressing these results is by considering the rates of return on the different types of public infrastructure investment by translating the marginal products based on an assumed investment lifespan (for example, 30 or 50 years).
Effects of public infrastructure investment at the aggregate level
The table below provides estimates of the economic impact as measured through elasticities and marginal products of public infrastructure investment at the aggregate (i.e., non-sector specific) level.
| - | Elasticity | Marginal Product |
|---|---|---|
| Private Investment | 0.220 | $0.69 |
| Employment | 0.007 | 2.70 |
| GDP | 0.097 | $3.08 |
Source: Alfredo Marvão Pereira and Rui Manuel Pereira, Department of Economics- The College of William and Mary
When the effects of shocks to aggregate public infrastructure investment on the evolution of economic variables are estimated, the resulting elasticity of private investment with respect to aggregate public infrastructure investment is 0.220. This means that at the aggregate level, public investment crowds in private investment. The elasticity of employment with respect to aggregate public infrastructure investment is 0.007. This figure suggests that 2.70 additional permanent jobs will be created in the long term for each additional one million dollars in public investment in infrastructure.
Aggregate public investment is found to have a positive effect on output with an elasticity of 0.097 and marginal product of $3.1, which implies that a one-dollar increase in public investment leads to a total accumulated increase of $3.1 in output. The corresponding annual rate of return is 3.8%, assuming an average asset lifespan of 30 years (or 2.3% over fifty years). These figures suggest that if output were taxed at a rate of 30%, one dollar invested in public infrastructure would generate near one dollar in tax revenues over time. Accordingly, at the aggregate level public investment would approximately pay for itself.
Effects of public infrastructure investment by asset category
The quantitative findings above support the contention that public infrastructure investments make a positive and significant contribution to economic performance. The table below provides estimates of the economic impact of infrastructure investment for each of the asset categories assessed in this Study.
| Private Investment | Elasticity | Marginal Product |
|---|---|---|
| Pinv1: Government Administration and Other | 0.503 | $6.98 |
| Pinv2: Health | 0.048 | $0.99 |
| Pinv3: Highways, Roads, Bridges | 0.206 | $2.03 |
| Pinv4: Education | 0.057 | $1.17 |
| Pinv5: Transit | 0.059 | $2.50 |
| Pinv6: Waste, Water and Wastewater | 0.168 | $7.22 |
| Employment | Elasticity | Marginal Product |
|---|---|---|
| Pinv1: Government Administration and Other | 0.022 | 35.75 |
| Pinv2: Health | 0.042 | 99.85 |
| Pinv3: Highways, Roads, Bridges | -0.044 | -49.70 |
| Pinv4: Education | 0.003 | 6.22 |
| Pinv5: Transit | 0.022 | 106.94 |
| Pinv6: Waste, Water and Wastewater | 0.005 | 22.71 |
| GDP | Elasticity | Marginal Product |
|---|---|---|
| Pinv1: Government Administration and Other | 0.001 | $0.16 |
| Pinv2: Health | 0.113 | $23.46 |
| Pinv3: Highways, Roads, Bridges | -0.038 | -$3.78 |
| Pinv4: Education | 0.068 | $14.17 |
| Pinv5: Transit | 0.068 | $29.19 |
| Pinv6: Waste, Water and Wastewater | 0.019 | $8.29 |
Source: Alfredo Marvão Pereira and Rui Manuel Pereira, Department of Economics- The College of William and Mary
Given that it has been established that public infrastructure investment makes a positive and significant contribution to economic performance, we can further assess which types of public infrastructure investment are the most productive economically. This is particularly important from a policy perspective as it may allow for specific recommendations with respect to infrastructure investment strategies to promote private investment, jobs and economic growth.
Elasticity estimates
Based on the results above, it is observed that public infrastructure investment in each category has a positive effect on private investment. Investment in Government Administration infrastructure has the largest elasticity with respect to private investment of 0.50. The weakest effect comes from a shock to investment in Health infrastructure with an elasticity of 0.05.
The employment elasticities are positive for five of the six infrastructure categories we examined, supporting the contention that in general, public infrastructure investments help to stimulate job growth. Investment in Health has the strongest effect on employment with an elasticity of 0.04. Investment in Highways, Roads and Bridges infrastructure has a negative effect on employment with an elasticity of -0.04 (the impact on this sector is discussed in a later section).
The effects of shocks to public infrastructure investments on output are positive for most infrastructure categories, with the exception of Highways, Roads and Bridges, which is negative, and Government Administration which is relatively small (not statistically different from zero). The strongest effect comes from a shock to Health infrastructure with an elasticity of 0.11. This is followed by the effect of Education (0.07), Transit (0.07), and Waste, Water, and Wastewater (0.02).
The impact of public infrastructure investment on both factor inputs as well as output is important to highlight. For example, Health infrastructure investment, which has the strongest effects on output, also has among the strongest effects on both employment and investment. As will be further discussed below, this is consistent with the channels through which improved health care contributes towards enhanced labour productivity and growth. In turn, Highways, Roads and Bridges infrastructure investments, which yield a negative effect on output, also have a negative effect on employment. These results are consistent with a production technology that exhibits strong complementarities between public infrastructure and other inputs in the case of the Health sector and one in which other inputs are largely substitutes in the case of Highways, Roads and Bridges sector.
Marginal products
The marginal products of private investment, employment and output with respect to public infrastructure investment are computed using the ratio of the macroeconomic variables to the stock of capital and the ratio of the stock of capital to investment volumes over the past ten years. This period is chosen to reflect the most recently available data and accurately reflect the effect of scarcity on the economic impact of public capital investment and to ensure that the results are not overly affected by business cycle fluctuations. Marginal product figures are a better measure (vis-à-vis elasticities alone) of the relative effects of different types of public infrastructure investments on output. This is because they reflect the relative scarcity of the different types of public investment at the margin of the sample period.
Consistent with the estimated elasticities, public infrastructure investment has a positive impact on private investment activities. Investment in Waste, Water and Wastewater infrastructure has the largest positive effect on private investment, with a marginal product of $7.2, followed closely by investment in Government Administration infrastructure with a marginal product of $7.0. The remaining types of public investment have effects on private investment in a relatively narrow range of between $1.0 and $2.5. Among those remaining types of infrastructure investment the largest effect on private investment stems from investment in Transit ($2.5), followed by Highways, Roads and Bridges ($2.0), Education ($1.2) and Health ($1.0).
All types of infrastructure investment have a positive impact on employment with the exception of investment in Highways, Roads and Bridges. The largest benefits come from investment in Transit and Health infrastructure. Investment in Transit infrastructure yield 107 permanent long term jobs per million dollars in investment, closely followed by Health infrastructure which yields 100 permanent long term jobs created per million dollars in investment. Waste, Water and Wastewater and Government Administration infrastructure show more moderate effects of 36 and 23 long-term jobs per million dollars in investment, respectively, while the effect from investment in Education infrastructure translates to 6 permanent jobs.
In terms of their effects on output, the marginal product figures suggest that all types of public investment are productive, with the exception of investment in Highways, Roads and Bridges. Transit and Health infrastructure investments have the largest positive impact on output ($29.1 and $23.5 respectively). These figures mean, in the case of Transit for example, that each additional dollar of infrastructure investment in this sector increases output, over the long term, by $29.1. Investments in Education ($14.2) and in Waste, Water and Wastewater infrastructure ($8.3) also have a fairly strong positive effect on output. In contrast, investment in Government Administration infrastructure has a marginal product of just $0.2 – not statistically different from zero – and investment in Highways, Roads and Bridges has a negative marginal product, of -$3.8.
To assess the effects on how marginal products have evolved in relation to the changes in the relative scarcity of infrastructure capital stock, the estimates using ten year moving averages starting from the beginning of the sample period onwards are also calculated.
The first chart below presents the marginal product of output with respect to public infrastructure investment and the size of the stock of public capital. The black line corresponds to the marginal product of output with respect to public infrastructure investment and the green dotted line corresponds to the size of the public infrastructure stock as a percent of GDP. A diminishing marginal return to public capital investment is consistent with economic theory and suggests that with a more developed stock of infrastructure incremental additions through investment will have progressively smaller economic effects.
Figure 10: Evolution of estimated marginal product over time
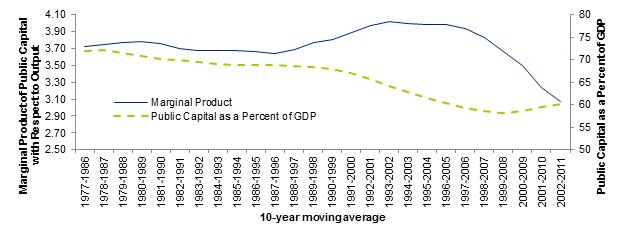
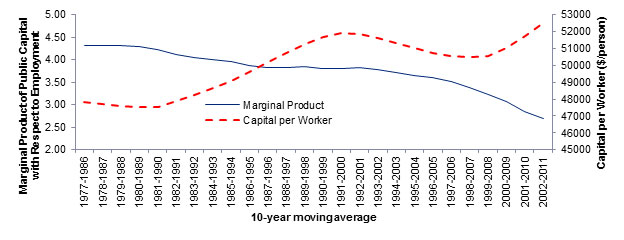
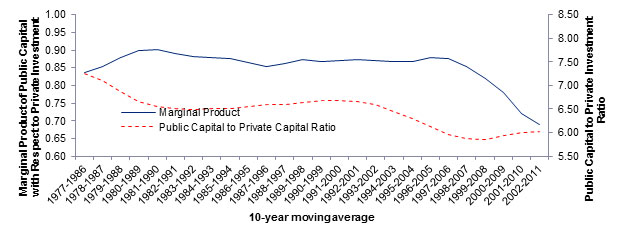
The figure presents three charts. The first presents the marginal product of output with respect to public infrastructure investment and public capital as a percent of GDP using 10-year moving average approach; the second presents the marginal product of public capital with respect to employment and public capital per worker using 10-year moving average approach and the third chart represents the 10-year moving average of marginal product of public capital with respect to private investment and public capital to private capital ratio.
Rates of return
As noted, another way of expressing these results is by considering the rates of return (derived from the marginal product estimates) on the different types of public infrastructure investment. The rate of return to public infrastructure investment in Transit infrastructure is 11.9% and is the highest, followed closely by Health infrastructure, with a rate of return of 11.1%, in line with the marginal product results. The rate of return for Education infrastructure is 9.2% while the rate of return on Waste, Water and Wastewater infrastructure is 7.3%. The remaining two categories (Government Administration and Highways, Roads and Bridges) indicate negative rates – consistent with the marginal product estimates presented earlier. An example illustrating the calculation of marginal product and rate of return is provided for the Transit infrastructure category later in this section.
| - | 30-year lifespan | 50-year lifespan |
|---|---|---|
| Pinv1: Government Administration and Other | - | - |
| Pinv2: Health | 11.1% | 6.5% |
| Pinv3: Highways, Roads, Bridges | - | - |
| Pinv4: Education | 9.2% | 5.4% |
| Pinv5: Transit | 11.9% | 7.0% |
| Pinv6: Waste, Water and Wastewater | 7.3% | 4.3% |
Aggregate versus sector-specific estimates
Although we have noted that the aggregate effects are less significant than the disaggregated effects from a policy perspective, it is useful to compare the two sets of results. In general we would expect the disaggregated effects to fit qualitatively if not quantitatively within the general scope of the aggregate effects. When considering the figures for the elasticities we observe that the aggregate elasticities are in all cases well within the range of the sectoral elasticity estimates. The same is true for the aggregate estimates of the marginal products for output and employment while the aggregate figure for the marginal product of investment is just below the lower bound of the range of variation of the disaggregated marginal product estimates.
It should be noted however that the expectation that the aggregate results will line up exactly with the disaggregate results would be misplaced. Aside from technical aspects relating to different model specifications at the different levels, there is a conceptual issue of the fallacy of composition, or what in our case we could call general equilibrium effects. Indeed, one would not expect the simultaneous investment of a dollar in all assets to have the same effect as strategically implemented investment through time.
Simultaneous investments would lead to general equilibrium effect through pressures in labour and private capital markets which would tend to reduce the observed effects in both input and output markets. Ultimately, the total effect identified at the aggregate level should be less than the sum of the partial effects obtained by calculating a weighted average of the disaggregated effects (with the weights being the relative importance of each type of infrastructure). This is indeed what we observe with the empirical results which are very much in line with the evidence for the U.S. (see for example Pereira (2000)). The result for private investment further suggests a great degree of sensitivity in capital markets in Ontario stemming from demand in different sectors such that general equilibrium effects are particularly pronounced in this case.
Further discussion on the interpretation of sector specific results is provided in the ‘Economic interpretation of results’ section below.
Effects of public investment on labour productivity and on capital intensity
The effects of public infrastructure investment on labour productivity can be obtained from the values of the elasticities as the sign of the change in the output to labour ratio is the same as the difference between the elasticities of output and employment. At the aggregate level, the elasticity of output is much larger than the elasticity of labour which implies that public investment in infrastructure leads to a great increase in the labour productivity in Ontario. This is a pattern also observed for Education infrastructure for which the increase is extremely strong. It is also to a lesser extent for Health, Highways, Roads and Bridges, Transit and Waste, Water and Wastewater infrastructure. The case of Government Administration infrastructure is the exception in that it actually leads to a decline in labour productivity.
The same reasoning applies to the capital intensity of the economy as measured by the private capital to labour ratio. At the aggregate level the elasticity with respect to private capital is substantially greater than the one for employment which implies that public infrastructure investment greatly increases the capital intensity of the economy. This pattern in particularly strong for Government Administration, Highways, Roads and Bridges, Education and Waste, Water and Wastewater infrastructure and less so for Transit. No effect is estimated for Health infrastructure.
International comparisons
Comparisons of results obtained in any study with the existing results in the relevant literature are always useful. In the case of the estimates of the effects of public investment in infrastructure, this is however particularly difficult. This is because of the wide variety of data definitions and scope, econometric methodologies used, the time frame of estimates, and even the meaning of terms such as elasticities or marginal products. For the purpose of this Study, we are well-positioned to compare our results for Ontario with the results developed in other jurisdictions by Pereira and his research team and that have been published in the economics literature. This has the immediate advantage of providing a solid common methodological background as well as a clear insight into the development of the estimates.
Comparison with U.S. estimates
Given the prior application of this methodology, we can compare the results obtained for Ontario with the results in Pereira (2000) for the United States, the most widely cited and recognizable results. The United States provides a basis of comparison at a similar level of development and infrastructure scarcity as Ontario. Based on US data from 1956 to 1997, the estimated elasticities with respect to aggregate infrastructure investment are 0.043, 0.007, and 0.229, with respect to output, employment, and private investment, respectively. Our estimates here for Ontario are similar for employment and private investment and higher for output (at 0.097). The marginal product estimated for Ontario ($3.1) is somewhat lower than the one estimated for the U.S. ($4.5).
The comparisons at the disaggregated level are more tentative as the types of public capital asset considered for the U.S. and Ontario cases do not match perfectly. For the U.S., investment in administration, health and education are grouped together and the estimated elasticities are 0.017, 0.003, and 0.022, for output, employment, and private investment, respectively. These results are in line for example with our estimates for the elasticity of output for Government Administration infrastructure, the elasticity of employment for Education infrastructure, and the elasticity of private investment for Health and Education infrastructure. This also suggests that our disaggregation is meaningful given that the three sectors yield considerably different results.
The case of the effects of the investment in highways is interesting. For the U.S. a positive but rather low elasticity of output of 0.006 with a marginal product of $1.9 is estimated. The elasticity of employment is estimated at -0.006 and 0.012 with respect to private investment. A negative effect on employment and positive effect on investment is also estimated. In the case of Ontario, the effect on output is negative. This is in line with the very small albeit positive effects identified in the U.S. case, indeed, the smallest effects amongst all infrastructure types in that study.
In addition, when transit is considered, the estimates for the U.S. are 0.0213 (with a marginal product of $19.8), 0.011, and 0.095 for output, employment and private investment, respectively. The corresponding values for Ontario are 0.068 (with a marginal product of $29.2), 0.022, and 0.059, and are of the same order of magnitude. In particular, the output effects are the largest of any of the asset types considered in the U.S. case and are also the largest identified for Ontario. Finally, for the US the elasticities for the category that includes waste and water management are 0.008 (with a marginal product of $6.4), -0.012, and 0.012, for output, employment and private investment. For Ontario all elasticities are estimated to be positive with the elasticity of output of 0.019 and a marginal product of $8.3.
Summary
The comparisons above, which result in differential estimates between the U.S. and Ontario as one would expect, nevertheless are directionally consistent, both at the aggregate level and the relevant comparable sector level. For example transit infrastructure investment effects are the largest of any of the asset types considered in the U.S., and are also the largest identified for Ontario. Similarly, the highways asset category generates the lowest elasticity and marginal products in both the U.S. and Ontario.
Economic interpretation of results
Conceptual link between investment and drivers of economic growth
In order to supplement the long-term quantitative analysis and results presented previously, the following section utilizes qualitative analysis and supporting research literature findings to further describe the long-term dynamics and impacts of infrastructure investment across sectors.
The qualitative framework deployed in this Study is drawn from a similar approach utilized in a recent research study conducted by Deloitte in Australia. In July 2011, Infrastructure New South Wales (“NSW”) in Australia was tasked with preparing a 20 year strategy to assess the current state of infrastructure and ultimately identify strategic priorities for the State. To assist Infrastructure NSW in the preparation of this comprehensive strategy, Deloitte was engaged to develop an understanding of the current and future state NSW economy and an assessment of the economic impacts of the State’s Infrastructure Strategy on the NSW economy. Deloitte’s report included a qualitative framework to examine how infrastructure investment impacts various “channels” that drive economic growth in the long term, drawing upon the link between investment types and its effect on these channels, namely, population, participation and productivity.
This qualitative framework or mapping exercise, supported by literature review findings is considered to be appropriate for the purposes of this Study, as it assists in understanding the economic rationale and interpretation of the quantified effects as well as potentially highlighting conceptual effects of infrastructure investments that may be challenging to reflect from a quantification perspective.
Infrastructure generally affects economic activity through: 1) capital and operating expenditure directly increasing measured economic activity; and 2) the services provided through infrastructure enabling increased economic activity. The first of these effects tends to be a boost to measured economic activity, while the latter tends to result in a long run improvement in economic performance and living standards. Once the initial or shorter-term economic effect of the capital and operating expenditure pass, the long term economic effects of infrastructure investment are to be found in how the services provided by the infrastructure enable increased economic activity by affecting population, participation and productivity.
In the context of this framework, population, participation and productivity, are defined as follows:
- population: population growth, and the demographic structure of the population determine the size of the future working age population
- participation: the size of the future working age population combined with expected participation rates will determine the number of persons employed in the economy
- productivity: growth in the number of persons employed and growth in productivity ultimately determine the rate at which the economy will grow in the future
Developing a qualitative mapping of impacts of infrastructure investment across sectors will identify the conceptual underpinnings of how investment in each sector drives population, participation and productivity, which in turn may potentially impact long-term economic growth. An example of this conceptual relationship linking infrastructure investment to productivity, population and participation is shown in the figure below. This qualitative mapping exercise is based on conceptual economic impact linkages and literature review, which in some cases identifies quantitative relationships.
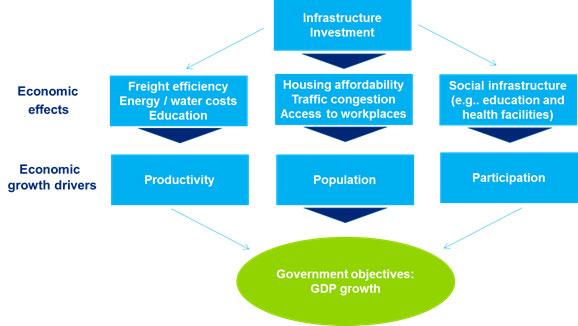
The chart above shows that infrastructure investment has economic effects on freight efficiency, energy/water costs and education, housing affordability, traffic congestion and access to workplaces, and social infrastructure (e.g., education and health facilities); the economic effect eventually becomes economic growth drivers on productivity, population growth and labor force participation; and the economic growth drivers help achieve government objectives on GDP growth.
The following sections explore the conceptual linkages for each of the key sectors considered in this Study in the context of the results obtained through the quantitative analysis. For the purpose of this discussion, the Government Administration infrastructure category has been excluded from the literature review section, given the limited research and literature on the economic effects of investment in this sector.
Health
The effects of shocks to Health infrastructure investment as estimated in this Study are presented in the table below. From a GDP perspective, the marginal product of $23.46 resulting from investment in Health infrastructure is the second largest sector effect (after Transit) indicating a strong link between investment and output for the health sector.
| Pinv2: Health | Elasticity | Marginal Product |
|---|---|---|
| Private Investment | 0.048 | $0.99 |
| Employment | 0.042 | 99.85 |
| GDP | 0.113 | $23.46 |
From a conceptual standpoint, health infrastructure investment has the potential to impact population, participation and productivity, thus impacting economic growth in the long-term through the following drivers:
- Addressing healthcare needs and demand — Healthcare infrastructure investment plays a significant role in addressing the Province’s healthcare needs and demand for various healthcare services. Improved or new healthcare infrastructure (e.g., expanded hospitals) plays a significant role in addressing Ontario’s evolving and growing healthcare needs that include increasing demand for healthcare services from an aging population, infrastructure replacement and improvement requirements due to aging infrastructure, etc. Addressing such demand through health infrastructure development and enhancement and resulting healthcare services, can be expected to have far reaching impacts including the increased long-term health of citizens and employees. These impacts to health can be expected to influence population growth, labour force participation and employee productivity in the long-run.
- Driving efficiencies and cost savings — Healthcare infrastructure investment also drives efficiencies and cost savings, as improved or new healthcare infrastructure, enhanced diagnostic equipment, eHealth programs, etc. provide more efficient services may play a significant role in reducing patient wait times for healthcare services, which drive greater efficiencies across the healthcare system. Such efficiencies affect the ability of the population and labour force to remain healthy and potentially more productive, with less sick leaves, etc., and in turn reduce healthcare costs.
- High quality job creation — Additionally, healthcare infrastructure investment has the ability to support high quality job creation. The development, fitting out, and operations of new or improved healthcare infrastructure facilities would likely engage a highly skilled workforce, including medical technicians, equipment developers, healthcare practitioners, etc. Such jobs can also be expected to be associated with strong income levels.
- Economic development and site selection tool — Finally, the quality of healthcare facilities and services within a particular region can serve as an important economic development and site selection tool for businesses, as many businesses seek to locate in close proximity to services / amenities such as healthcare, in order to accommodate employee interests. While public infrastructure is usually built based on demographic characteristics, population may also seek out and thus potentially increase through the development of new healthcare facilities / hospitals (although this has not yet been studied or confirmed through economic literature).
It should also be noted that the long term economic impact of health infrastructure investment would be expected to manifest over a potentially long period of time, as improved healthcare efficiencies or ultimately improved health outcomes resulting from improved facilities will be experienced over the course of several years after the investments in infrastructure are made. In addition, it may be challenging to disentangle some of the effects noted above with regard to improved infrastructure from potential increases in the quality of the healthcare services themselves (e.g., investment in doctors, technology etc.) which may or may not go hand-in-hand with the infrastructure investments.
Literature review support
There are several important studies that support the existence of the type of conceptual linkages identified above. For example, in a 2009 study, the Centre for Spatial Economics found that reducing the growth of hospital budgets in Ontario would leave the Province with a permanent reduction in its population, work force and GDP
Additionally, the Canadian Medical Association (2013) identified federal healthcare infrastructure funding recommendations based on the care needs of a growing seniors’ population in Canada, and the impact of this growth on Canada’s health care system
Summary of health infrastructure impacts on productivity, population and participation
Concept of link of infrastructure investment to drivers of economic growth
Productivity
- addressing healthcare needs and demand
- driving efficiencies and cost savings
- high quality job creation
Population
- addressing healthcare needs and demand
- economic development and site selection tool
- driving efficiencies and cost savings
- high quality job creation
Participation
- addressing healthcare needs and demand
- economic development and site selection tool
- driving efficiencies and cost savings
- high quality job creation
Literature support examples
Productivity
- The Centre for Spatial Economics (2009)
footnote 23 - Canadian Medical Association (2013)
footnote 24
Population
- The Centre for Spatial Economics (2009)
- Canadian Medical Association (2013)
Participation
- The Centre for Spatial Economics (2009)
- Canadian Medical Association (2013)
Highways, Roads, and Bridges
The effects of shocks to Highways, Roads and Bridges infrastructure investment as estimated in this Study are presented in the table below. As noted, the results indicate a slight negative effect of investment on output and provide the lowest marginal product for GDP among the infrastructure sectors considered in this Study.
| Pinv2: Highway, Roads, Bridges | Elasticity | Marginal Product |
|---|---|---|
| Private Investment | 0.206 | $2.02 |
| Employment | -0.044 | -49.70 |
| GDP | -0.038 | -$3.78 |
Although the estimated results suggest a non-significant effect of highway infrastructure investment on output, there are a number of potential drivers that may be expected to positively impact economic growth at a conceptual level through impact of investment on population, participation and productivity:
- Reducing congestion, increasing reliability and safety — Improved and / or new highways, roads, and bridges improve and reduce travel congestion and increase reliability and safety, which result in numerous potential benefits including reducing transport costs through less travel time, fuel, etc. (i.e. productivity impacts), thus making municipalities / communities more appealing places to live for residents (i.e. population impacts) and providing improved access to existing employment opportunities (i.e. participation impacts).
- Improved access — Transportation costs are an essential parameter in understanding the development of cities. By reducing the time taken for workers to travel, within and across metropolitan areas, alterations to road networks increase access to employment across a broader area. With respect to productivity, improved and / or new highways, roads, and bridges also enable improved access to enter and exit regions, and to travel within regions, thus supporting the efficiency of businesses, shipping, trade, etc., and driving productivity.
- Improved efficiency — Improved and / or new highways, roads, and bridges also potentially allow commuting labour forces more efficient and quicker commuting time when traveling to and from work or other destinations, thus allowing additional time to be spent on work or productive capacities, time with family, personal interests and enhancing quality of life.
- Population growth — Additional highway infrastructure within metropolitan regions will create higher demand for employment relative to those metropolitan areas where no such growth in infrastructure took place. The result of this will be to shift the working population towards those metropolitan regions which experience higher rates of highway infrastructure growth and away from those that experienced relatively less growth. By lowering the cost of transportation within a city, highway infrastructure that makes a city more attractive relative to others, should be associated with population changes in the city benefitting from the infrastructure.
- Economic development and site selection tool — Improved and / or new highways, roads, and bridges may be a catalyst for new business development and site selection opportunities, given the enhanced ability for prospective businesses to access service providers, suppliers and employees, and expand local participation opportunities through new business attraction / development and improved access to existing employment opportunities.
- Lower cost options — Businesses are also able to better access additional regions / communities through enhanced highways, roads, and bridges, including lower cost land options, while residents may have better access to new housing areas and opportunities, increasing accessible supply and reducing costs.
In considering the non-significant effect of highway infrastructure investment on output estimated in this Study in the context of conceptual economic understanding which would generally point to a positive relationship as described above, additional factors may be at play that help to explain the direction of the results obtained in Ontario.
While it is possible that improved highway infrastructure will lead to greater private investment and output, it is also possible that improved highway provision leads to more efficient transportation services which can be accommodated with better equipment and less personnel. The latter seems to be our case as we see an increase in investment and a reduction in labour and overall an increase of the capital intensity of the economy. Additionally, Ontario is the largest exporting province in Canada, with high level of international trade with U.S. as well as interprovincial trade. This indicates the openness of the Ontario economy with strong links to other provinces and the U.S. and connectedness of its highway infrastructure with other jurisdictions. When demand for transportation services is exogenous and determined by general patterns of interprovincial and international trade, as it may be the case with an open economy as is Ontario, it is possible not to observe any positive output effects. The results found here for Ontario are consistent with evidence found for U.S. states which border the province found in Pereira (2012) (discussed in the literature support section below). In this context, regional spillovers are a particularly important consideration. Additionally, the level of infrastructure development may be a factor to consider as well. Given Ontario’s well-developed state of highway infrastructure, the results may indicate the presence of diminishing returns as the highway network has expanded over time, suggesting that continued maintenance and rehabilitation may have important impacts relative to further expansion in light of the maturity of the highway asset base in Ontario.
General caveat on the results
Despite the fact that the results for Highways, Roads and Bridges are well within the realm of the conceptual expectations and the empirical evidence in the literature, there is a residual concern related to the quality of this specific data set. The concern is specifically that by constructing a series based on a fixed percentage of a greater expenditure aggregate – even if this approach gives a reasonable approximation in certain given year for which it is possible to check – we do not capture the nuances of the changes in growth rates which is a core element of the methodology. Accordingly, and given the way the series was constructed it is possible that the results may be somewhat biased in the direction of the results identified for Government Administration infrastructure which were significant for investment, moderate for employment and non-significant on GDP.
Literature review support
The effects of improved transportation infrastructure on the economy are relatively well-studied in the literature, particularly on aspects of reduced transportation costs and improved access resulting from investment. For example, Duranton and Turner (2009) estimate the elasticity of unit transportation costs to road provision, by estimating the metropolitan areas mean cost of driving as a function of interstate lane kilometres, and found that a 1% increase in road provision leads to a 0.06% decrease in transport costs.
Duranton and Turner (2008) analyzed US metropolitan areas between 1980 and 2000 in order to understand the relationship between population growth and highway infrastructure. Using historical transport infrastructure, they estimate that a 10% increase in the extent of the road networks in a given city, results in an increase of population in that metropolitan area of 1.3% over 10 years, rising to 2% over 20 years. Duranton and Turner (2010) estimate that a 10% increase in the stock of interstate highways leads to a 1.5% increase in employment over 20 years. Apparicio et al. (2007) also found that transportation infrastructure and local employment growth are positively related
With respect to further insight into the non-significant effects cited in this Study, evidence on the effect of highway infrastructure in the U.S. (Pereira (2012) in Annals of Regional Science) suggested the following results for the effects of highway investments in bordering U.S. states:
- Investment in the region alone: Negative effects of highway investment in: Michigan, New York, Wisconsin; Positive output effects: Minnesota ($0.44), Ohio ($1.23) Pennsylvania ($0.58); Negative on employment and investment (NY and Wisconsin).
- Total highway investment in the region and elsewhere: All effects are positive on output but not enough to reverse Michigan New York and Wisconsin results; Total effects for Minnesota ($0.87), Ohio ($2.28), Pennsylvania ($2.56).
This paper shows that the state specific results can only capture the full effects observed at the aggregate level for the U.S. if for each state we consider both investment within and outside the state, i.e. network effects. Spillovers are about two-thirds of the overall effects.
Summary of highway infrastructure impacts on productivity, population and participation
Concept of link of infrastructure investment to drivers of economic growth
Productivity
- reducing congestion, increasing reliability and safety
- improved access
- improved efficiency
- lower cost options
Population
- reducing congestion, increasing reliability and safety
- improved access
- population growth
- economic development and site selection tool
- lower cost options
Participation
- improved access
- economic development and site selection tool
Literature support
Productivity
- Duranton and Turner (2009 and 2011)
footnote 26 - Gibbons et al.(2010)
footnote 27 - Economic Development Research Group (2010)
- D. Howe Institute (2013)
Population
- Baum-Snow (2006, 2010 and 2011)
footnote 28 - Duranton and Turner (2010)
- Boarnet and Chalermpong (2003)
- D. Howe Institute (2013)
Participation
- Baum-Snow (2006, 2010 and 2011)
- Duranton and Turner (2010)
- Apparicio et al.(2007)
footnote 29 - D. Howe Institute (2013)
Education (schools and post-secondary education)
The effects of shocks to Education infrastructure investment as estimated in this Study are presented in the table below. From a GDP perspective, the marginal product of $14.17 resulting from investment in education infrastructure is the third largest sector effect (after Transit and Health) indicating a strong link between investment and output for this sector.
| Pinv4: Education | Elasticity | Marginal product |
|---|---|---|
| Private Investment | 0.057 | $1.17 |
| Employment | 0.003 | 6.22 |
| GDP | 0.068 | $14.17 |
In terms of conceptual linkages, investment in education infrastructure has the potential to positively impact population, participation and productivity, thus impacting economic growth in the long-term through the following drivers:
- Provision of skills and training — Improved and / or new post-secondary institutions can be expected to lead to the provision of key skills and training to work force participants that will subsequently drive labour productivity, and potentially enable and expand participation opportunities through the provision of education, training and skills development and thus improved access to employment opportunities.
- Improved teaching environment — The quality of post-secondary and other education infrastructure has the ability to support student morale, participation, learning, and potentially performance, as well as teacher / faculty enthusiasm, which also benefits students' experience.
- Population growth — Improved / new schools and post-secondary institutions can be expected to lead to the attraction of new temporary and possibly permanent population, including domestic and international post-secondary students / faculty living outside of the given jurisdiction, and community development associated with new schools.
- Economic development and site selection tool — The quality of post-secondary and education facilities and services within a particular region can serve as an important site selection tool for businesses, as many businesses seek to locate in close proximity to amenities such as education, in order to accommodate employee interests (schools for children), and source employment / skills (from post-secondary education institutions). As such, local population will be potentially increased through the development of new post-secondary facilities / schools, while local participation will be potentially increased through the development of new post-secondary facilities / schools, as graduates enter the workforce.
As in the case of healthcare infrastructure, it should also be noted that the long term economic impact of education infrastructure investment would be expected to experience a lag effect in terms of taking a significant period to be realized, as students enrolled in improved educational institutions ultimately graduate and enter the labour force several years after the investments in infrastructure are made. In addition, it may be challenging to disentangle some of the effects noted above with regard to improved infrastructure from potential increases in the quality of the educational services themselves (e.g., teachers, technology etc.) which may or may not go hand-in-hand with the infrastructure investments.
Literature review support
There are several research studies that have examined the link between education infrastructure and potential economic outcomes. In a 2005 Ontario Ministry of Education report, it was noted that there is a strong link between the standard of the physical learning environment and student performance as well as teacher retention
A Ohio University study in 2010 suggests that overcrowding (which can be attributed to an insufficient number of schools) leads to an increase in problem behavior and negative student attitudes and student- friendly classrooms lead to higher participation, better attendance and more positive interactions between students
The 21st Century School Fund (2010) finds that the quality of education infrastructure has a significant impact on various education outcomes
Statistics Canada (2007)
Summary of education infrastructure impacts on productivity, population and participation
Concept of link of infrastructure investment to drivers of economic growth
Productivity
- provision of skills and training
- improved student / teacher experience
Population
- population growth
- economic development and site selection tool
Participation
- provision of skills and training
- population growth:
- economic development and site selection tool
Literature support
Productivity
- Ministry of Education (2005)
footnote 35 - Ohio University (2010)
footnote 36 - Centre For Effective Learning Environments (2010)
footnote 37 - Statistics Canada (2007)
footnote 38 - 21st Century School Fund (2010)
footnote 39
Participation
- Ministry of Education (2005)
Transit
The effects of shocks to Transit infrastructure investment as estimated in this Study are presented in the table below. From a GDP perspective, the marginal product of $29.19 resulting from investment in transit infrastructure is the largest sector effect indicating a strong link between investment and output for this sector.
| Pinv5: Transit | Elasticity | Marginal product |
|---|---|---|
| Private Investment | 0.059 | $2.50 |
| Employment | 0.022 | 106.94 |
| GDP | 0.068 | $29.19 |
In terms of conceptual linkages, investment in transit infrastructure has the potential to positively impact population, participation and productivity, thus impacting economic growth in the long-term through the following drivers:
- Reducing congestion, increasing reliability and safety — Improved and / or new transit systems reduce travel congestion and travel times which results in reducing transport costs, increasing reliability and safety and offers affordable commuting options, making an urban centre a more appealing place to live.
- Improved efficiency — With respect to productivity impacts, improved and / or new transit systems potentially allows the commuting labour force quicker travel times, thus allowing additional time to be spent on work / productive capacities. Investment in transit systems can also lead to efficient and equitable transport systems including basic mobility for non-drivers, efficient urban travel and serve as a catalyst for more efficient land use development.
- Improved access — Improved and / or new transit systems may also attract population growth as workers are better able to access additional locations of work, and expand local participation opportunities through improved and equitable access to existing employment opportunities.
- Economic development and site selection tool — Improved and / or new transit systems may also be a catalyst for new business development and site selection, given the enhanced ability to access supplier / customer base, employees, etc. through the introduction of new transit systems.
- Lower cost options — Improved and / or new transit systems open up new housing areas, increasing the accessible supply of housing across a range of prices including more affordable housing, making communities more appealing places to live. However, it should also be noted that housing located in close proximity to transit can be found to command higher pricing.
Literature review support
There are a number of relevant research studies that document the economic benefits of transit investment. In 2010 the Canadian Urban Transit Association found that nationally, transit reduces vehicle operating costs for households by $5 billion annually, reduces the economic costs of traffic collisions by $2.5 billion annually and saves $115 million in annual health care costs related to respiratory illness
The Itasca Project (2012) examined the long term impacts of a full transit infrastructure build out in the Minneapolis/St. Paul area in the U.S. and noted the following direct user impacts:
- travel time savings of $4.6-$11.4 billion
- vehicle operating cost savings of $1.5-$4.7 billion
- shipper and logistics cost savings of $185-$270 million
- safety benefits of $53 to $88 million
- pavement maintenance savings of $26 to $54 million
Expanded rail infrastructure is positively and significantly related to population in the area that benefited from it. Specifically, Levinson (2007) found that a 10% increase in rail infrastructure results in a 2.2% increase in population density in the affected area
Duranton and Turner (2011) estimate the long term rate of population growth, between 1920 and 2000, as a function of rail routes and population, finding that a 10% increase in rail would result in a 3% increase in population over the time period 1920-2000.
Summary of transit infrastructure impacts on productivity, population and participation
Concept of link of infrastructure investment to drivers of economic growth
Productivity
- reducing congestion, increasing reliability and safety
- improved efficiency
Population
- reducing congestion, increasing reliability and safety
- improved access
- economic development and site selection tool
- lower cost options
Participation
- improved access
- economic development and site selection tool
Literature support
Productivity
- Canadian Urban Transit Association (2010)
footnote 42 - ItascaProject (2012)
Population
- Levinson (2007)
footnote 43 - Baum-Snow et al.(2011)
- Duranton and Turner (2011)
- Centre for Housing Policy (2011)
footnote 44
Participation
- Canadian Urban Transit Association (2010)
Waste, Water and Wastewater
The effects of shocks to Waste, Water and Wastewater infrastructure investment as estimated in this Study are presented in the table below. From a GDP perspective, the marginal product of $8.29 resulting from investment in waste, water and wastewater infrastructure is a medium sized effect relative to the other sectors considered, however, the effect on private investment (marginal product of $7.22) is the largest impact relative to other sectors.
| Pinv6: Waste, water and wastewater | Elasticity | Marginal product |
|---|---|---|
| Private Investment | 0.168 | $7.22 |
| Employment | 0.005 | 22.71 |
| GDP | 0.019 | $8.29 |
In terms of conceptual linkages, investment in waste, water and wastewater infrastructure has the potential to positively impact economic growth in the long-term through the following drivers:
- Quality of healthy environment — The quality of waste, water and wastewater management has significant impact on the health of communities, including the health of local residents, ecosystems, environment, etc. Such health impacts can be expected to indirectly influence factors such as labour productivity, through the support of health communities provided to the health of local residents. Such health impacts will also support the existing population base of communities, and potentially drive population growth through the provision of positive health conditions to support new births and migration / immigration.
- Economic development and site selection tool — The quality of waste, water and wastewater within a particular region can serve as a site selection tool for businesses, as many businesses seek to locate in jurisdictions with high-quality, reliable core infrastructure services. Residential and community development is also linked to the provision of such services, as residents also require such fundamental infrastructure services. As such, local population growth can potentially be supported through the development of new and / or improved waste, water and wastewater infrastructure (although there is limited direct evidence to support this).
The impact of investments in this sector may also be viewed through the lens of reducing risk of major disasters (e.g., contaminated water supply etc.) and creating the necessary foundation for a normally functioning society and economy. In this context, these investments may play more of a risk reduction/avoidance function rather than necessarily advancing economic development directly.
Literature review support
Although the conceptual linkages noted above may exist, there is limited research evidence in the literature in this field. One example is a study by Wilson (2000) that examined the costs and benefits of a sewage control plan for Halifax Harbour, including some of the reasons behind the requirement of this form of infrastructure
Summary of waste, water and wastewater infrastructure impacts on productivity, population and participation
Concept of link of infrastructure investment to drivers of economic growth
Productivity
- quality of healthy environment
Population
- quality of healthy environment
- economic development and site selection tool
Participation
- quality of healthy environment
- economic development and site selection tool
Literature support
Productivity
- Wilson (2000)
footnote 46
Government Administration and Other Infrastructure
The effects of shocks to Government Administration and Other infrastructure investment as estimated in this Study are presented in the table below. The results indicate a significant positive effect on private investment ($6.98 marginal product), but one of the lowest marginal products for GDP among the infrastructure sectors considered in this Study.
| - | Elasticity | Marginal product |
|---|---|---|
| Private Investment | 0.503 | $6.98 |
| Employment | 0.022 | 35.75 |
| GDP | 0.001 | $0.16 |
Government Administration infrastructure underpins the foundations of the regulatory system in the Province. In general, such infrastructure can be viewed as framing the economic system. In this sense, Government Administration provides for a direct externality to the private sector. In addition, Government Administration infrastructure has a direct impact on employment, particularly in the public sector, necessary to run the system. Furthermore, the positive externality to private sector production through the provision of public goods, yields an indirect effect on employment and private investment.
Our results further indicate that investment in Government Administration infrastructure has no effect on output. This may suggest that an overall increase in government production may be compensated by economic activity deviated from the private sector – a substitution effect – yielding an overall negligible impact of this type of public investment in infrastructure on GDP.
Accordingly, the main effects of strong public institutions and the resulting strength and stability in the economic environment are channeled through greater private investment. This is consistent with the conjecture that infrastructure investment increases private investment and leads to an increase in the capital intensity of the economy, shifts employment to the public sector and results in an overall increase in public sector production. As such, an increase in investment in Government Administration infrastructure would produce a more labour intensive public sector and a more capital intensive private sector.
Considerations for future infrastructure investment allocation
Application of the Study findings
The analytical findings presented in this Study provide a critical understanding of the economic impact of historical investments across infrastructure sectors in Ontario. In particular, they provide a historical perspective on the most productive investments across infrastructure sectors which may be used as one set of inputs in the MOI’s broader assessment to develop the optimal allocation of investment dollars across infrastructure sectors going forward.
We understand that the MOI is currently undertaking other work that may be used in conjunction with findings from this Study to develop an investment allocation framework to guide infrastructure investment decisions going forward. It is expected that a range of factors will tie into this allocation framework, which may include the following considerations noted below for reference:
- The government’s social and economic policy objectives and priorities and associated implications for infrastructure investment planning
- Alignment of Provincial government policies with municipal and federal government priorities, plans and funding availability
- Assessment of the current state (e.g., stock and quality) of the Province’s infrastructure assets and identification of deficiencies and lifecycle considerations
- An assessment of future infrastructure needs and demands based on expected demographic and economic developments in Ontario
- Public consensus and support for investments in specific infrastructure sectors
- Evidence-based economic impact and benefit-cost assessments at sector level (and ultimately project level to ensure appropriate prioritization)
As noted, this Study has developed a set of important findings using a tested methodology and rigorous quantitative analysis that may feed into the MOI’s investment allocation framework to support decision making.
Specifically, the findings presented in the Study establish that public infrastructure investment in aggregate, as well as in most of the sectors considered have a positive impact on private investment, employment and output. As the results from this Study have shown, investments in transit, health and educational infrastructure have had the most significant impact on GDP growth in Ontario over the historical period assessed. This is a pattern consistent with the mounting international evidence of the importance of human capital (driven by health and education sector investments) for long term economic performance.
The results from this Study can be interpreted as providing high level directional guidance on which infrastructure sectors should be prioritized from an investment perspective based on historical performance. Thus, a potential implication of these findings in terms of input into a forward-looking assessment of investment allocation is that continued emphasis on investment in these specific sectors may be viewed as beneficial to the long-term economic growth prospects of Ontario.
As discussed in the Report, the negative elasticity and marginal product results for the Highway, Roads and Bridges infrastructure category warrant careful attention in ensuring they are interpreted appropriately. To be clear, the negative effects estimated for the sector do not imply that Ontario should be divesting its highways, but rather the opposite. It likely means that the road network in Ontario is sufficient at meeting transportation needs at the Province-wide level (if not necessarily regional) without significant incremental investments. The important point to note from existing research is that ensuring that the network is well-integrated with Ontario’s neighbours is of utmost importance, and that benefits may accrue from expansion in other jurisdictions that may contribute to the economic impact of investments in Ontario.
The elements of the Province’s current Building Together plan highlight Ontario’s continued focus on investing in public infrastructure, particularly in areas that support economic growth and competitiveness. As the Province is expected to continue to commit significant funds to improve Ontario’s infrastructure beyond the current planning horizon, the need for a systematic investment allocation framework has been identified to assist in the investment decision making across infrastructure sectors, which the results of this Study will be able to contribute to as noted above.
Potential next steps
Future strands of analysis may be considered to build on this Study as the results presented here may open the door to several important avenues of research directly relevant for policy purposes. This is the case, in particular, of the analysis of effects of infrastructure investment at the industry and regional level in Ontario as well as the interaction between investments in Ontario and the economic performance of neighbouring provinces and vice versa, that is, the issue of inter-provincial infrastructure investment spillovers. This may be particularly important to achieve a more complete understanding of the effects of infrastructure investments, particularly for the highway infrastructure category.
Another important area to focus on next may be to drill down into each of the infrastructure asset categories to assess economic effects of investment at the next level of disaggregation below the total investment levels assessed in this Study. For the purpose of this Study, we have focused on the investment amounts per each infrastructure asset category without explicit consideration for the type and nature of those investments. Thus as a next step, it would be useful to assess the effect of investment within each sector broken down between for example, new infrastructure capital, maintenance/repair expenditures and capital refurbishment categories This analysis would assist in understanding the potential economic impact at this more detailed level of infrastructure spending, and such analysis would potentially further support and inform investment decision making across sectors at a more granular level based on the nature of investment.
Appendix A – Mapping of economic outcomes per asset class
Health infrastructure investment
Conceptual link of infrastructure investment to drivers of economic growth
Productivity
- Healthcare needs / demand: Improved / new healthcare infrastructure plays a significant role in addressing Canada / Ontario’s evolving / growing healthcare needs, including increasing demand for healthcare services from an aging population; need for infrastructure replacement / improvement due to aging infrastructure, etc. Addressing such demand through health infrastructure development / enhancement and resulting healthcare services will have far reaching impacts including the increased health of citizens and employees.
- Efficiencies and cost savings: Improved / new healthcare infrastructure plays a significant role in reducing patient wait times for healthcare services, in order to drive greater efficiencies across the healthcare system. Such efficiencies affect the ability of the population / labour force to remain healthy and potentially more productive, with less sick leaves, etc., and also reduce healthcare costs.
- High quality job creation: The development / fitting out / operations of new / improved healthcare infrastructure facilities would likely engage a highly skilled workforce, including medical technician, equipment developers, practitioners, etc. Such jobs can also be expected to be associated with high income levels.
Population
- Healthcare needs / demand: Improved / new healthcare infrastructure plays a significant role in addressing Canada / Ontario’s evolving / growing healthcare needs, including increasing demand for healthcare services from an aging population; need for infrastructure replacement / improvement due to aging infrastructure, etc. Addressing such demand through health infrastructure development / enhancement and resulting healthcare services will have far reaching impacts including the increased health of citizens and employees.
- Economic development / Site selection: The quality of healthcare facilities and services within a particular region can serve as an important site selection tool for businesses, as many businesses seek to locate in close proximity to amenities such as healthcare, in order to accommodate employee interests. As such, local population will be potentially increased through the development of new healthcare facilities / hospitals.
- Improved efficiency: Improved / new healthcare infrastructure plays a significant role in reducing patient wait times for healthcare services, in order to drive greater efficiencies across the healthcare system. Such efficiencies affect the ability of the population / labour force to remain healthy and potentially more productive, with less sick leaves, etc.
- High quality job creation: The development / fitting out / operations of new / improved healthcare infrastructure facilities would likely engage a highly skilled workforce, including medical technician, equipment developers, practitioners, etc. Such jobs can also be expected to be associated with high income levels.
Participation
- Healthcare needs / demand: Improved / new healthcare infrastructure plays a significant role in addressing Canada / Ontario’s evolving / growing healthcare needs, including increasing demand for healthcare services from an aging population; need for infrastructure replacement / improvement due to aging infrastructure, etc. Addressing such demand through health infrastructure development / enhancement and resulting healthcare services will have far reaching impacts including the increased health of citizens and employees.
- Economic development / Site selection: The quality of healthcare facilities and services within a particular region can serve as an important site selection tool for businesses, as many businesses seek to locate in close proximity to amenities such as healthcare, in order to accommodate employees and their needs. New healthcare facilities such as hospitals and medical schools will also serve as a driver for significant local employment growth.
- Improved efficiency: Improved / new healthcare infrastructure plays a significant role in reducing patient wait times for healthcare services, in order to drive greater efficiencies across the healthcare system. Such efficiencies affect the ability of the population / labour force to remain healthy and potentially more productive, with less sick leaves, etc.
- High quality job creation: The development / fitting out / operations of new / improved healthcare infrastructure facilities would likely engage a highly skilled workforce, including medical technician, equipment developers, practitioners, etc. Such jobs can also be expected to be associated with high income levels.
Literature support
Productivity
- Canadian Medical Association (2013) identified federal healthcare infrastructure funding recommendations based on the care needs of a growing seniors’ population and the impact of this growth on Canada’s health care system. Communities across Canada are concluded to lack resources to meet the housing and care needs of the senior population. This report also identifies the direct and indirect economic benefits estimated to result from the recommended healthcare infrastructure investment, including annual contributions of $1.2 billion to GDP, 11,600 high value jobs during operations, over $425 million in federal government revenues and over $370 million in provincial revenues.
- Ontario Health Coalition (2009) finds that reducing the growth of hospital budgets in Ontario would leave the province with a permanent reduction in its population, work force and GDP. It will also lower the standard of living for those that remain in the province. The study also notes that the impact of cuts in Ontario’s hospital system will, however, be felt beyond the workers and businesses affected by the cuts by (i) reducing the ability of communities that lose their local hospital to attract or retain businesses and by (ii) increasing wait times for patients.
Population
- Canadian Medical Association (2013) identified federal healthcare infrastructure funding recommendations based on the care needs of a growing seniors’ population and the impact of this growth on Canada’s health care system. Communities across Canada are concluded to lack resources to meet the housing and care needs of the senior population. This report also identifies the direct and indirect economic benefits estimated to result from the recommended healthcare infrastructure investment, including annual contributions of $1.2 billion to GDP, 11,600 high value jobs during operations, over $425 million in federal government revenues and over $370 million in provincial revenues.
Participation
- Canadian Medical Association (2013) identified federal healthcare infrastructure funding recommendations based on the care needs of a growing seniors’ population and the impact of this growth on Canada’s health care system. Communities across Canada are concluded to lack resources to meet the housing and care needs of the senior population. This report also identifies the direct and indirect economic benefits estimated to result from the recommended healthcare infrastructure investment, including annual contributions of $1.2 billion to GDP, 11,600 high value jobs during operations, over $425 million in federal government revenues and over $370 million in provincial revenues.
Highways, roads, and bridges infrastructure investment
Conceptual link of infrastructure investment to drivers of economic growth
Productivity
- Congestion: Improved / new roads reduce travel congestion and increase reliability and safety, which result in reducing transport costs.
- Improved access: Improved / new roads enable better access to enter / exit the region and to travel within the region, supporting the efficiency of businesses, shipping, trade, etc.
- Improved efficiency: Improved / new roads potentially allows the commuting labour force more efficient and quicker commute / travel, thus allowing additional time to be spent on work / productive capacities, enhance quality of life, etc.
- Lower cost options: Improved / new roads provide businesses access to additional regions / communities and potentially lower cost land options.
Population
- Congestion: Improved / new roads reduce travel congestion and increase reliability and safety, which make cities / communities more appealing places to live.
- Improved access: Improved / new roads may attract population growth as workers are better able to access additional locations of work.
- Economic development / site selection: Improved / new roads may be a catalyst for new business development, given the enhanced ability to access suppliers, employees, etc.
- Lower cost options: Improved / new roads potentially open up new housing areas, increasing supply and reducing costs, making a given community a more appealing place to live.
Participation
- Improved access: Improved / new roads enable and expand local participation opportunities through new business attraction / development and improved access to existing employment opportunities.
- Economic development / site selection: Improved / new roads may be a catalyst for new business development, given the enhanced ability to access suppliers, employees, etc.
Literature support
Productivity
- Duranton and Turner (2009 and 2011) indicate that a 1% increase in road provision leads to a 0.05% and 0.1% decrease in transport costs.
- Gibbons et al. (2010) find no statistically significant effect on productivity from rising employment accessibility resulting from road transport infrastructure.
- Economic Development Research Group (2010) identifies five positive long term impacts:
- cost savings from reduced user time & expense
- cost savings from enhanced safety & reliability
- cost savings from enhanced inter-modal capacity & connectivity
- cost savings and scale economies from enhanced market access
- added growth enabled by elimination of capacity constraints at gateways
- The paper also identifies ROI measures: 4.0 economic impact ratio calculates value added generated per dollar of transportation investment, and 3.8 benefit/cost ratio, adds the value of non-money benefits such as personal time and safety.
Population
- Baum-Snow (2006 and 2011) find that an additional radial road leads to central city populations decreasing by 6-18% compared to the case where no road is provided.
- Duranton and Turner (2010) estimate that a 10% increase in the stock of interstate highways leads to a 1.5% increase in employment over 20 years.
- Boarnet and Chalermpong (2003) find that construction of roads increases house prices for those living in close proximity to the road.
Participation
- Apparicio et al. (2007) finds significant positive relationship between transport infrastructure and local employment growth.
- Duranton and Turner (2010) estimate that a 10% increase in the stock of interstate highways leads to a 1.5% increase in employment over 20 years.
Education, including schools and post-secondary education infrastructure investment
Conceptual link of infrastructure investment to drivers of economic growth
Productivity
- Skills and training: Improved / new post-secondary institutions can be expected to lead to the provision of key skills and training that will subsequently drive labour productivity.
- Research, innovation, and commercialization: Post-secondary education and research programs are a key source of research, innovation, commercialization, which are widely noted as key contributors to productivity and economic growth.
- Student / teacher experience: The quality of post-secondary / education infrastructure has ability to support student morale, participation, learning, and potentially performance, as well as teacher / faculty enthusiasm, which also benefits students' experience.
- Ministry of Education (2005) identifies that there is a strong link between the standard of the physical learning environment and student performance as well as teacher retention.
Population
- Population growth: Improved / new schools and post-secondary institutions can be expected to lead to the attraction of new temporary and possibly permanent population, including domestic and international post-secondary students / faculty living outside of the given jurisdiction, and community development associated with new schools.
- Economic development / Site selection: The quality of post-secondary and education facilities and services within a particular region can serve as an important site selection tool for businesses, as many businesses seek to locate in close proximity to amenities such as education, in order to accommodate employee interests (schools for children), and source employment / skills (from post-secondary education institutions). As such, local population will be potentially increased through the development of new post-secondary facilities / schools.
Participation
- Skills and training: Improved / new post-secondary institutions enable and expand participation opportunities through the provision of education, training and skills development and thus improved access to employment opportunities.
- Population growth: Improved / new schools and post-secondary institutions can be expected to lead to the attraction of new temporary and permanent employment, including domestic and international post-secondary faculty living outside of the given jurisdiction.
- Economic development / Site selection: The quality of post-secondary education facilities and services within a particular region can serve as an important site selection tool for businesses, as many businesses seek to locate in close proximity to amenities such as education, in order to accommodate employee interests (schools for children), and source employment / skills (from post-secondary education institutions). As such, local participation will be potentially increased through the development of new post-secondary facilities / schools, as graduates enter the workforce.
Literature support
Productivity
- Ministry of Education (2005) identifies that there is a strong link between the standard of the physical learning environment and student performance as well as teacher retention.
- Ohio University (2010) suggests that overcrowding (which can be attributed to an insufficient number of schools) leads to an increase in problem behavior and negative student attitudes and student friendly classrooms lead to higher participation, better attendance and more positive interactions between students. Additionally, aging school facilities can undermine the learning process whereas a more modern facility can improve it. Teachers that are forced to work in poor quality facilities are less enthusiastic about their jobs and therefore less likely to offer students the full attention they may need.
- Centre For Effective Learning Environments (2010) provides support for the theory that students “well-being”, which encompasses many aspects including marks, interaction with other students, perception of the school and teachers, etc., is directly impacted by the quality of the school’s infrastructure.
- Statistics Canada (2007) finds that the presence of a university that is close to youths results in increases in university attendance. However, the increases in university participation came at the expense of college participation which meant that despite the investment in post-secondary infrastructure, there was very little change in the overall participation rates for post-secondary institutions.
- 21st Century School Fund (2010) finds that the quality of education infrastructure has a significant impact on various education outcomes. i.e. for every 10% reduction in the percent of portable facility sf/student, test scores increased by 11 points.
Participation
- Ministry of Education (2005) identifies that there is a strong link between the standard of the physical learning environment and student performance as well as teacher retention.
Transit infrastructure investment
Conceptual link of infrastructure investment to drivers of economic growth
Productivity
- Congestion: Improved / new transit system reduces travel congestion and increase reliability and safety, which result in reducing transport costs.
- Improved efficiency: Improved / new transit systems potentially allows the commuting labour force quicker commute / travel times, thus allowing additional time to be spent on work / productive capacities.
- Improved efficiency: Improved / new transit systems lead to efficient and equitable transport system including basic mobility for non-drivers, efficient urban travel, and is a catalyst for more efficient land use development.
Population
- Congestion: Improved / new transit reduce congestion, increase reliability and safety, and offer affordable commuting options which makes the city a more appealing place to live.
- Improved access: Improved / new transit may attract population growth as workers are better able to access additional locations of work.
- Economic development / site selection: Improved / new transit may be a catalyst for new business development, given the enhanced ability to access supplier / customer base, employees, etc.
- Lower cost options: Improved / new transit open up new housing areas, increasing supply and reducing costs, making the city a more appealing place to live. However, housing located in close proximity to transit can be found to command higher pricing.
Participation
- Improved access: Improved / new transit enable and expand local participation opportunities through improved and equitable access to existing employment opportunities.
- Economic development / site selection: Improved / new transit may be a catalyst for new business development, given the enhanced ability to access supplier / customer base, employees, etc.
Literature support
Productivity
- Canadian Urban Transit Association (2010) finds that nationally, transit reduces vehicle operating costs for households by $5 billion annually, reduces the economic costs of traffic collisions by $2.5 billion annually, and saves $115 million in annual health care costs related to respiratory illness.
- ItascaProject (2012) examined the long term impacts of a full transit infrastructure build out, to find the following direct user impacts: travel time savings of $4.6-$11.4 billion, vehicle operating cost savings of $1.5-$4.7 billion, shipper and logistics cost savings of $185-$270 million, safety benefits of $53 to $88 million and pavement maintenance savings of $26 to $54 million.
Population
- Centre for Housing Policy (2011) examines the theory that homes located near public transit command a higher rent or sales prices.
- Levinson (2007)
footnote 47
Participation
- Canadian Urban Transit Association (2010) identifies direct and indirect employment generated from the Canadian transit industry to total 45,300 and 24,300, respectively.
Waste, water and wastewater infrastructure investment
Conceptual link of infrastructure investment to drivers of economic growth
Productivity
- Health: The quality of water and waste management has significant impact on the health of communities, including population, ecosystem, etc. Such health impacts can be expected to indirectly influence factors such as labour productivity.
Population
- Health: The quality of water and waste management has significant impact on the health of communities, including population, ecosystem, etc. Such health impacts will in turn support the existing population base of communities, and potentially support population growth through new births and migration / immigration.
- Economic development / Site selection: The quality of water / waste water within a particular region can serve as a site selection tool for businesses, as many businesses seek to locate in close proximity to basic infrastructure services. Community / residential development is also linked to the provision of such services. As such, local population will potentially be supported through the development of new / improved water / waste water infrastructure.
Participation
- Health: The quality of water and waste management has significant impact on the health of communities, including population, ecosystem, etc. Such health impacts will in turn support the existing population base of communities, and potentially support population growth through new births and migration / immigration, resulting in a positive impact on participation.
- Economic development / Site selection: The quality of water / waste water within a particular region can serve as a site selection tool for businesses, as many businesses seek to locate in close proximity to basic infrastructure services. Community / residential development is also linked to the provision of such services. As such, local population will potentially be supported through the development of new / improved water / waste water infrastructure.
Literature support
Productivity
- GPI Atlantic (2000) examined the costs and benefits of a sewage control plan for Halifax Harbour, including some of the reasons behind the requirement of this form of infrastructure. Poor water quality and poor aesthetics have negative effects on: harbour ecosystem, tourism, urban quality of life, and public health risks of illness from contact with water.
Footnotes
- footnote[1] Back to paragraph Includes all public infrastructure in Ontario. Ontario Ministry of Infrastructure, “Building Together: Section One: Ontario Past, Present And Future”.
- footnote[2] Back to paragraph We obtain the marginal product by multiplying the ratio of the economic variable to public infrastructure investment, for the last ten years, by the elasticity of that variable with respect to public infrastructure investment. Martin Prosperity Institute, “Infrastructure and the Economy: Future directions for Ontario”. February 2009.
- footnote[3] Back to paragraph Additional results for the effect of public infrastructure investment on private investment and employment are provided in the Final Report and Technical Report. The Conference Board of Canada, “The Economic Impact of Ontario’s Infrastructure Investment Program”. April 2010.
- footnote[4] Back to paragraph Includes all public infrastructure in Ontario.The Conference Board of Canada, “The Economic Impact of Ontario’s Infrastructure Investment Program”. April 2013.
- footnote[5] Back to paragraph Ministry of Infrastructure, 2012. RiskAnalytica, “Public Infrastructure Investment in Ontario: The Importance of Staying the Course”. May 2011.
- footnote[6] Back to paragraph Martin Prosperity Institute, “Infrastructure and the Economy: Future directions for Ontario”. February 2009.
- footnote[7] Back to paragraph Ontario Ministry of Infrastructure, Statistics Canada.
- footnote[8] Back to paragraph The Conference Board of Canada, “The Economic Impact of Ontario’s Infrastructure Investment Program”. April 2010.
- footnote[9] Back to paragraph The Conference Board of Canada, “The Economic Impact of Ontario’s Infrastructure Investment Program”. April 2013.
- footnote[10] Back to paragraph RiskAnalytica, “Public Infrastructure Investment in Ontario: The Importance of Staying the Course”. May 2011.
- footnote[11] Back to paragraph Macdonald, Ryan. An Examination of Public Capital’s Role in Production. Statistics Canada. Ottawa : s.n., 2008.
- footnote[12] Back to paragraph Haider et al, “Investing in Ontario’s Infrastructure for Economic Growth and Prosperity”. May 2013.
- footnote[13] Back to paragraph Ontario Ministry of Infrastructure, “Optimal Investment in Public Infrastructure in Ontario”. 2012.
- footnote[14] Back to paragraph Aschauer, David Alan. (1989): Is Public Expenditure Productive? Journal of Monetary Economics, 23, 177–200.
- footnote[15] Back to paragraph Ontario Ministry of Infrastructure, “Optimal Investment in Public Infrastructure in Ontario”. 2012.
- footnote[16] Back to paragraph Bond, S., Leblebicioglu, A., and Schiantarelli, F. (2004): Capital Accumulation and Growth: A New Look at the Empirical Evidence.
- footnote[17] Back to paragraph The College of William and Mary “The Economic Impact and Financing of Infrastructure Spending”, 2012.
- footnote[20] Back to paragraph Ontario Ministry of Infrastructure, “Optimal Investment in Public Infrastructure in Ontario”. 2012. Department of Economics, The College of William and Mary - Alfredo Marvão Pereira and Rui Manuel Pereira, “On the Effects of Infrastructure Investment on Economic Performance in Ontario”. July 2013.
- footnote[18] Back to paragraph This category is interchangeably referred to as “Highways” in the Report.
- footnote[19] Back to paragraph We obtain the marginal product by multiplying the ratio of the economic variable to public infrastructure investment, for the last ten years, by the elasticity of that variable with respect to public infrastructure investment.
- footnote[21] Back to paragraph The Centre for Spatial Economics, Isabelle Cohen, Thomas Freiling and Eric Robinson. “The Economic Impact of Hospital Closures in Ontario”. 2009.
- footnote[22] Back to paragraph Canadian Medical Association, “The Need for Health Infrastructure in Canada”. 2013
- footnote[23] Back to paragraph The Centre for Spatial Economics, “The Economic Impact of Hospital Closures in Ontario”. 2009.
- footnote[24] Back to paragraph Canadian Medical Association, “The Need for Health Infrastructure in Canada”. 2013
- footnote[25] Back to paragraph Apparicio et al.,” A study of the relationship between continental accessibility and employment growth in Canadian communities. 2007.
- footnote[26] Back to paragraph Duranton, G and Turner. ‘Urban growth and transportation’, University of Toronto.2011.
- footnote[27] Back to paragraph Gibbons. S, and Lyytikainen. T, Overman. H, Sanchis-Guarner. R, and Laird. J, ‘Evaluating the productivity impacts of road transport schemes: report on pilot study findings’. Department for Transport. 2010.
- footnote[28] Back to paragraph Baum-Snow “Changes in Transportation Infrastructure and Commuting Patterns in US Metropolitan Areas, 1960-2000”, American Economic Review Papers and Proceedings, 2010.
- footnote[29] Back to paragraph Apparicio et al.,” A study of the relationship between continental accessibility and employment growth in Canadian communities. 2007.
- footnote[30] Back to paragraph Ontario Ministry of Education, “Ontario education excellence for all, good places to learn: Renewing Ontario’s schools. 2005.
- footnote[31] Back to paragraph Adriel EzraShearer, “The Impact of a New School Facility”, 2010.
- footnote[32] Back to paragraph Centre For Effective Learning Environments, “Well-Being At School: Does Infrastructure Matter”. 2010.
- footnote[33] Back to paragraph 21st Century School Fund, “Research on the Impact of School Facilities on Students and Teachers”. 2009.
- footnote[34] Back to paragraph Statistics Canada, “Do Universities Benefit Local Youth? Evidence from University and College Participation, and Graduate Earnings Following the Creation of a New University”. 2007.
- footnote[35] Back to paragraph Ontario Ministry of Education, “Ontario education excellence for all, good places to learn: Renewing Ontario’s schools. 2005.
- footnote[36] Back to paragraph Adriel EzraShearer, “The Impact of a New School Facility”, 2010.
- footnote[37] Back to paragraph Centre For Effective Learning Environments, “Well-Being At School: Does Infrastructure Matter”. 2010.
- footnote[38] Back to paragraph Statistics Canada, “Do Universities Benefit Local Youth? Evidence from University and College Participation, and Graduate Earnings Following the Creation of a New University”. 2007.
- footnote[39] Back to paragraph 21st Century School Fund, “Research on the Impact of School Facilities on Students and Teachers”. 2009.
- footnote[40] Back to paragraph Canadian Urban Transit Association, “Measuring Success: The Economic Impact of Transit Investment in Canada”. 2010.
- footnote[41] Back to paragraph Levinson, D., “Density and dispersion: the co-development of land use and rail in London”, Journal of Economic Geography. 2007.
- footnote[42] Back to paragraph Canadian Urban Transit Association, “Measuring Success: The Economic Impact of Transit Investment in Canada”. 2010.
- footnote[43] Back to paragraph Levinson, D., “Density and dispersion: the co-development of land use and rail in London”, Journal of Economic Geography. 2007.
- footnote[44] Back to paragraph Center for Housing Policy, “Public Transit’s Impact on Housing Costs: A Review of the Literature”. 2011.
- footnote[45] Back to paragraph Sara Justine Wilson, “Measuring Sustainable Development Application of the Genuine Progress Index to Nova Scotia”. 2000.
- footnote[46] Back to paragraph Sara Justine Wilson, “Measuring Sustainable Development Application of the Genuine Progress Index to Nova Scotia”. 2000.
- footnote[47] Back to paragraph Levinson, D., “Density and dispersion: the co-development of land use and rail in London”, Journal of Economic Geography. 2007.