Provincial Wood Supply Strategy
A consolidated wood supply report and plan of action. The primary purpose is to identify critical wood supply issues and provide strategies to address those issues.
Provincial wood supply strategy
Forest policy series
A digital copy of this publication is available at no charge by emailing the Manager, Timber Allocation and Licencing Section in Forest Industry Division.
Telephone inquiries about ministry programs and services should be directed to the Natural Resources Information and Support Centre:
General inquiry
Fax
Executive summary
This document presents a picture of the wood supply and a set of strategies for the Province of Ontario. It was produced by the Ministry of Natural Resources (MNR) with input from key stakeholders. The primary purpose of the Provincial Wood Supply Strategy is to identify critical wood supply issues and provide approaches (strategies) for addressing those issues.
There are two primary objectives focused on sustaining wood supply within the bounds of overall forest sustainability:
- To sustain a continuous, predictable, long-term wood supply necessary for industrial processing facilities; and,
- To increase the level of long-term available wood supply.
The Provincial Wood Supply Strategy responds to legal commitments described in Condition 48 of the Declaration Order Regarding MNR’s Class Environmental Assessment Approval for Forest Management on Crown Lands in Ontario (MNR-71) as released in June 2003. This strategy document also supports the MNR vision of sustainable development and mission of ecological sustainability. The Crown Forest Sustainability Act states that Crown forests are managed to meet social, economic and environmental needs of present and future generations. This document replaces in whole the Regional Wood Supply Strategies, published by the MNR in 2003.
This strategy document is provincial in scope. Each of the three MNR administrative regions has a separate section to provide a regional context and a discussion of regional scale issues. The significant issues and related strategies are identified within the area of the Boreal and Great Lakes-St. Lawrence Forest regions. The strategies themselves will be implemented at the provincial, regional and/or local management unit level. The scope and implementation is described within the discussion for each of the strategies.
The Provincial Wood Supply Strategy is linked directly to the Ontario Forest Accord and the Ontario Forest Accord Advisory Board’s (OFAAB) proposal for “Room to Grow.” The OFAAB recommended in its final report that the regional wood supply strategies serve as the instrument for benchmarking the long-term wood supply available to Ontario’s forest industry and for identifying the threshold that would initiate “Room to Grow” sharing discussions. Appendix 1 contains the utilization benchmarks necessary to facilitate this process.
The foundation for this strategy document is the wood supply database contained in Appendix 1. This database graphically presents wood supply, demand and utilization information for each management unit and species group. The information is then aggregated into regional and provincial graphs of wood supply and demand. Part 2 of this strategy document examines wood supply and demand in a regional context. The analysis was conducted to determine the ability of the Crown forests to continue to supply Ontario’s forest industry into the future, and to identify wood supply issues. No attempt was made to forecast future demand levels, or to predict future trends in the forest products sector. The dynamic nature of the forest industry is purposefully outside the scope of this wood supply strategy.
Part 3 is the essence of the document. It contains the significant issues and the strategies recommended to address those issues.
Boreal Forest Issues and Strategies
Following an analysis of the data and an examination of the forest management context, two issues were identified in the Boreal Forest:
- Future wood supply drops below current demand; and,
- Quality of wood supply information.
These two issues are also relevant to the Great Lakes-St. Lawrence Forest although the context is different. Hence, the strategies addressing these issues are provincial in scope.
Across the Boreal Forest, wood supply is predicted to fall below the level of industrial demand in the near future. The wood supply gap, which has been forecast for many years, is primarily the result of an age-class imbalance in the forest itself, but this situation has been compounded by a number of other factors.
The forecast for the two administrative regions within the Boreal Forest predicts that the spruce-pine-fir (SPF) supply will fall below the demand level in 5 to 10 years and take 80 years to fully recover. For poplar, the forecast is for supply to fall below demand in 15 years, with recovery in about 70 years. The supply gap is by far the most critical issue facing the forest industry in this part of the Province. The developing gap between wood supply and demand presents an unavoidable dilemma – increase the wood supply or reduce mill consumption.
The second issue applies across the entire province. The ability to accurately predict wood supply is limited by the quality of the information on which we base wood supply projections within forest management planning. The quality of information is strongly tied to the issue of wood supply. Information quality affects wood supply from two perspectives. First, better information increases confidence in the conclusions regarding the nature and degree of the wood supply gap. Second, more reliable information allows forest managers to make decisions which optimize the management and use of forest resources. For example, more accurate resource inventory and increased knowledge of forest succession will allow for improved decisions concerning the scheduling of forest stands for harvesting.
Eleven strategies are proposed to help mitigate these two issues within both the Boreal Forest and the Great Lakes-St. Lawrence Forest. They are:
- Review the wood demand for mills;
- Provide demand information to planning teams to help set appropriate plan objectives for wood supply;
- Promote best practices for forest management modelling;
- Improve growth and yield information;
- Improve forest resources inventory;
- Improve the knowledge of stand condition and forest succession;
- Increase utilization of available wood:
- Use silviculture to increase forest productivity;
- Monitor the effectiveness of silvicultural treatments;
- Implement a fire management strategy for Ontario; and,
- Ensure guide effectiveness and efficiency.
Great Lakes-St. Lawrence forest issues and strategies
Five wood supply issues were identified as significant and particular to the Great Lakes-St. Lawrence Forest:
- Current shortage of high-quality sawlogs and veneer in the region;
- Long-standing surplus of low-grade hardwoods;
- Sustainability of the private land harvest;
- Long-term regional trend towards declining poplar supplies; and,
- Regeneration problems in older white pine shelterwood treatments.
Strategies 1 to 11 for the Boreal Forest, which address the issues of long-term wood supply and the quality of information, also pertain to the Great Lakes-St. Lawrence Forest.
There are nine additional strategies which pertain specifically to the Great Lakes-St. Lawrence Forest:
- Continue efforts to improve the growing stock after harvest through proper tree marking and stand improvement practices;
- Continue efforts to minimize logging damage to residual trees;
- Study methods to minimize logging damage done by mechanized harvesting;
- Salvage high-quality trees with high mortality risk during tree marking;
- Maximize the harvest of available pulpwood;
- Give support for permits to export tolerant hardwood pulpwood;
- Conduct a private land wood supply study within Southern Region;
- Advise poplar using industries of the forecasted declining poplar supply; and,
- Ensure that past white pine shelterwood treatments are regenerated in accordance with the requirements of their licence.
The Provincial Wood Supply Strategy and the strategies contained herein are not meant to be prescriptive. The intent of this initiative is to provide information and a suite of tools to help manage wood supply issues to meet future needs. When implemented, the strategies will move forest management towards a secure, predictable supply of wood for industry and the potential of surplus for additional parks and protected areas.
Purpose, objectives, and principles
Purpose
Produced by the Ministry of Natural Resources (MNR), this document presents a consolidated wood supply strategy for the Province of Ontario.
The purposes of this document are to:
- Document industrial wood supply and demand;
- Document the benchmark of the long-term supply for sharing under “Room to Grow”;
- Identify critical wood supply issues;
- Provide strategies to address the identified issues; and,
- Fulfill the legal commitment under Condition 48 of the EA Approval for Forest Management.
footnote 2
Strategy objectives
The Provincial Wood Supply Strategy initiative supports two primary objectives:
- To sustain a continuous, predictable, long-term wood supply necessary for industrial processing facilities; and
- To increase the level of long-term available wood supply.
These two objectives are achieved only within the bounds of overall forest sustainability as defined by the Crown Forest Sustainability Act and as determined at the local level through the forest management planning process.
Strategy principles
The appropriate context and direction for addressing wood supply issues is defined by a set of principles. The development and implementation of strategies to achieve the wood supply objectives will be guided by these principles:
- Wood supply is determined at the local level through the forest management planning process and is an outcome of planning for a broad set of economic, social and environmental objectives. This planning process requires the appropriate application of all forest management guides;
- Future investment by the forest industry and its ongoing contribution to the provincial economy is highly dependent on the quantity, quality and cost of wood supply;
- The present and future economic and social vitality of many communities in northern and central Ontario is dependent upon the quantity, quality and cost of wood supply;
- Strategies that increase wood supply have the potential to secure and increase community benefits and employment;
- The impact of the quantity and quality of wood supply on the social and economic vitality of local communities is described and assessed during the development and approval of forest management plans;
- Strategies are designed to support the Ontario Forest Accord and the “Room to Grow” policy framework;
- Permanent increases in wood supply will enable sharing between industrial use and protected areas establishment in accordance with the “Room to Grow” policy framework;
- Estimates of wood supply need to be based on sound resource inventory and scientific information (high quality natural resource science and information) in order to ensure sound decision-making related to forest sustainability and the availability of fibre for industrial processing; and
- Estimates of wood supply and the effect of the various factors affecting wood supply need to be monitored and publicly reported to facilitate adaptive management and accountability.
Part 1. introduction
Wood supply and forest sustainability
Ontario’s forests are managed for a broad range of uses and to conserve economic, social, environmental and cultural values. Sustainable development is the vision of the Ministry of Natural Resources.
The mission of the Ministry of Natural Resources is to manage our natural resources in an ecologically sustainable way to ensure they are available for the enjoyment and use of future generations. Ecological sustainability focuses on safeguarding the province’s natural capital and nature’s capacity to renew itself. To achieve sustainability, forest ecosystems must be maintained in a healthy state, and the value of the forest to all users must be respected.
Although this document is aimed at ensuring that “current demand” for wood for the forest industry is given appropriate consideration during the forest management planning processes, the principle of forest sustainability is at its core. The estimates of supply are those of existing approved forest management plans, all of which are based on long- term forest sustainability. Wood supply is determined through the forest management planning process, at the local level, as an outcome for planning for a broad set of economic, social and environmental objectives. None of the strategies can supersede or contravene any provision of the Crown Forest Sustainability Act. Consequently, they are limited to addressing wood supply issues within the parameters of forest sustainability as defined by the Act and its regulations.
Policy context
In Ontario, the Ministry of Natural Resources is the steward of Crown lands, waters and natural resources. Most of Ontario’s forests (82 percent) are owned by the Crown. Provincial commitments and responsibilities for the sustainable management of Ontario’s Crown lands and resources are expressed in the MNR vision, mission, broad objectives and desired outcomes.
The Policy Framework for Sustainable Forests (MNR 1994) provides the overall direction for an ecosystem-based approach to the management of Ontario’s Crown forests. The ministry’s commitment to forest sustainability is provided through Ontario’s key forest act – the Crown Forest Sustainability Act (CFSA). The CFSA requires that forest management plans be prepared for each designated management unit in accordance with the Forest Management Planning Manual, which is one of four regulated manuals under the CFSA. A forest management plan describes the forest management objectives and strategies applicable to the management unit while having regard to the plant life, animal life, water, soil, air, and social and economic values, including the recreational values and heritage values of the management unit. It is developed at the local level in an open and consultative fashion with the assistance of an interdisciplinary planning team and a local citizens committee. Direction for the writing of a forest management plan is also provided by a variety of guides and policies.
The Provincial Wood Supply Strategy responds to Condition #48 as set out in the Declaration Order Regarding MNR’s Class Environmental Assessment Approval for Forest Management on Crown Lands in Ontario (MNR-71). MNR worked directly with the forest industry and environmental non- governmental organizations during the development of this strategy. The Provincial Forest Policy Committee was also consulted and made recommendations on the development process.
The Forest Resource Assessment Policy (2003), commonly referred to as FRAP.
Figure 1: MNR’s Three Regions and the Area of the Undertaking
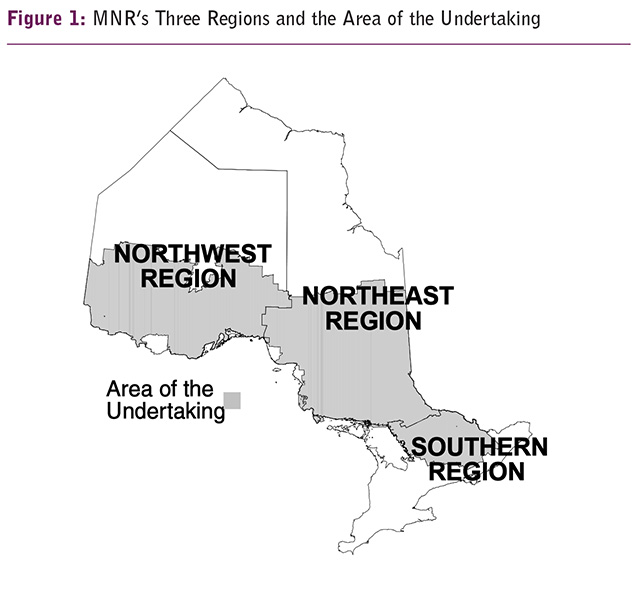
As indicated earlier in this document, the objectives of the Provincial Wood Supply Strategy are to sustain and, where possible, permanently increase wood supply for both industrial use and opportunities to grow parks and protected areas. The proposed policy framework for “Room to Grow” is a separate initiative which is linked to the Provincial Wood Supply Strategy. It is discussed in detail later in this section.
Two other initiatives with implications for the supply of wood to forest industry are currently under development. First, the Forest Sector Strategy is examining the potential impact that various large-scale and long-term influences will have on the commercial forest sector in Ontario. The objective of this project is to develop strategies and tactics to address the broader economic, commercial and social challenges and opportunities that will face the forest sector in the coming years. It will have a much broader scope than the Provincial Wood Supply Strategy.
The second initiative with implications for industrial wood supply is the Enhanced Forest Management – Science Information and Analysis initiative of the Provincial Forest Policy Committee. This project will focus on establishing a source of dedicated, long-term funding that will assist the government and the forest industry in better understanding silviculture effects and effectiveness (on growth and yield, environment, etc.) in order to maximize returns on silviculture investments. Action on this project will assist with the implementation of the strategies contained within this document.
Implementation of strategies
This initiative brings Ontario’s wood supply and demand information into one framework document, together with strategies for addressing challenges and capitalizing on opportunities. Specifically, the regional reports compare the supply forecasts from approved forest management plans against the current level of industrial demand in order to identify potential shortages and surpluses. Part 3 identifies the major wood supply issues, both current and forecast, and recommends strategies to manage them.
The wood supply strategies contained in this document will be implemented through normal channels, either as a part of the production and approval of forest management plans or through existing CFSA mechanisms. The strategies are in the form of recommendations to be considered during forest management planning, mill benchmarking exercises, licensing processes, research priority setting, or during the development of MNR or company policy. At the management unit level, appropriate strategies must be considered for inclusion in a forest management plan early in the planning process when wood supply issues are anticipated.
These represent MNR wood supply strategies and do not necessarily reflect those of any one community or forest company. Each company looks at its own supply picture and develops its own supply strategies. These strategies look at the bigger picture of wood supply across an entire region and not just one mill, one management unit or one company woodshed.
MNR holds responsibility for the stewardship of Ontario’s natural resources.
Although the management of Crown forests in Ontario is the responsibility of the provincial government, the majority of planning and forest management activities are carried out by the forest industry under licensing arrangements, on behalf of the Crown. Most of the strategies contained in this document will therefore be carried out by the forest industry or with the cooperation of industry. MNR will work with the forest industry to generate cooperative approaches to implementing the strategies. Some strategies will be implemented directly within the existing processes, such as forest management planning. Other strategies will require the development of new processes or partnerships for implementation. Many of the strategies will require collaborative efforts between MNR and forest stakeholders in a spirit of mutual benefit.
Most of the strategies will be implemented “on the ground” at a management unit or woodshed level. However, many of the strategies will be coordinated at a broader level – at the region or province – since the scope of the strategy is normally broader than the local area. As an example, local yield tables will be applied within a forest management plan, but the collection of information by MNR and the forest industry will be coordinated from the regional or provincial level. The scale of implementation and scope is described within each strategy.
While the wood supply strategies contained in this document are to be reviewed and revised periodically (as required by MNR’s Class EA for Forest Management), they may be revised at any time if an important wood supply issue arises. The supporting data are to be updated annually, as new management plans are approved and as existing Ministry Recognized Operating Levels (MROLs) are amended. A summary of the current Provincial Wood Supply Strategy will be provided in each five- year Environmental Assessment report.
The Ontario Forest Accord and Room to Grow Policy Framework
As mentioned above, the Provincial Wood Supply Strategy is directly linked to the Ontario Forest Accord and the Ontario Forest Accord Advisory Board’s (OFAAB) recommended “Room to Grow” policy framework. It is the Provincial Wood Supply Strategy that documents the harvest data and supply forecasts as well as the OFAAB benchmark, Table 1. The benchmark is an essential part of the data required for “Room to Grow” discussions.
The Ontario Forest Accord is an historic agreement signed in 1999 that resulted in the addition of 378 new parks and conservation reserves totaling 2.4 million hectares to Ontario’s system of parks and protected areas. The parties to the agreement were the forest industry, the Partnership for Public Lands and the Ministry of Natural Resources. The Partnership for Public Lands is a coalition of three environmental interest groups – the World Wildlife Fund, the Federation of Ontario Naturalists and the Wildlands League.
The accord set out 31 commitments under which the massive expansion of parks and protected areas would occur. One of the 31 commitments (Accord Item 7) called for a process to be developed for any permanent increase in wood supply in the future to be shared between increased wood supply for the industry and further expansion of Ontario’s parks and protected areas.
After the signing of the accord, the Minister named an advisory board to assist in its implementation. Known as Ontario Forest Accord Advisory Board, (OFAAB), this board was comprised of representatives from the three parties to the original agreement. As part of its mandate, OFAAB developed a “Room to Grow” policy framework for sharing any future increases in wood supply.
In developing its policy framework, OFAAB was confident that permanent increases would be made to Ontario’s wood supply and that there would be room to expand both parks and protected areas and Ontario’s forest industry. The policy framework sets out how these future increases in wood supply will be shared between these two interests, and focuses on achieving three objectives:
- To define the gaps in the parks and protected areas system;
- To benchmark and secure the long-term supply of wood necessary for industrial processing; and,
- To share any permanent increases in wood supplies between filling gaps in the parks and protected areas system, and meeting the growing needs of Ontario’s forest industry.
Table 1: OFAAB Benchmark Harvest Levels
| Species Group | NWR 1 | NER1 | SR1 |
|---|---|---|---|
| Spruce/Pine/Fir | 8,600 | 8,207 | 111 |
| White/Red Pine | 78 | 355 | 349 |
| Other Conifer | 24 | 27 | 19 |
| Poplar | 3,037* | 2,496 | 316 |
| White Birch | 95 ** | 229 | 70 *** |
| Tolerant Hardwoods | 0 | 241 | 383 |
| Total | 11,834 | 11,555 | 1,248 |
Note: Numbers presented represent the maximum utilization by region and species group between the period 1994 and 1999. (Source of data: TREES).
1MNR Administrative Region (000's m3/yr)
*NWR poplar benchmark includes 775,000 m3 of Crown commitments issued prior to March, 1999.
**NWR birch benchmark also includes 50,000 m3 of Crown commitments issued prior to March 1999.
***Correction to error which appears in the OFAAB Final Report benchmark table on page 13.
OFAAB chose the regional wood supply strategies as the instrument for benchmarking the fibre requirements of Ontario’s forest industry and for identifying the threshold that would initiate “Room to Grow” sharing discussions. Wood supply forecasting is not a precise science and OFAAB set the threshold 10 per cent higher than the industrial requirement benchmark as a safety margin to allow for errors. As the replacement for the regional wood supply strategies, the Provincial Wood Supply Strategy continues to benchmark the fibre supply requirements and the threshold level.
OFAAB defined the benchmark industrial wood requirement or wood supply as the highest annual harvest level that occurred during the five-year period ending March 31, 1999 for each of six major species groups, by region. This is the volume that OFAAB considered to be the basic wood supply requirement for Ontario’s forest industry. These benchmark wood supply volumes are shown in Table 1, by region and species group.
The Ontario Forest Accord and OFAAB’s proposed “Room to Grow” policy framework both contain important principles for securing the industry’s wood supply before further land withdrawals are made to expand Ontario’s parks and protected areas.
- Fundamental to the Forest Accord was the premise that there would be no long-term reduction in wood supply and no net increase in the cost of wood delivered to the mill as a result of the establishment of new parks and protected areas;
- The OFAAB “Room to Grow” sharing principles indicate that the sharing process is triggered when the long-term sustainable supply is above the sharing threshold (benchmark plus 10 per cent). (OFAAB, p.12);
footnote 6 - Decisions about sharing will be made at the forest management unit or woodshed level and must reflect the requirements of all licensees and companies having ministerial directives on that unit (OFAAB, p.14); and,
- Where sharing occurs, the process will be undertaken at the management unit and woodshed level and be designed to seek mutually beneficial solutions within the sprit and intent of the Accord (OFAAB, p.15).
The OFAAB baseline and the “Room to Grow” variables are presented in the wood supply graphs for each region in Part 2 of this report, and for each management unit and woodshed in Appendix 1. These data are current at the time of writing. The “Room to Grow” variables (the industrial benchmark, the sharing threshold and the long- term supply forecast) are to be updated annually. Long-term supply forecasts change as forest management plans are renewed. The industrial benchmark and associated sharing threshold may also change as “Room to Grow” sharing opportunities are realized. This updated information will be available upon request from the MNR’s Industry Relations Branch in Sault Ste. Marie.
MNR has accepted the OFAAB final report on “Room to Grow” and will complete a detailed implementation plan for the Forest Accord commitments, including identification of responsibilities and a proposed timetable. The Provincial Wood Supply Strategy may be adjusted pending the outcome of this implementation plan.
Methods and data sources
Each of the three regional reports within the strategy contain a comparison between the forecast of supply and the current demand level for each management unit, aggregated to the regional level. The data and analysis for each management unit, by species group, may be found in Appendix 1. Interested parties wishing to see the supply/demand situation for any one management unit are directed to Appendix 1.
The supply forecasts were taken directly from current approved forest management plans for each of the region’s management units. In each case the data source was the long-term forecast of available volumes, using the selected management alternative. The historical supply data that appears in bar form on the graphs in Part 3 were obtained from the management plans for each management unit for the two previous five-year terms. The historical harvest data, also in bar form on the graphs, was derived from provincial scaling data, both PTSBS and TREES.
On the demand side of the equation, the current Ministry Recognized Operating Levels for forest resource processing facilities (MROLs)
The OFAAB baseline for each of the three regions was determined by taking the highest annual volume cut in the five years ending March 31, 1999, for each of six species groups.
Assessment of the data reliability and the assumptions
Understanding the conclusions also requires an understanding of the data sources and their accuracy and reliability.
On the demand side, there is a strong degree of acceptance within the industry that MROLs accurately reflect current mill demand, but they do not necessarily represent future demand. The analysis in this document was done so as to determine the ability of the Crown forest to supply the existing industry. MROLs are considered to be accurate for this purpose. It is worth noting that MROLs established before 1999 are generally higher than actual consumption, a fact that should lead to an underestimate of surpluses, at least where surpluses have been forecast. Counterbalancing this to some degree is the fact that MROL data does not exist for very small mills (mills consuming less than 1,000 m3 annually)
It is important to point out that no attempt was made to forecast future demand levels, or to predict future trends in the forest products sector. Nor has the propensity of the industry to adapt to the type of wood that is available been factored in. In recent years new markets, new technologies and new methods have allowed the industry to produce highly desirable products from previously undesirable wood. This is perhaps the most important trend in wood utilization, both in Ontario and globally, and one that has prevented some of the supply shortages that have been predicted in the past from affecting the industry. This forecast of future demand and trends is outside of the scope of this strategy, however future demand and trends may be examined in other MNR initiatives such as the Forest Sector Strategy and may result in adjustments to the Provincial Wood Supply Strategy.
On the supply side, there is variability in the way individual management plans arrived at their long- term forecasts. All of them used current SFMM
Despite these challenges, it is safe to say that the major wood supply issues that have been identified are real issues and must be addressed. However, their magnitude and timing should not be considered precise. The quality of the information used to forecast long-term wood supply is identified in this document as one of the major issues, and several strategies are presented to address it. Refer to the Boreal Forest Issues and Strategies section found in Part 3 for more discussion on this topic.
Part 2. Regional reports
A. Northwest Region report
The forests of the northwest region
Northwest Region contains portions of two forest regions: the Boreal Forest and the Great Lakes-St. Lawrence Forest (GLSL). The Boreal Forest, accounting for the majority of area in Northwest Region, is characterized by extensive black spruce, jack pine, and balsam fir stands as well as mixed stands of conifer, poplar and white birch. Much smaller in extent, the Great Lakes-St. Lawrence Forest extends in a strip along the Ontario-Minnesota border west of Thunder Bay (see Figure 2) and features a diversity of conifer and hardwood species including white and red pine, red maple, yellow birch, and ash.
Three major species groupings are used in the Northwest Region to portray volume information: spruce-pine-fir (SPF), poplar and white birch (Po Bw), and white and red pine (Pw Pr). Most of the forest industry makes products that fall into these groupings. Examples are SPF lumber, SPF pulp and paper (Northern Bleached Softwood Kraft), poplar lumber, poplar oriented strand board, poplar pulp, and white or red pine lumber. White birch is used in pulp production and is just beginning to be used for lumber and consequently may warrant a separation from poplar as a grouping.
Wood processing facilities in the region are mostly large, commodity producing operations. Since the operations are so large, it has been left to the companies to make their own business arrangements to ensure appropriate species, log sizes, and log quality are delivered to the mills. For this reason, no attempt has been made to categorize species groups by product type.
Figure 2: Forest Regions of the Northwest
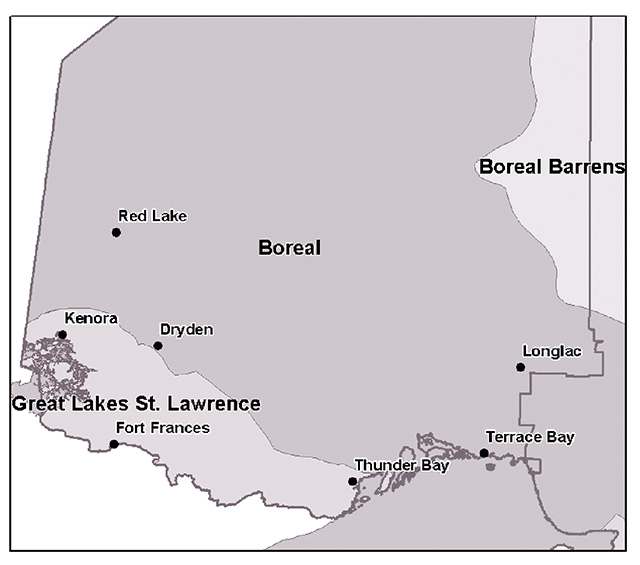
Enlarge figure 2: Forest Regions of the Northwest
The forest economy of the northwest region
Forestry is a key driver of the northern economy and is the major primary economic activity in Northwest Region. In this part of the province, the industry includes 13 sawmills (some of the largest in Ontario), 8 pulp and paper mills
A 1999 study completed by Lees and Associates
Figure 3: Communities with Mills in Northwest Region
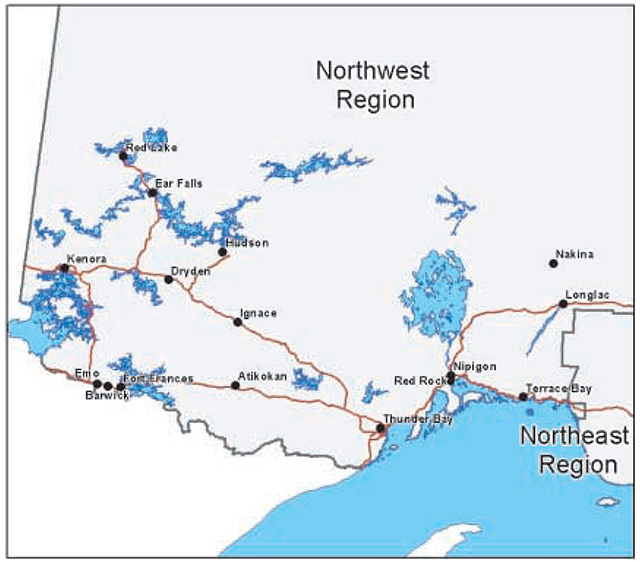
Enlarge figure 3: Communities with Mills in Northwest Region
The study estimated that 15,300 full-time equivalent jobs were provided by the forestry sector. Some 14,900 people were engaged directly in forestry activities, while 400 additional government workers were employed in related fields associated with forest management and fire fighting. Payroll and benefits were estimated at $1.0 billion annually.
The industry is a major purchaser of goods and services. The 1999 study estimated $800 million is spent annually on goods and services within the region, and about $250 million on capital improvements, of which about $50 million was retained within the regional economy. Indirect employment, generated as a result of these expenditures, suggested 1.25 indirect jobs would result from each direct job. This multiplier effect resulting from 15,300 direct jobs would produce an additional 19,100 full-time equivalent jobs for a total of 34,400 jobs directly and indirectly associated with the forest industry. Evidence of the significant impact of the primary forest industry in the north is provided by the number of single industry communities that are wholly reliant on this sector for the jobs it provides.
The 1999 study further estimated that each 1,000 m3 of wood harvested generated 3.1 person years of employment, $164,000 in expenditures for labour, goods and services, and $55,000 in industry contributions to government. This is further evidence of the importance of forestry to the economy of the region.
Table 2: Companies and Mills in Northwest Region
| Company | Location | Products |
|---|---|---|
| Abitibi-Consolidated Company of Canada | Fort Frances | SPF pulp and paper; Po pulp |
| Abitibi-Consolidated Company of Canada | Kenora | Spruce paper |
| Abitibi-Consolidated Company of Canada | Thunder Bay | Spruce paper |
| Ainsworth Engineered Corp. | Barwick | Po oriented strandboard |
| Atikokan Forest Products Ltd. | Atikokan | SPF lumber and chips |
| Bowater Canadian Forest Products Inc. | Thunder Bay | SPF and Po pulp and paper |
| Bowater Canadian Forest Products Inc. | Thunder Bay | SPF lumber and chips |
| Bowater Canadian Forest Products Inc. | Ignace | SPF lumber and chips |
| Buchanan Northern Hardwoods Inc. | Thunder Bay | Po and Bw lumber and chips |
| Cascades Fine Papers Group Thunder Bay Inc. | Thunder Bay | Fine paper |
| Devlin Timber Company (1982) Limited | Kenora | SPF lumber, Pw Pr lumber and chips |
| Fibratech Manufacturing Inc. | Atikokan | Po and conifer particleboard |
| Great West Timber Limited | Thunder Bay | SPF lumber and chips |
| Kenora Forest Products Ltd. | Kenora | SPF lumber and chips |
| Kimberly-Clark Inc. | Terrace Bay | SPF and Po pulp |
| Levesque Plywood Limited | Nipigon | Po Plywood |
| LKGH Contracting Ltd. | Red Lake | SPF lumber and chips |
| Long Lake Forest Products Inc. | Longlac | SPF lumber and chips |
| Longlac Wood Industries Inc. | Longlac | Po plywood and strandboard |
| Manitou Forest Products Limited | Emo | SPF lumber, Pw Pr lumber and chips |
| McKenzie Forest Products Inc. | Hudson | SPF lumber and chips |
| Nakina Forest Products Inc. | Nakina | SPF lumber and chips |
| Norampac Inc. | Red Rock | Linerboard |
| Northern Sawmills Inc. | Thunder Bay | SPF lumber and chips |
| Weyerhaeuser Company Limited | Dryden | SPF and Po pulp and paper |
| Weyerhaeuser Company Limited | Ear Falls | SPF lumber and chips |
| Weyerhaeuser Company Limited | Kenora | Po strand lumber |
The long-term forecasts for industrial wood supply and utilization in northwest region
Past harvesting, current demand, and future supply
The following section describes past harvesting, current demand and future supply issues in Northwest Region on the basis of the following major species groups:
- Spruce-pine-fir;
- Poplar; and,
- White birch.
Spruce-pine-fir
Figure 4 illustrates the relationship between wood supply and demand for spruce-pine-fir (SPF) at the regional level. It presents supply information obtained from forest management plans across the region, together with industrial demand and use.
This chart presents the dynamics of past use, current demand and future supply, all relevant factors in any discussion of wood supply and demand forecasting.
Historic Crown wood supply, shown as the black columns (red if viewed in colour version) on the graph, represents a summary of individual forest management plans averaged for the two five-year periods 1990-94 and 1995-99. This forecast suggests that Crown wood supply decreased during the decade of the 1990’s. The reduction is attributable in part to the impact of habitat management guidelines and the expansion of Wabakimi Park, which resulted in a smaller landbase for industrial forest use.
At the same time, however, actual wood utilization by the forest industry increased during the 1990's.
Figure 4: Comparison of Historical Forecast / Actual Harvest Levels with Current Demand and Future Harvest Wood Supply in Northwest Region – Spruce, Pine, Fir
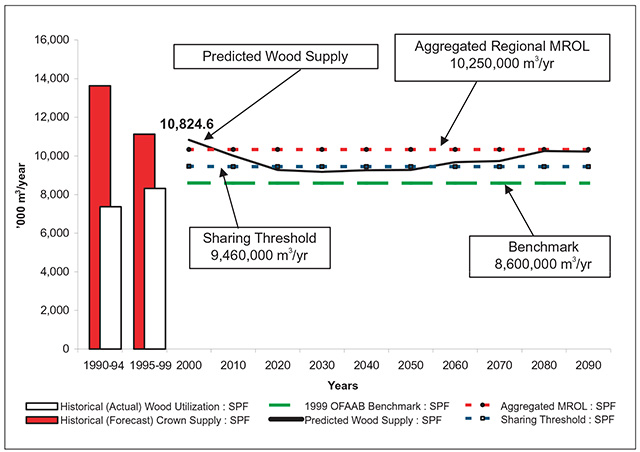
The two white columns in Figure 4 illustrate the increasing use of Crown wood as a result of additional capacity associated with both existing and new facilities constructed during the decade. The final phases of SPF facility expansion ended in 2003 as certain sawmills finished expansion projects that began in 1998.
The demand for Crown origin SPF in 2000 was 10,250,000 m3/year, and this volume has been projected forward as a continuous demand. Included in the demand figure are the requirements of new and expanding mills that remain under construction. There is a delay in the actual harvest levels until these facilities achieve their full operating potential.
This analysis makes no attempt to separate the demand for SPF by product type (pulp and sawlogs). The sawmills and pulpmills in the region are highly integrated, meaning that sawmills receive a high proportion of the roundwood from which lumber and chips for pulpmills are produced. This level of integration means that sawmills are able to sort through large volumes of logs and treelengths in order to separate the larger diameter pieces for lumber production. In addition, high volume sawmills have an increasing ability to utilize smaller diameter logs in specialized saw lines. In combination, these sawmill characteristics have had the effect of reducing the need to separate wood demand and supply by product types.
The SPF projected wood supply shows a small surplus in 2000 (difference between 10,824,600 and 10,250,000 m3) that is projected to disappear. A gap between supply and demand becomes apparent by the year 2015.
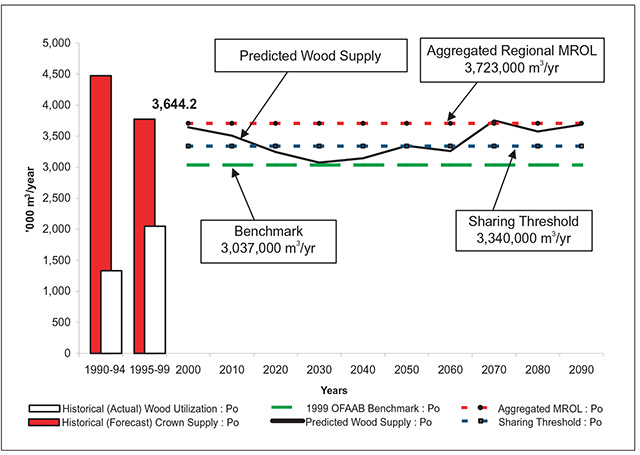
Poplar
The poplar comparison chart (Figure 5) is structured similarly to the SPF chart. However, there is a large difference between the average wood utilization in the 1995-99 period (approximately 2 million m3) and the current MROL level that is shown as 3.7 million m3. Since poplar had been under-utilized, a process was implemented to establish new facilities. The result was several new mills that boosted the poplar demand to the new level. The last of the new facilities is the strand lumber facility in Kenora, which was operational by October 2002. Actual poplar harvest levels will increase correspondingly as the mill achieves its operational potential during 2004.
Figure 5: Comparison of Historical Forecast/Actual Harvest Levels with Current Demand and Future Harvest Wood Supply in Northwest Region – Poplar
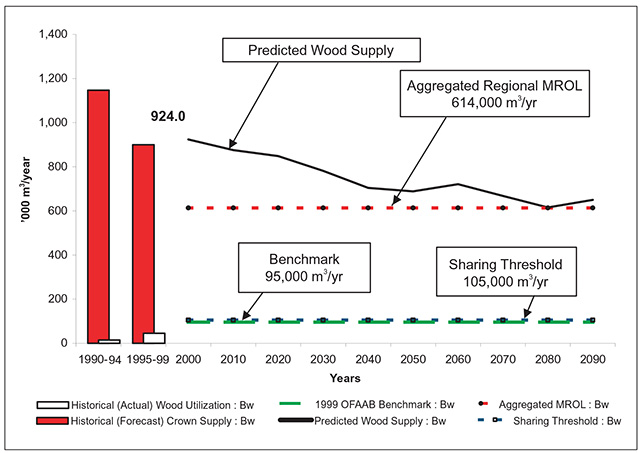
White birch
The comparison chart for white birch (Figure 6) shows a historically under-utilized species. The current demand for white birch is 614,000 m3/year and the industry is continuing to increase its use. The long-term supply of birch is greater than the demand, suggesting there is some room for growth in the use of this species.
The 1999 OFAAB benchmark was set very low in comparison to the current demand level. The process used to set the benchmark recognized the actual usage of birch during the 1995-99 period, which was much lower than the MROL levels. Actual usage of birch has continued to increase as those facilities to which the wood has been allocated have adjusted their processes accordingly.
Emerging utilization trends
In Northwest Region, there are a number of trends emerging with respect to wood utilization. Evidence suggests better use is being made of all boreal species. In addition, advances in harvesting technologies and mill diversification have had a profound influence on overall wood utilization throughout the region. These trends are discussed in detail under the following headings:
- Full Use of Allowable Harvest;
- Chips at Pulpmills;
- Integration Among Sawmills and Pulpmills; and,
- Increasing Utilization of the Available Harvest Volume.
Figure 6: Comparison of Historical Forecast/Actual Harvest Levels with Current Demand and Future Harvest Wood Supply in Northwest Region – White Birch
Full use of allowable harvest
Since 1994, MNR has been working toward the development of a full range of forest products and related economic opportunities throughout the Northwest Region. Unused volumes of timber were identified and businesses have been developed to use them. This has resulted in the building of new conifer sawmills at Ear Falls, Longlac and Nakina, a hardwood sawmill at Thunder Bay, a panel board mill at Barwick, a strand lumber mill at Kenora, and the expansion of conifer sawmills at Red Lake, Hudson, Atikokan, and Thunder Bay. While these new enterprises were being developed, the Wabakimi Park expansion was being finalized (1995) and Ontario’s Living Legacy was being implemented (1999). MNR’s development of economic opportunities and the expansion of Ontario’s system of parks and protected areas have resulted in a full allocation of the allowable harvest of the major species with the exception of white birch, which is approximately 50 per cent allocated.
Chips at sawmills
Pulpmills in Northwest Region have been increasing their capacity to accept chips instead of roundwood at the mill gate. With the exception of pulpmills that use grinders to produce pulp (spruce at Abitibi-Consolidated Company in Thunder Bay, Fort Frances and Kenora, and at Bowater in Thunder Bay; poplar at Abitibi-Consolidated Company in Fort Frances and Cascades Fine Papers in Thunder Bay), this has resulted in a very high proportion of pulpmills accepting only chips. The importance of this trend to the region as a whole is discussed more fully in the following section.
Integration among sawmills and pulpmills
Accepting chips at pulpmills has encouraged a high reliance on sawmills as a provider of raw materials.
When the recent Bowater sawmills are fully operational, about 72 per cent of the roundwood harvested in the region will pass through sawmills for conversion to lumber and chips. Before this development, sawmills had some difficulty selling all of the chips made during the production of lumber. This integration between sawmills and pulpmills has strengthened the sawmill industry by reducing uncertainty around the sale of chips, although it has increased the reliance of pulpmills on sawmills.
Increasing utilization of the available harvest volume
Bush chippers that convert full trees to chips by delimbing, debarking and chipping at the roadside allow almost all of the bole and larger branches of both conifer and poplar to be used. Despite the fact that extra care must be taken to separate sawlogs and veneer logs from treelengths before they are chipped, studies conducted by MNR for wood measurement and valuation purposes show that some 10 per cent more wood can be recovered from conifers, and up to 20 per cent more wood from poplar trees that are bush chipped.
The use of white birch has been increasing at pulpmills and in one sawmill in the region. The acceptance of birch sawmill chips by pulpmills has improved the economics of birch lumber production and white birch is expected to penetrate the lumber markets over time.
Throughout the region, mills have adjusted to changes in available wood supply. As a result of a limited supply of red and white pine, mills that relied on these species have diversified to others including jack pine and white spruce. In addition, larch that was once shunned by pulpmills has become a normal part of the conifer species used by some kraft pulpmills. Despite the fact that larch cannot be included by area sawmills in the SPF lumber definition, acceptance of larch has somewhat improved the wood supply in the region.
Overall, better utilization of tree species will lend itself to the development of merchandizing facilities (at mill yards or independent locations) where treelengths will be broken down into desirable products and then shipped to the appropriate mill. Likely merchandized products are veneer (mostly poplar and birch), sawlogs (mostly white, red and jack pine, white spruce, poplar and some white birch), oriented strandboard logs (poplar and white birch), and pulpwood of all species that may be shipped as roundwood or chipped. The smallest tops that were previously too short for transporting by pulp truck can be chipped and transported in vans. Merchandizing will not only get the right product and species to the right mill, it will also increase the total volume recovery from a harvested area.
B. Northeast region report
The forests of the northeast region
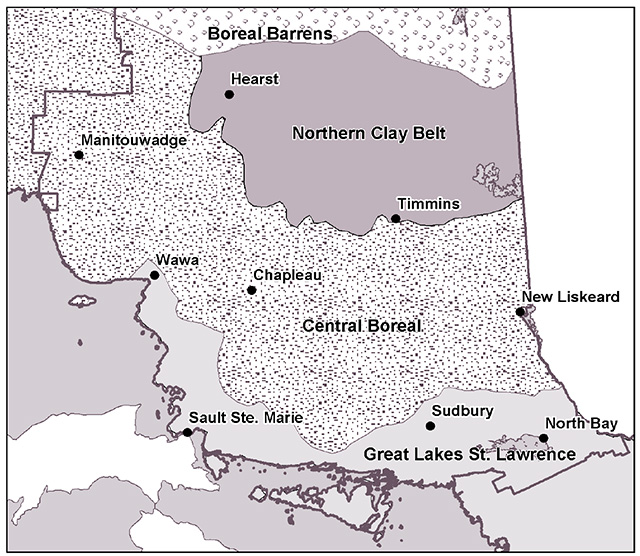
The forests of the Northeast Region include portions of three forest types: the Claybelt/ Northern Forest and the Central Boreal Forest, which both belong to the Boreal Forest Region, and the Great Lakes-St. Lawrence Forest Region (see Figure 7). These forest cover types conform to the broad soil and climatic zones found in this part of the province.
Claybelt/northern forest
This type of forest is defined by its deep lacustrine clay soils with organic accumulations on the lowland sites. It is dominated by large expanses of lowland black spruce in the north with an increasing proportion of uplands dominated by aspen poplar in the south. White birch, larch, balsam poplar and balsam fir are found to a lesser extent throughout the area. Infrequent areas of sandy and coarse soils are dominated by jack pine.
Over the last 100 years, human activity (settlement, fires and logging in particular) has had a profound effect on the forests of this area. One result is the increased prevalence of poplar in the region. During the 1980s and 1990s, forest managers set planning objectives to reverse this trend through active conifer silviculture programs. There has, however, been an increasing emphasis on natural regeneration and mixed wood management in the last five years.
The forest tent caterpillars have heavily defoliated the aspen forests in this area over the past several years. This defoliation has been linked to approximately 450,000 ha of severely declining aspen. As of this writing, the full impact on long term poplar wood supply in the region has yet to be determined.
Central boreal forest
The Central Boreal Forest region is characterized by till deposits, sands, and coarse soils, together with frequent rock outcrops and ridges. Here a moderate climate prevails and growing conditions tend to be more favourable and more productive than the claybelt described above.
Mixed forests of conifer and hardwoods dominate the landscape, together with extensive forests of even-aged jack pine on well-drained sandy soils. This forest area contains a greater diversity of tree species than the claybelt and includes a significantly larger proportion of white birch. Toward the southern reaches of this area, the forest exhibits a transition toward species found in the Great Lakes-St. Lawrence Forest. Here, white and red pine and hard maples are found in scattered locations.
Figure 7: Forest Regions of Northeast Region
Similar to the claybelt, the central boreal forest has succeeded toward a higher proportion of hardwoods, including both white birch and poplar. Limited silvicultural activity following forest harvesting during the period from about 1900 to about 1975 produced sizeable areas of degraded, low-volume hardwood forest.
Silvicultural activity and the success of forest regeneration programs has increased significantly since the 1970s. This positive trend began with larger silvicultural budgets as a result of the Forest Production Policy of the 1970s, and continued with the signing of Forest Management Agreements in the 1980s and the advent of the Forest Renewal Trust Fund in the 1990s.
Great Lakes-St. Lawrence forest
The Great Lakes-St. Lawrence Forest is characterized by a transition from boreal forest types in the north, to increasing amounts of white pine/red pine and tolerant hardwoods in the south. The underlying geology consists of deep till soils and rocky broken terrain with shallow coarse soils. While the area contains a diverse mix of species, many of the tolerant hardwoods are of low grade. This has resulted from past high-grading practices and the fact that the hardwoods are located near the northern limit of their climatic range.
Over the past 100 years or more, the amount of white and red pine has been greatly reduced as a result of three key factors:
- Reduced fire prevalence in the forest, which leads to succession toward tolerant hardwoods;
- Past harvesting practices which concentrated on removing high-value trees; and,
- A subsequent lack of regeneration of the pine.
The issue of white and red pine regeneration has been addressed in recent forest management plans with objectives included for pine restoration. However, the existing pine resource is old and not as prevalent as in the past. Hard maple and yellow birch stands have been degraded through successive high-grading operations. This has begun to be addressed within the last 10 to 20 years through the establishment of proper tree-marking standards and stand improvement efforts. This change in management means there will be a continued shortage of sawlog supply relative to the amount of low-grade hardwoods, at least for the short term, but the supply should improve in the long term.
Species groups and product categories
There are five major species groupings that are used in the Northeast Region to portray volume information: spruce-pine-fir (SPF), poplar (Po), white birch (Bw), white and red pine (Pw/Pr), and tolerant hardwood (Mh/By). Most of the forest industry makes products from these species groupings. Examples are SPF lumber, SPF pulp and paper (Northern Bleached Softwood Kraft), poplar veneer panels, poplar oriented strandboard, poplar pulp, white or red pine lumber, and maple and birch veneer and lumber. A small proportion of white birch has traditionally been harvested for veneer, but this species is just beginning to be used for OSB and other specialty products.
Wood processing facilities in the region are mostly large, commodity-producing operations. Since the operations are so large, it has been left to the companies to make their own business arrangements to ensure the appropriate species, log sizes and log quality are delivered to the mills. For this reason, no attempt has been made to categorize species groups by product in this part of the report. However, MNR staff do work with individual companies to ensure wood directives set out by the Minister are met, when this becomes a concern. Although there is some consensus on product quantities or percentages in some sectors, this information has not generally been incorporated into forest management planning, and so this product information is not consistently available for our analysis of wood supply in the Northeast Region. Therefore, product supply issues have not been closely examined in building the Northeast strategies. This issue may be investigated in future versions of the strategies and has been included in Part 5 on Future Considerations.
The forest economy of the northeast region
Forestry is a key driver of the northern economy and the forest industry is the major primary economic activity in the Northeast Region. In this part of the province, the industry includes 24 sawmills (ranging from large SPF mills to small hardwood mills in the southern part of the region), five pulp and paper mills, three oriented strandboard mills, six veneer/veneer panel mills, and three composite board mills. See Figure 8 and Table 3 for the location and brief description of significant Crown wood-using facilities. A more extensive listing of forest resource processing facilities in Ontario is currently available on MNR’s Ontario’s Forests website within the forest industry page. In addition, woodlands, harvesting, transportation and silviculture operations occur throughout the region.
The forest industry is a significant employer in the majority of the communities throughout Northeast Region. Not only does the industry offer its employees relatively secure employment tenure, but it pays well and produces significant economic spin-off benefits to virtually every community in the region.
The industry is also a major purchaser of goods and services and often an important supporter of communities through both the tax base and voluntary contributions. In 1999, a study was completed by Lees and Associates that examined the economic contribution of the primary forest products industry to Northwestern Ontario. The study estimated that each 1,000 m3 of wood harvested generated 3.1 person years of employment, $164,000 in expenditures for labour, goods and services, and $55,000 in industry contributions to government.
Figure 8: Communities with Mills in Northeast Region
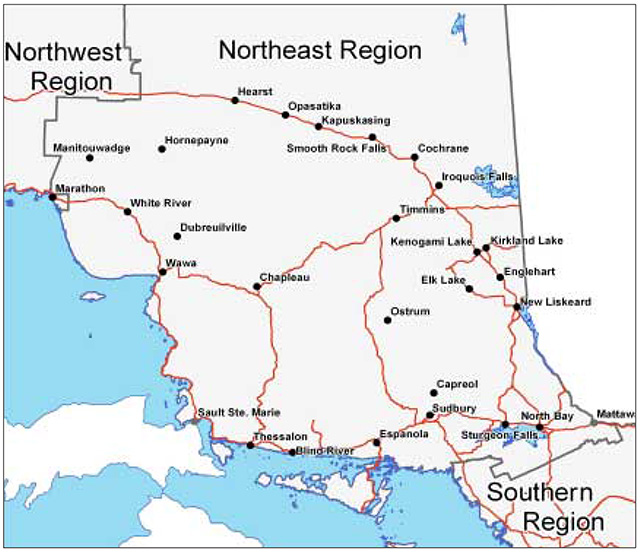
Table 3: Companies and Mills in Northeast Region
| Company | Location | Products |
|---|---|---|
| Abitibi-Consolidated Company of Canada | Iroquois Falls | Spruce newsprint and paper |
| Birchland Veneer Limited | Thessalon | Maple & birch veneer |
| Boniferro Mill Works Inc. | Sault Ste. Marie | Maple, birch & oak lumber |
| H & R Chartrand Limited | Noelville (Sudbury) | SPF & white/red pine lumber |
| Cheminis Lumber Inc. | Larder Lake (Kirkland Lake) | SPF lumber and chips |
| Levesque Plywood Limited | Hearst | Hardwood overlay plywood; poplar and birch veneer |
| Levesque Plywood Limited | Hearst | Particle board |
| Columbia Forest Products Ltd. | Rutherglen (Mattawa) | Maple & birch veneer |
| Domtar Inc. | Espanola | Softwood and hardwood bleached pulp |
| Domtar Inc. | Nairn Centre (Espanola) | SPF lumber and chips |
| Domtar Inc. – McChesney Division | Timmins | SPF lumber and chips |
| Domtar Inc. | Chapleau | SPF lumber and chips |
| Domtar Inc. | White River | SPF lumber and chips |
| Dubreuil Forest Products Limited | Dubreuilville | SPF lumber and chips |
| Elk Lake Planing Mill Ltd. (Liskeard Lumber & Domtar) | Elk Lake | SPF lumber and chips |
| Excel Forest Products | Opasatika | SPF lumber and chips |
| Extreme Timber | Mattice (Hearst) | Cedar mill (shingles) |
| Forest Ply Industries | Blind River | Poplar and softwood veneer plywood |
| R. Fryer Forest Products Limited | Monetville (Sudbury) | White/red pine, maple, birch & SPF lumber |
| Gervais Forest Products Ltd. | Falconbridge (Sudbury) | Maple, birch, white/red pine & SPF lumber |
| Gogama Forest Products Inc. | Ostrom | SPF lumber and chips |
| Goulard Lumber (1971) Ltd. | Sturgeon Falls | White/red pine and SPF lumber |
| G-P Flakeboard Company | Sault Ste. Marie | MDF panels |
| Grant Forest Products Inc. | Timmins | Poplar and birch oriented strandboard |
| Grant Forest Products Inc. | Englehart | Poplar and birch oriented strandboard |
| Isidore Roy Limited | Sturgeon Falls | SPF and white/red pine lumber |
| Lahaie Lumber Ltd. | Alban (Sudbury) | White/red pine, SPF, maple & birch lumber |
| Lecours Lumber Co. Limited | Calstock (Hearst) | SPF lumber and chips |
| Little John Enterprises Ltd. | Timmins | SPF lumber and chips |
| Mainville Lumber Company Limited | Chelmsford (Sudbury) | SPF & white/red pine lumber |
| Marathon Pulp Inc. | Marathon | SPF & poplar kraft pulp |
| Midway Lumber Mills Ltd. | Thessalon | Maple, birch, white/red pine & SPF lumber |
| Olav Haavaldsrud Timber Company Ltd. | Hornepayne | SPF lumber and chips |
| Nipissing Sawmill Ltd. | North Bay | Maple, birch, white/red pine & SPF lumber |
| Norbord Industries Inc. | Cochrane | Hardwood overlay plywood |
| Northern Pressure Treated Wood Ltd. | Dobie (Kirkland Lake) | Poles & lumber – red & jack pine |
| Pineal Lake Lumber Company Ltd. (Mason Windows) | Chapleau | Specialty white pine lumber |
| Portelance Lumber (Capreol) Ltd. | Capreol | White/red pine & SPF lumber |
| Precut Hardwood Inc. | North Bay | White birch pallet stock & fire wood |
| St.Marys Paper Ltd. | Sault Ste. Marie | Spruce, fir and poplar supercalendered paper |
| Superior Hardwood Veneer Ltd. | Sault Ste. Marie | Maple & birch veneer |
| Tembec Industries Inc. | Smooth Rock Falls | SPF kraft pulp |
| Tembec Industries Inc. | Cochrane | SPF lumber and chips |
| Tembec Industries Inc. | Kapuskasing | SPF pulp and paper |
| Tembec Industries Inc. | Kapuskasing | SPF lumber and chips |
| Tembec Industries Inc | Hearst | SPF lumber and chips |
| Tembec Industries Inc. | Kenogami | SPF lumber and chips |
| Tembec Industries Inc. | Mattawa | Maple, other tolerant hardwoods, white birch, white/red pine & SPF lumber |
| Tembec Industries Inc. | Timmins | SPF lumber and chips |
| Tembec Industries Inc. | Chapleau | SPF lumber and chips |
| Uniboard New Liskeard Inc. (Rexwood) | New Liskeard | Composite board |
| Weyerhaeuser Company Ltd. | Limer (Wawa) | Poplar & birch oriented strandboard |
The long-term forecasts for industrial wood supply and utilization in northeast region
Past harvesting, current demand, and future supply
The following section describes past harvesting, current demand and future supply issues in Northeast Region on the basis of the following major species groups:
- Spruce-pine-fir;
- Poplar;
- White birch;
- White pine/red pine; and,
- Tolerant hardwoods.
Spruce-pine-fir
The wood supply and demand chart, (see Figure 9), illustrates the relationship between wood supply and demand for spruce-pine-fir (SPF) at the regional level. It presents supply information obtained from forest management plans across the region, together with industrial demand and use information.
Crown wood supply, shown as the black columns (red if viewed in colour version) on the graph in Figure 9, represents a summary of individual forest management plans averaged for the two five-year periods 1990-94 and 1995-99. The five-year wood supply projections have been steadily declining for the past decade. This decline in available harvest volume is attributed to five factors:
- Land withdrawals from the area available for forest management;
- New forest management guidelines;
- More rigorous application of existing guidelines;
- Past harvesting and silviculture practices; and,
- An aging forest and a consequent general decline of merchantable volumes due to an overmature forest.
At the same time however, actual harvest level has been increasing during the 1990's (white columns on graph). This reflects a general trend toward more complete utilization of the available supply, stronger market demand, and better prices for lumber and paper.
The demand for SPF in the Northeast Region was 8,366,000 m3/year in 2000, (based on MROLs), and this volume has been projected forward as a continuous demand. The SPF wood supply currently equals the demand. Within five years, however, wood supply, based on current modelling, is predicted to decline below demand.
The gap that has been forecast between wood supply and the industrial demand for fibre has been recognized and debated for the last decade or more.
Figure 9: Comparison of Historical Forecast/Actual Harvest Levels with Current Demand and Future Harvest Wood Supply in Northeast Region – Spruce, Pine, Fir
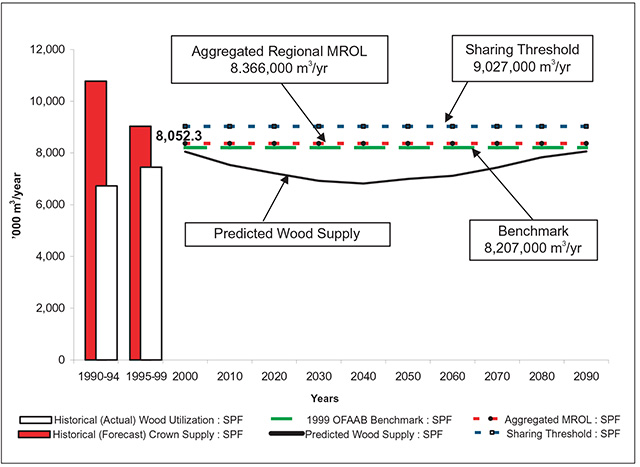
While it results from a number of factors, the fundamental reason for this approaching gap is a significant age class imbalance. The dominant age class on the landscape of Northeastern Ontario has been mature and is now slipping from mature to over-mature. The level of industrial wood consumption has increased over the past 50 years in response to this abundance of mature forest. The philosophy has been “use it rather than lose it to natural decline.” Forest managers have attempted to achieve a balance, at the management unit level, between consuming the surplus of old wood, retaining a consistent supply of wood in the long term and retaining mature forest for non- consumptive forestry objectives. Even so, forest management plan modelling forecasts that the existing industrial capacity will exceed the supply of wood beginning about 10 years hence.
The predominance of old forest in the region stands in marked contrast to the relative scarcity of mid- aged forest (i.e. 20 to 60 years old). Ironically, this aging of the forest can be related to a conservative approach to wood supply in the first half of the century together with an aggressive and successful fire suppression strategy. Prior to 1970, human disturbance in the forest through timber harvesting was considerably less than today, while fire control has reduced the natural renewal of forests over the past 50 years. Less human disturbance in the forest meant that forests were not renewed at today’s levels. Rates of forest renewal prior to 1980 were insufficient to produce the supply of young conifer forest that will be needed to sustain current utilization levels during the next 20 to 40 years. As a result, forest managers will need to be innovative to maintain current wood supply levels. The strategies included in this document will assist with this innovation. Individual companies will address the forecast wood supply shortages through their own sets of strategies.
There are a number of factors that influence the relationship between wood supply and demand. Some of these include:
- Economic, social and technological changes;
- Policy decisions;
- Changes in inventory, growth and yield estimates; as well as,
- Impacts resulting from international market forces.
Economic and technological changes can affect wood supply by increasing the utilization of available fibre (e.g. smaller tops, harvesting of low volume stands and utilization of species like white birch). However, societal demands can also influence the supply and demand equation if concerns are raised respecting industrial use of the public forest resource. The movement toward ecosystem-based management of the forest has reduced the supply of wood available to industry. For example, it has led to more protected areas, an emphasis on wildlife habitat management and the retention of older forest age classes.
There has been growing societal pressure to increase the protection of non-timber values and accommodate the needs of other users of the forest. The resulting policy changes affect wood supply and demand. The development of new forest management guidelines, together with the more rigorous application of existing guidelines has reduced available wood supply in the past, and may be expected to depress future wood supply as new forest management plans are written. Future policy changes or increases in wood utilization are not commonly factored into wood supply modelling for forest management planning. The strategies presented in Part 3 look at opportunities both to fill the gap between supply and demand and to replace volume that may be lost to industry as a result of future policy changes.
The relationship between wood supply and demand is also affected by changes in inventory, growth and yield estimates, and methods of analysis. Methods of analysis have become increasingly complex as managers apply advanced modelling techniques to document the interaction of natural and human forces in the forest. The development of spatial decision support systems may be expected to bring new changes to the supply equation.
In addition to economic, technological and social change and changes to the policy and analytical environment, wood supply and demand is affected by international market forces. In Ontario, as elsewhere, the wood products industry competes in an international market to sell its products. The industry must constantly strive to improve its efficiency and increase its productive capacity in order to survive. These efforts require continued operational improvements in efficiency and effectiveness at the individual mill level and may lead to requests for an increase in total fibre supply, an increase in mill productivity, or a rationalization of wood flow among mills. Forest industry certification is increasingly affecting how industry operates in the forest and may have an influence on wood supply.
Supply numbers are determined by a consultative process that involves setting objectives, conducting forest management modelling, and analyzing management alternatives on individual management units. Each management unit has its own characteristics, marked by times of surplus and supply shortages. Individual mills will be challenged to address the supply surpluses and shortfalls. While this report recognizes these challenges, it focuses on region-wide strategies and does not address individual mill supply issues. However, the strategies will often be implemented at the local level and will help mitigate local supply issues.
For the Northeast Region, the approaching gap between wood supply and demand is most significant for the conifer-based industry. Similar concerns however, are also an issue for the poplar-based industry. These challenges are discussed in detail below.
Poplar
As illustrated in Figure 10, the relationship between wood supply and demand for poplar is similar to that of SPF, with an anticipated supply gap occurring within 15 years. The reasons for this supply gap are the same as those described above for the SPF supply gap. However, there are nine significant differences between these two major species groups:
- Shorter History of Harvesting: Poplar harvesting began about 40 years ago and only became significant in the past 20 years. The knowledge of silvics and growth and yield for this species is also more recent. Generally, poplar was given little management attention until the beginning of the 1990s.
- Harvesting and Silviculture Practices: Harvest and silviculture practices for all species groups from the 1920s to about 1980 created a greater presence of poplar and birch on the landscape, both in pure and mixed forest stands. This has created a variety of mid-age forests. Some stands are well-stocked and very productive, while others are poor quality, low-volume stands growing off-site or degraded through past high-grading practices.
- Rapid Decline in Poplar: Poplar forests tend to break-up and lose both quality and volume rapidly once they pass maturity. As a result, poplar generally does not store well on the stump, although there are large geographic differences with respect to age of decadence. This characteristic of rapid decline accentuates the problem of determining reliable volume estimations as upland boreal forests age.
- Forest Management Dynamics: Mixed forests of poplar and conifer are important to the supply for both species groups and are often the most productive sites in the boreal forest. Because the consuming mills generally use only one species group, there is an ongoing tension over the management of these forest types. The management and dynamics of these forest types are more complex and less understood than those of the pure species forest types.
- Large Areas of Decadent Poplar: Large areas of poplar which developed after massive fires in the early part of the 20th century are beginning to become decadent. They will pass quickly through forest succession processes over the next 20 years.
- Implications of Poplar Decline: The forest tent caterpillar has unexpectedly become a significant factor in the health of poplar. Poplar stands across extensive areas of the Claybelt Forest of the northeast have experienced 60 to 90 per cent mortality. There are indications that this infestation is continuing to move throughout the northeast and may cause unprecedented reductions in poplar wood supply. Analysis carried out in 2001 indicates a supply reduction of about 150,000 m3 during the low point in the supply forecast - about 20 years hence. Surveys conducted in 2002 and 2003 indicate a further one-third increase in area of poplar decline each year and therefore a further reduction in long- term wood supply. The degree of the long-term impact on poplar supply is uncertain and needs to be further investigated. The success of poplar regeneration in the areas of decline is also needs to be assessed. Natural regeneration of poplar cannot be assumed in these areas of poplar decline since the root systems of the mature trees are usually depleted of their energy reserves.
- Commitments to Industry: Poplar commitments to industry were greatly increased during the 1990s. That capacity has not been completely realized. Although supply does not drop below the OFAAB Benchmark or Sharing Threshold, it does drop below the level required to meet current industry commitments.
- Poplar Supply & Commitments: When examined on a regional basis, both the projected supply of poplar and the poplar commitments to industry exceed the OFAAB Benchmark and Threshold level for sharing under the “Room To Grow” policy framework. (See the discussion of birch below.)
- Private Land Wood Supply: From the 1990s to the present, the industry using poplar in the Northeast has consistently substituted wood harvested from private land for Crown sources. This unregulated harvest on private land may not be sustainable, and the industry will likely require the full use of its Crown poplar commitments within a few years. In the meantime, Crown commitments are not being fully utilized.
Figure 10: Comparison of Historical Forecast/Actual Harvest Levels with Current Demand and Future Harvest Wood Supply in Northeast Region – Poplar
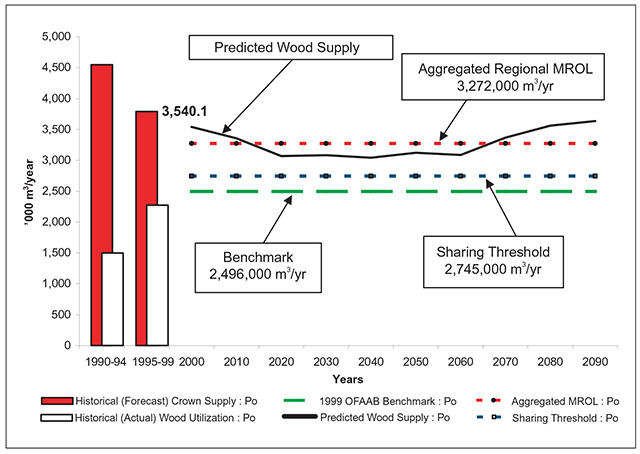
Poplar shares many of the same supply problems as SPF, in particular, the age class imbalance. While poplar grows and regenerates quickly after harvest, it also declines quickly, resulting in supply predictions that are less certain.
In the Northeast Region, poplar is used for veneer (i.e. plywood), composite (i.e. OSB), and pulp. Although this report has not differentiated between these products, individual forest management plans set objectives for each of these product types. Shortages of veneer supply are likely to occur before any shortages in composite or pulp material. This is the result of the aging and decline of the current poplar resource, combined with the probability of a reduced age of harvest in the future. As with the conifer based industry, economic and technological changes are expected to increase the use and utilization of available fibre.
White birch
The comparison chart for white birch (Figure 11) shows a historically under-utilized species. Attention to its growth and yield, and its management, lag behind both SPF and poplar. Supply estimates are consequently less reliable than the other major commercial species.
A large amount of the white birch in the Northeast Region exists in high-graded stands and poor quality second-growth forest, or low-quality stands growing on shallow soils. Some of the forecast wood supply decline noted in Figure 11 is due to objectives within forest management plans to convert these poor quality forest areas to conifer and mixed woods.
Figure 11: Comparison of Historical Forecast/Actual Harvest Levels with Current Demand and Future Harvest Wood Supply in Northeast Region - White Birch
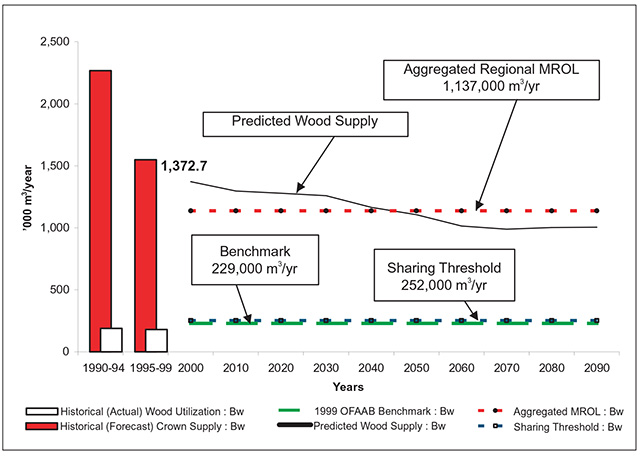
The majority of the birch demand, shown as the regional MROL, involves recent commitments to industry. This industrial use is forecasted and mill capacity is not yet in place, causing a short-term surplus of this product. Traditionally, birch areas have been harvested both for the conifer content within the stands and the small percentage of veneer quality logs – often less than one per cent – but not the lower grade of logs. The majority of the birch has not been used in the past. However, the trend toward complete utilization of the birch resource will produce opportunities for better quality birch regeneration. This change will also increase the amount of SPF and poplar produced as incidental volume.
The Ontario Forest Accord Advisory Board benchmark for white birch is set at 229,000 m3/year in the Northeast Region. Since the long-term harvest supply for this species exceeds the “Room to Grow” threshold by a factor of more than four times, there may be implications for sharing wood supply as described in the “Room to Grow” policy framework. This may have implications for the projected industrial supply of this species. A similar situation exists for poplar and white and red pine in the Northeast Region. Discussions on sharing for these species may proceed once the Forest Accord implementation package and details have been finalized and approved.
White pine/red pine
The occurrence of white and red pine across the region is limited. However, it is a significant high- value product for a number of sawmills in the Highway 17 corridor between North Bay and Sault Ste. Marie. The current demand for sawlog quality pine exceeds supply, even though Figure 12 indicates supply and demand are approximately equal. The advanced age and marginal state of the pine resource has created a high ratio of cull and pulp grade wood compared to sawlogs. With a limited pulp market, there is a surplus of low-grade pine.
Figure 12: Comparison of Historical Forecast/Actual Harvest Levels with Current Demand and Future Harvest Wood Supply in Northeast Region - White Pine/ Red Pine
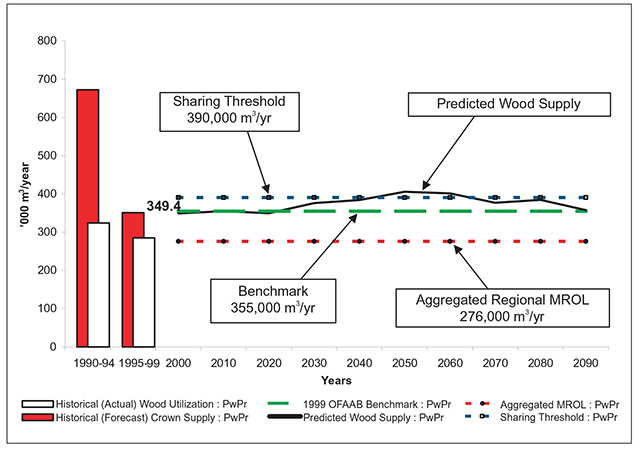
Figure 12 indicates that the predicted wood supply approximately equals the sharing threshold. Unfortunately there is a small surplus of low-grade pulp wood and a real shortage of sawlog pine. Also, a significant proportion of the pine in the Northeast Region has been harvested traditionally from non- pine stands (i.e. incidental within other forest types), and this pine is becoming increasingly unavailable because of tree retention guidelines. This will further accentuate the future shortage of sawlog pine.
Although pine remains an important part of the sawmill business, most mills in the Northeast Region that traditionally relied on white and red pine have diversified to a wide range of species including jack pine and white spruce.
Tolerant hardwoods
Like white and red pine, tolerant hardwoods make up only a small part of the Region’s forests, accounting for less than five per cent of wood supply overall. The productive tolerant hardwood sites occur only in the Great Lakes-St. Lawrence Forest along the southern fringe of the Northeast Region, as shown on Figure 13. For many years, tolerant hardwoods have been the source of supply for sawmills and veneer mills along the Highway 17 corridor, stretching from Mattawa to Sault Ste. Marie.
Figure 13 shows the current hardwood supply to be well above the level of demand, and well above the “Room to Grow” Sharing Threshold. As in the Southern Region, however, this surplus is confined to low-grade hardwoods, while veneer and sawlog supply is in a deficit situation. The problem stems from the fact that these species are growing at the northern extremity of their range, where log quality is generally poor. This deficit has been aggravated by high-grade logging practices used in the past. Today, proper tree marking and stand management practices have further constrained the short-term veneer and sawlog supply for the remaining facilities, since application of these practices have increased the ratio of pulp wood to sawlogs.
The solution to the veneer and sawlog shortage lies in developing new markets for the surplus low- grade material. The recent NE/SC Hardwood Project was unsuccessful in its attempt to attract new industries to use this surplus wood, or to have one of the existing pulp users expand production.
A more complete discussion of tolerant hardwoods may be found in the Southern Region section of this document. Part 3 contains strategies developed for the hardwoods and pines of the Great Lakes-St. Lawrence area of the Northeast Region. The issues and strategies for tolerant hardwoods and white and red pine may be examined more thoroughly in future versions of the Provincial Wood Supply Strategy.
Emerging utilization trends
In the Northeast Region, there are a number of trends that are emerging with respect to wood utilization. Evidence suggests better use is being made of all species. In addition, advances in harvesting technologies and mill diversification have had a profound influence on overall wood utilization throughout the region. These trends are discussed more fully under the following headings:
- Full Use of Allowable Harvest;
- Chips at Pulpmills & Integration With Sawmills;
- Increasing Utilization; and,
- Minor Species.
Full use of allowable harvest
Since the early 1990s, MNR has been working toward the development of economic opportunities related to a full range of forest products. Unused volumes of timber were identified throughout the Northeast, and business opportunities have been developed to use the wood. This has resulted in the expansion of sawmills, strandboard mills and panel mills throughout the region. While these new enterprises were being developed, Ontario’s Living Legacy was being implemented beginning in 1999, and Ontario’s system of parks and protected areas was being expanded. MNR’s development of economic opportunity and expansion of Ontario’s system of parks and protected areas have resulted in a full allocation of the allowable harvest of the major species, with the exception of low-quality birch, tolerant hardwoods and other conifers. Work continues on the full utilization of these species.
Chips at pulpmills and integration with sawmills
Pulpmills in Northeast Region have been increasing their capacity to accept chips instead of roundwood at the mill gate. Some pulpmills have moved toward accepting only chips. This has encouraged a high reliance on sawmills as a provider of raw materials. Before this development, sawmills had some difficulty procuring the best logs for sawmilling as well as selling all of the chips made during the production of lumber. This integration between sawmills and pulpmills has strengthened the sawmill industry by reducing uncertainty around the sale of sawmill chips. However eliminating wood rooms from pulpmills has created an unprecedented reliance by the pulp and paper industry on the sawmills. The relationship between sawmills and the chip- consuming pulpmills requires a careful balance and a recognition of the role that external market forces may play. The integration between pulpmills and sawmills also helps to resolve individual management unit and product shortages. The intention of the strategies is to help ensure that there is a sufficient supply of wood overall, regardless of destination.
Figure 13: Comparison of Historical Forecast/Actual Harvest Levels with Current Demand and Future Harvest Wood Supply in Northeast Region - Tolerant Hardwoods
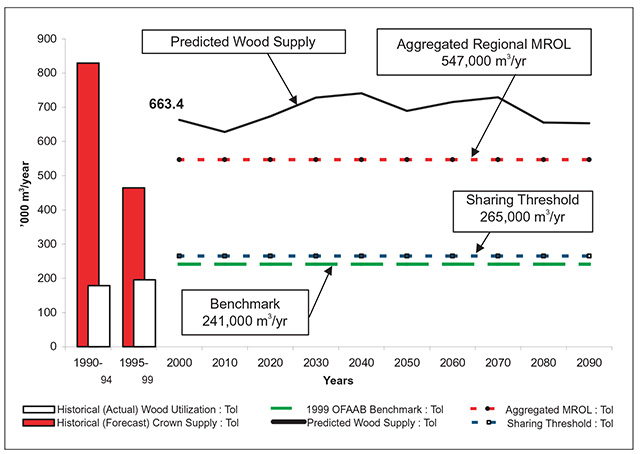
Increasing utilization
Unlike the Northwest Region, roadside chippers are not commonly used in the Northeast Region. Here, the forest industry has demonstrated its ability to increase its level of utilization through the use of tops (beyond what is required by the scaling manual.) This has increased the available volume of SPF to pulpmills by 5 to 10 per cent. However, there have been operational difficulties in fully utilizing the available material. Poplar stems often branch out into a heavy crown at a large diameter, making further utilization infeasible. Branches and very small diameter tops cannot be used by existing industries. While industry has increased its use of poplar tops overall, utilization varies depending on the nature of the operation and the harvested trees. Changes in market conditions have recently reduced the level of utilization of this top material, particularly for SPF. The level of utilization is highly variable depending on location and time and is not well understood.
In the Northeast Region, there has been a trend toward processing all species at roadside into fixed log lengths (e.g. 8 foot, 14 foot, or 16 foot). This is being done in an effort to increase the efficiency of sawmills and board mills, but often leads to incomplete utilization of available fibre. The level of utilization can be improved as techniques for this new trend are further developed. A strategy for improving utilization is discussed in the next section of this report.
White birch is the last major species for which markets have been developed. Its use has been increasing at pulpmills, OSB mills and, to a lesser extent, sawmills in the region. The acceptance of birch sawmill chips by pulpmills has improved the economics of birch lumber production and white birch is expected to penetrate the lumber and composite products market over time.
Minor species
Larch has historically been shunned by pulpmills but it has become one of the conifer species used by some kraft pulpmills. Despite the fact that larch cannot be included in the SPF definition for lumber by most of the sawmills in the region, acceptance of larch led to a minor improvement to the wood supply picture in this part of the province. The increased use of larch as a specialty product has real potential, given the interest in alternatives to preserved wood products.
Cedar utilization has suffered from variable levels of demand, as well as an uncertainty over its capacity to be managed sustainably. Although the silviculture and growth of cedar needs to be better understood, there is potential for increased use of this tree. It has good potential in the specialty product market including value-added and, like larch, is an alternative to preserved wood products.
Overall, the need to meet mill demand will require better utilization of trees. Market efficiencies will dictate the development of merchandizing processes where treelengths will be broken down into desirable products and then shipped to the appropriate mill. Merchandized products will include veneer (mostly poplar and birch), sawlogs (mostly white pine, red pine, jack pine, white spruce, poplar and some white birch), oriented strandboard logs (poplar and white birch), and pulpwood of all species that may be shipped as roundwood or chipped. Merchandizing will result in getting the right product and species to the right mill; it will also increase the total volume recovery from a harvested area. Roadside chipping would provide an added advantage in that the heavy limbs and smallest tops that previously could not be transported by pulp truck could be chipped and transported in vans. This would increase total volume recovery from a harvested area and improve mill efficiencies.
C. Southern region report
The forests of the southern region
There are great differences between those portions of the region lying north and south of the Canadian Shield boundary. The Shield country (to which this wood supply strategy applies) is generally heavily forested and sparsely populated, whereas the country to the south is generally the reverse. On average, the Shield portion is 76 per cent forested and has a population density of 5 persons/km2, compared to 24 per cent forested and 422 persons/ km2 in the rest of southern Ontario. In addition, almost all of the region’s Crown land is on the Shield. Fifty-five percent of the Shield country is Crown land, compared to less than one per cent south of the Shield. Figure 14 shows the distribution of forested land in the region, and the area covered by this report.
The dominating feature of the Shield country is the Algonquin Dome, which is a central highland rising to an elevation of 580 metres in Algonquin Park. The Algonquin Dome is a country of big, rolling hardwood hills and deep, coldwater lakes. The soils are mostly ice-laid sandy tills of modest fertility, but with enough depth and drainage to grow maple and other tolerant hardwoods of sawlog and veneer quality. The Dome is forested mostly with maple, beech, hemlock, and yellow birch. It is the main source of supply for the hardwood mills in the communities surrounding Algonquin Park. Figure 15 depicts the region’s main forest cover types, in which the tolerant hardwoods of the Algonquin Dome appear an almost solid sepia tone.
The second prominent feature is the Ottawa Valley, which was formed when what is now the Great Lakes flowed out the Foss Outlet near present-day Powassan, and down the northeast flank of the Algonquin Dome toward Pembroke, Renfrew and Ottawa. As a result, much of the upper Ottawa Valley has water-laid soils that are deeper, sandier and drier than those of the Algonquin Dome. The Ottawa Valley is forested mainly with white pine and poplar. It is the main source of supply for the sawmills and composite board plants located in the area. Poplar and pine have better growth and yield than tolerant hardwoods, so much of the region’s forest industry is located in and around the Ottawa Valley.
Along its southwestern and southern flanks, the Algonquin Dome slopes away gradually toward the cottage country of Georgian Bay and the southern Shield. In both cases the terrain remains rugged and broken, but of decreasing relief and with shallower, less productive soils. Much of Georgian Bay and the southern Shield was logged of its pine and cleared and burned during the settlement era between about 1860 and 1913. As a result the forests today are younger and more heavily mixed than elsewhere in the region. However, good timber-producing lands remain in these areas, especially for second- growth pine in northern Georgian Bay and for second-growth hardwoods in the marble belt of the southern Shield.
Figure 14: Area Covered by the Southern Region Wood Supply Strategies
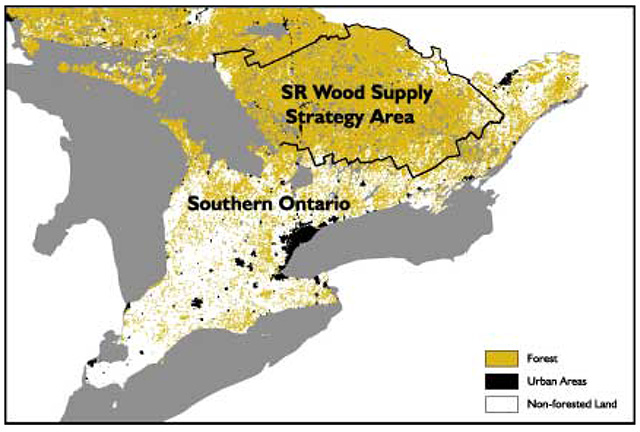
Figure 15: Distribution of the Main Forest Cover Types, Southern Region
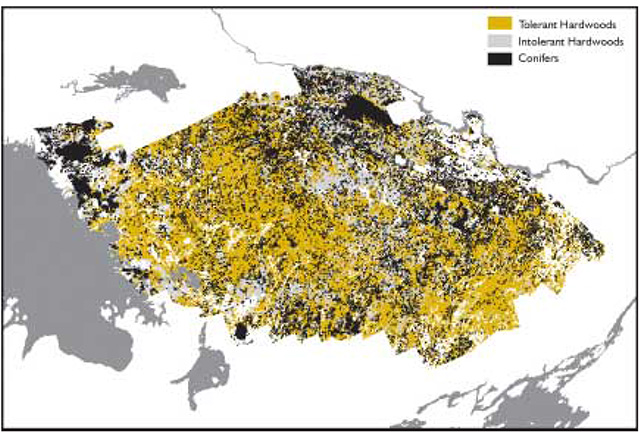
The Shield country was first opened for settlement in the mid-1800s, and the resulting land clearing and slash burning soon destroyed vast areas of standing timber. Algonquin Park was created in 1893, in part at the request of the forest industry to protect the timber resource from this type of destruction. The Shield country has poor agricultural soils, though, and much of the land that was cleared in the 1800s was abandoned in the early 1900s. The forests were left to grow back on their own. Logging and milling became the mainstay of the economy, first for white and red pine lumber, and later for hardwood lumber and veneer. In some areas tolerant hardwoods were clearcut for chemical wood in the early half of the 1900s, and hemlock was taken for tanbark. The overall effect was to deplete much of the timber resource and bring about its replacement with second-growth hardwood and pine that are once again approaching maturity. A second effect was to degrade the quality of the tolerant hardwood forests through high-grade logging for sawlogs and veneer, and reduce the proportion of white and red pine in the overall mix.
Efforts to manage the Crown land forests began with diameter-limit harvest regulations in the 1950s. They continued with management planning in the 1960s, tree marking in the early 1970s and large-scale stand improvement projects in the 1980s. Today, the Crown land forests are intensively managed, with the thrust of silviculture aimed at improving the residual growing stock after harvest. There is greater range in management intensity on private land. However, most of the harvest still proceeds using diameter limits and with little or no regeneration effort after cutting.
Table 4: The Destination of Roundwood Cut on Crown land in the Southern Region (average annual volumes, 1994 to 1999) - Facility or end-use destination (m3)
| Species Group | Sawmill | Pulp and paper | Fuelwood | Composite board | Veneer | Percent and Total |
|---|---|---|---|---|---|---|
| Tolerant hardwoods | 197,829 | 124,274 | 73,961 | 1,176 | 4,060 | 36% |
| White & red pine | 279,952 | 6,617 | 2,737 | 3,664 | 27% | |
| Poplar | 141,606 | 83,070 | 493 | 44,948 | 1,141 | 25% |
| Spruce-pine-fir | 62,249 | 2,125 | 399 | 739 | 269 | 6% |
| White birch | 34,190 | 15,634 | 651 | 1,093 | 3,772 | 5% |
| Other conifers | 13,035 | 51 | 78 | 265 | 33 | 1% |
| Totals | 728,862 | 231,771 | 75,581 | 50,958 | 12,940 | 1,100,112 |
| Percent | 66% | 21% | 7% | 5% | 1% | 100% |
The forest economy of the southern region
Today, south-central Ontario supports a vibrant forest industry that is meeting the dual challenges of ecological forest management and global market competition. The industry employs 5,000 direct workers out of a total area workforce of 133,000 people.
The region’s industry differs from northern Ontario in several key ways. Of particular importance is the scale of operations, which is much smaller. The region accounts for only five per cent of the total Crown forest resources harvested provincially. Secondly, while some of the industry giants like Domtar, Tembec and Georgia-Pacific have a presence in the region, small family-owned and operated sawmills dominate the sector. Some of these lumber companies have been operating for over a century under the same family name. The ruggedness of the Shield terrain, the diversity of its forests and forest management, the large number of tourists and tourism values, and the difficulty in reversing the effects of past harvesting practices all present greater challenges than perhaps anywhere else in Ontario. The entire region has been cut once and much of it has been cut two or more times.
As in northern Ontario, most of the wood that is cut goes to sawmills first. Sawmills represent the primary destination for two-thirds of the roundwood cut on Crown land. Sawmills also supply the bulk of the chips (both residue and roundwood chips) to the paper, corrugated medium and composite board plants. Figure 16 provides a breakdown of the primary destinations for roundwood cut in the region.
For the most part, the larger sawmills have carriage- operated bandsaw headrigs and the smaller mills have carriage-operated circular saws. Most of the larger mills also have a small-log line and the capacity to chip roundwood. Because of their size and the nature of hardwood manufacturing, only one of the region’s sawmills is fully automated.
Figure 16: Location of Primary Wood Using Industries and SFLs, Southern Region
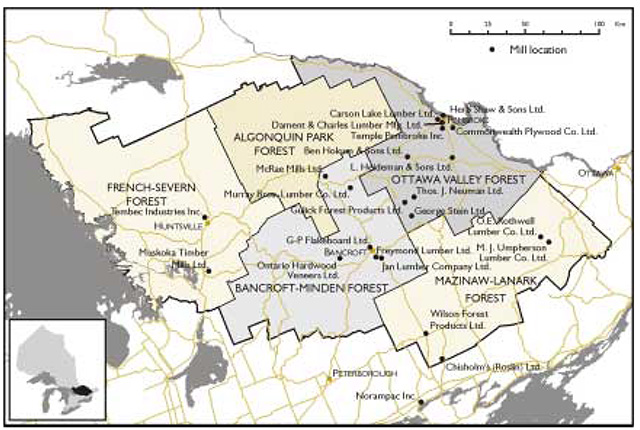
Figure 17: Locations of Crown Land, Southern Region
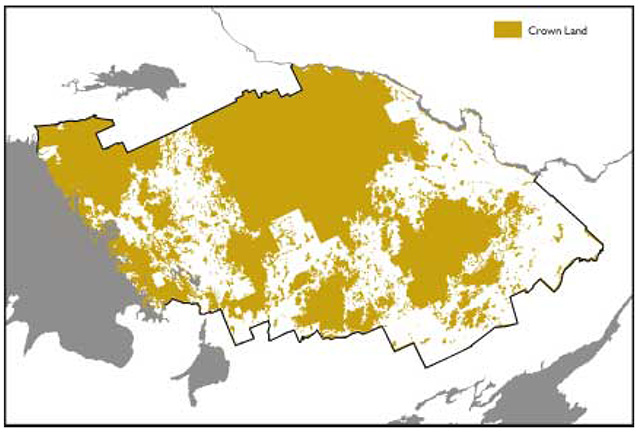
Logging in the region is carried out almost without exception by small independent loggers, cutting either under contract or on an overlapping licence held by them. Most of the logging is of the conventional cut-and-skid type, although feller- bunchers and grapple skidders are beginning to make an appearance in the region.
Five companies operating under SFLs provide forest management on the five Crown management units.
While they differ in make-up, all five companies provide the same essential forest management services and all five pass the cost of management on to the companies that conduct the harvest or receive the wood. The smaller scale of operations and the more complex management makes the Southern Region SFLs among the most expensive in the province to operate. Figure 16 shows the five management units in the region and the main Crown land wood destinations. An extensive listing of forest resource processing facilities in Ontario, including Southern Region, is currently available on MNR’s Ontario’s Forests website within the forest industry page.
At 36 per cent of the annual harvest, Algonquin Park is the largest of the five management units in Southern Region and the most critical to the region’s wood supply. Some of the best timber- producing land and some of the best forest management in Ontario can be found in Algonquin Park. Forestry is a permitted land use on 63 per cent of the park, down from 67 per cent a decade ago.
The Long-Term Forecasts for Industrial Wood Supply in Southern Region
Past Harvesting, Current Demand, and Future Supply
Figure 18 through 23 show the long-term regional forecasts for each of six species groups. They also compare the supply forecast against the past harvest, the current demand, the OFAAB benchmark harvest level and the “Room to Grow” Sharing Threshold. The six species groups that were examined are:
- Tolerant hardwoods;
- White and red pine;
- Poplar;
- Spruce-pine-fir (SPF);
- White birch; and,
- Other conifers (hemlock, cedar, larch).
Tolerant hardwoods
At 36 per cent of the current harvest, tolerant hardwoods represent the largest of the six species groups. The forecast shows the current hardwood supply to be well above the level of demand, and well above the “Room to Grow” Sharing Threshold (See Figure 18). In addition, the forecast shows tolerant hardwood supply to be increasing in the long term. On the surface it would appear that there is currently “Room to Grow”, both for the forest industry and for parks and protected areas.
Closer examination, however, shows that this surplus is confined to low-grade hardwoods, and that veneer and sawlog supply is in a deficit situation. For a breakdown of the tolerant hardwood picture by product, see Figure 24 in Part 3 of this report. It would be problematic (if indeed possible) to further expand parks and protected areas at this time without causing a long-term reduction in wood supply to the hardwood veneer and sawmill sectors. The high-grade and low-grade hardwood resources are simply too intertwined. Fundamental to the Forest Accord was the premise that there would be no long-term reduction in wood supply as a result of the Accord.
Figure 18: Comparison of Historical Forecast / Actual Harvest Levels with Current Demand and Future Harvest Wood Supply in Southern Region – Tolerant Hardwoods
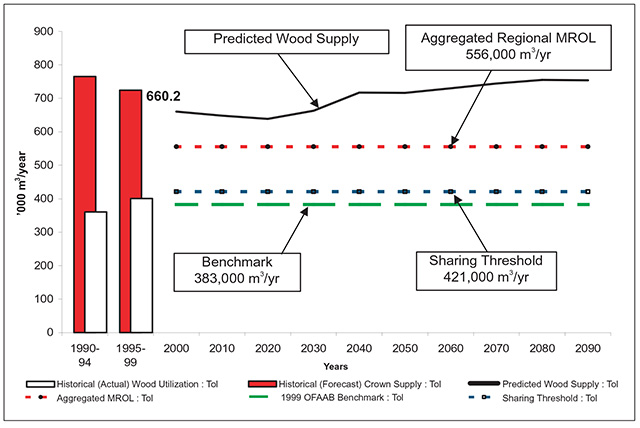
The shortage of high-quality logs and the surplus of low-grade hardwoods are the two biggest wood supply issues facing the forest industry in south- central Ontario, and they are examined in detail in Part 3.
White and red pine
At 27 per cent of the current harvest, white and red pine make up the second-largest species group. The forecast shows white and red pine supply to be in excess of the demand level but below the “Room to Grow” Sharing Threshold. Figure 19 indicates that white and red pine supply is expected to increase, but it is not expected to pass the Threshold for another 60 years. The fact that current white and red pine usage is greater than the MROLs suggests that the MROLs for Southern Region white and red pine should be reviewed and revised to reflect current demand. Worth noting is the concern expressed in Great Lakes-St. Lawrence Issue No. 5 that the white pine harvest might be held up by regeneration problems at some point in the next 20 years. See Issue 5: Unregenerated white pine backlog.
Poplar and white birch
Poplar and white birch, on the other hand, show long-term downward trends. Essentially, this decline is the result of management and natural successional trends and a corollary to the increasing tolerant hardwood and pine supply. Figure 20 shows that, regionally, poplar supply will fall below the demand level in just 15 years, affecting the paper, composite board and corrugated medium sectors for which poplar makes up about half of all supplies. Currently, poplar makes up 25 per cent of the overall harvest. In the case of white birch (Figure 21), this is a concern for the sawmill sector since white birch makes up 15 per cent of the region’s hardwood sawlogs and veneer. Declining poplar supplies are discussed in detail in Issue 4 and Strategy 19.
Figure 19: Comparison of Historical Forecast / Actual Harvest Levels with Current Demand and Future Harvest Wood Supply in Southern Region – White and Red Pine

Figure 20: Comparison of Historical Forecast / Actual Harvest Levels with Current Demand and Future Harvest Wood Supply in Southern Region – Poplar
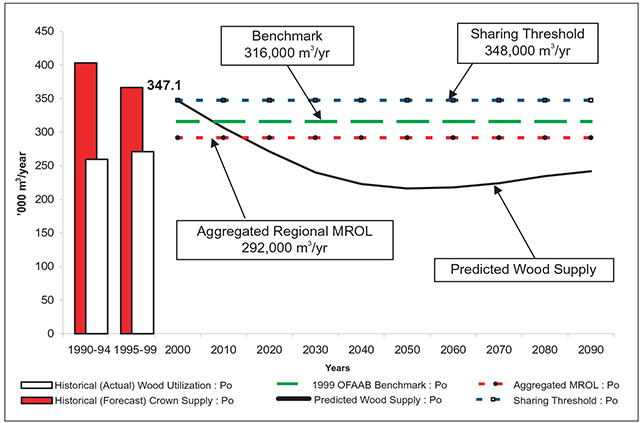
Figure 21: Comparison of Historical Forecast / Actual Harvest Levels with Current Demand and Future Harvest Wood Supply in Southern Region – White Birch
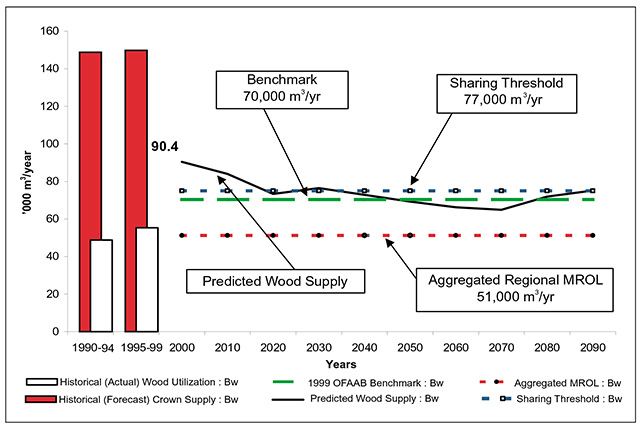
Figure 22: Comparison of Historical Forecast / Actual Harvest Levels with Current Demand and Future Harvest Wood Supply in Southern Region – Spruce-Pine-Fir
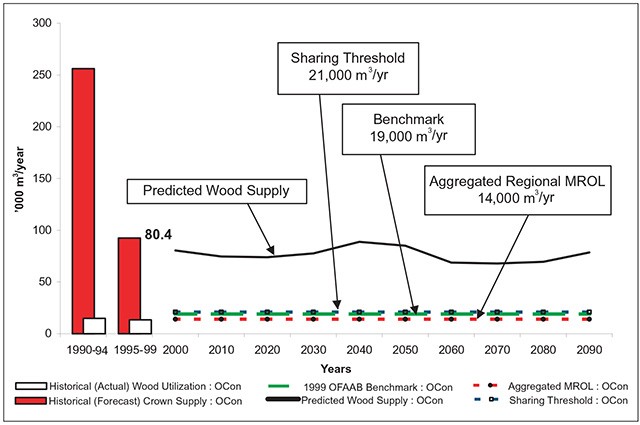
Figure 23: Comparison of Historical Forecast / Actual Harvest Levels with Current Demand and Future Harvest Wood Supply in Southern Region – Other Conifers (hemlock, cedar, larch)
SPF and other conifers (hemlock, cedar, larch)
Together, SPF and other conifers account for only seven per cent of the total harvest. The forecasts for these species (Figure 22 and Figure 23) show slightly declining supplies, but in both cases supply remains above the demand level. The supply of SPF falls below the “Room to Grow” Sharing Threshold while the other conifer remains above.
Part 3. Wood supply issues and strategies
Introduction
The previous sections of this document explore the background and context of wood supply and utilization in Ontario. This discussion of context is presented at the regional scale since this is the scale at which many companies operate and it provides a convenient scale in between the management unit, which is too detailed, and the broader provincial scale. The regional data for supply and demand is presented graphically in each of the regional reports. The reports also contain a detailed analysis of wood supply and industrial use within the text and a discussion of regional issues.
Part 3 is the essence of the Provincial Wood Supply Strategy. In part 3, the major issues are identified and a number of strategies are proposed to address these issues. This part of the document shifts to a broader scale so that the strategies may be considered for use across Ontario.
Due to the significant difference in the nature of the forest, the qualities of the tree species and the characteristics of the industry, wood supply issues are examined separately within the two broad forest zones inside the area of the undertaking – the Boreal and the Great Lakes-St. Lawrence. The section on the Boreal Forest focuses on the main boreal species groups: spruce-pine-fir, poplar and white birch. The Great Lakes-St.Lawrence section focuses on a wider range of species including tolerant hardwoods and white and red pine.
Strategies are presented as approaches to addressing the identified issues. As described in the sub-section on implementation ( see Part 1 – Introduction), these strategies are in the form of recommendations to be considered during normal forest management processes such as forest management planning, mill benchmarking exercises or licensing processes. They may also be considered in the development and implementation of other policies, programs, or decisions around research priorities. For example, these strategies may be referenced during discussions on funding for growth and yield research.
The strategies contained in the Boreal section are provincial in nature and should be considered for implementation throughout the area of the undertaking. Some, by their nature, may be more applicable to one broad forest zone or one specific administrative region. This geographic consideration is contained within the write-up for each strategy. The decision to apply any of the strategies is made at the level where it will be applied. For example, the decision to apply a strategy to develop and use local yield tables in developing a forest management plan will be made within the forest management plan. A decision to work cooperatively to develop new inventory methods may be implemented provincially or regionally.
Issues and strategies identified for the Great Lakes- St. Lawrence Forest are specific for that area due to the nature of the forest and the operations.
The assessment of the potential of the various approaches to address the anticipated wood supply issues is contained in Part 4 of this document. This assessment is used to assign a priority to each of the strategies. The priority is provided only for consideration and advice. Application of any of the strategies depends on the local or regional circumstances and a local evaluation of the anticipated benefits.
The graphs contained within Part 2 are current as of the date of publishing. The entire set of supply and demand graphs are contained within Appendix 1 – the web based database – and will be updated on an annual basis. The direction provided by the Provincial Wood Supply Strategy will evolve in response to new information and changes in circumstances as described in the Forest Resource Assessment Policy in section 2.3, Adaptive Management. The policy environment will respond to new issues and opportunities and forest managers will continue to develop new strategies to overcome wood supply challenges. The publishing of this Provincial Strategy will not limit that dynamic process. The creation of new approaches, at the local, regional or provincial level, to address the identified issues is encouraged.
Boreal forest issues
Issue 1: Future wood supply drops below current demand; and
Issue 2: Quality of wood supply information
Across the Boreal Forest zone, wood supply is predicted to fall below the current level of industrial demand in the near future. The “gap”, which has been forecast for many years, is primarily the result of an age-class imbalance in the forest itself, but this situation has been compounded by a number of other contributing factors. These factors are discussed in Part 2, in the Northeast and Northwest Regional Reports. In simple terms, there is a preponderance of very old and very young stands, and a scarcity of stands in the 20-60 year age range. The root cause of the age class imbalance is the low rate of harvest and renewal that occurred before 1970 and the accelerated rate of harvest and renewal that has occurred since that time. In addition, fire management efforts have reduced the area burned and hence the area naturally regenerated over the past 50 years. The extent of area burned in wildfires varies in long-term cycles which depend on weather cycles and forest conditions. A cycle of reduced fire prevalence may also contribute to reduced regeneration. The forecast for the two regions within the Boreal predicts that SPF supply will fall below the demand level in five to ten years and take 80 years to fully recover. For poplar, the forecast is for supply to fall below demand in 15 years, with recovery in about 70 years.
The supply gap is by far the most critical issue facing the forest industry in this part of the province. The developing gap between wood supply and demand presents an unavoidable dilemma – increase the wood supply or reduce mill consumption. If wood supply is not increased, but allowed to follow its projected track, the forest industry will be forced to decrease their wood consumption accordingly.
The ability to accurately predict wood supply is limited by the quality of the information on which wood supply projections are based. Supply projections are based on local forest management plans which use the best available information. However, forest managers recognize that improved information will yield a better picture of long-term wood supply. The quality of information is strongly tied to the issue of the wood supply gap and it affects wood supply from two perspectives.
First, better information increases the confidence in the conclusions regarding the nature and degree of the wood supply gap. There is general agreement on the existence of the projected wood supply gap, however there is still debate over the size of the gap and when it will occur. Strategies which encourage the refinement of local yield tables, development of improved methods of forest resource inventory and the use of best practices in forest management modelling will help to increase the reliability of the conclusions made concerning wood supply. There is an assumption that MNR and forest managers take a conservative approach when data on forest resources is incomplete, so better numbers may improve the overall supply/demand picture.
Second, more reliable information allows forest managers to make decisions which optimize the management and use of forest resources. For example, more accurate resource inventory and increased knowledge of forest succession will allow for improved decisions concerning the scheduling of forest stands for harvesting. Better information helps forest managers make better decisions concerning the sustainability of the forest, both for wood supply and for other forest values.
Addressing these two identified issues will contribute to the objectives set out in Part 1 of this document. Improving overall wood supply will help to sustain a continuous, long-term wood supply. Improving the quality of information used in wood supply modelling will increase the predictability of wood supply. These two issues tend to be provincial in nature and apply to the Great Lakes-St. Lawrence Forest as well as the Boreal Forest.
Fortunately, there are strategies that can be implemented to address both the wood supply gap and the underlying issue of the reliability of forest management information. In the following sub- section, 11 strategies are proposed to help mitigate the wood supply gap and improve the quality of information within both the Boreal Forest and the Great Lakes-St. Lawrence Forest. These strategies may act through one or more of the following courses:
- Rationalizing demand;
- Improving the information used to determine wood supply; and,
- Increasing the overall supply of wood.
As discussed earlier, these strategies are proposed for consideration by forest managers at the local level to help resolve local supply issues or at a larger scale to provide regional or provincial assistance for improving overall wood supply. Not all strategies are applicable to every location. The strategies will be implemented through existing delivery mechanisms which include opportunities for consultation.
The potential for each of these strategies to address the wood supply issues is assessed in Part 4 of this document.
Boreal strategies
The strategies immediately following are provincial in scope since they are intended to be implemented throughout the area of the undertaking. They address both the issues of long-term decline of wood supply and the quality of information used in wood supply forecasting. While they are focused to address the issues identified for the Boreal Forest they also apply to the Great Lakes-St. Lawrence Forest. The decision to implement any of the strategies will be made at the local, regional or provincial level depending on the nature of the strategy.
Strategy no. 1: Review mill wood demand
The first strategy for addressing the above identified issues focuses on refining the demand forecasts by reviewing and updating MROLs for the province’s mills.
The process for setting mill wood demand, referred to as Ministry Recognized Operating Level (MROL) is described in detail in the document “Wood Disposition Process and Regional Wood Supply and Demand Outlooks Phase 1”.
The MROL reviews are initiated by MNR and involve discussions with the mill operator using pertinent scaling and mill return data, company records, and information detailing the mills’ production history (e.g. production downtime, work stoppage, etc.) The discussions either confirm or establish a new MROL. The process identifies a suite of wood supply sources including Crown land, private land, and/or sawmill chips. The Crown land supply sources are then used to adjust the regional supply/demand matrix and the forest management unit contribution (MUC)(see Strategy 2). Due to the nature of the review process, a new MROL will tend to be adjusted toward the volume of actual wood utilization.
Conducting the MROL reviews ensures that the relationship between supply and demand is properly defined and the wood supply gap is more accurately predicted.
This strategy has a provincial scope and will be implemented at the regional level. Completion of this strategy has a high priority within the Northwest and Northeast Regions and a moderate priority in the Southern Region.
Strategy no. 2: Provide demand information to planning teams
Strategy 2 focuses on ensuring that the appropriate level of current wood demand is represented correctly within the forest management planning process. Current demand estimates, associated with each mill or each company from a specific management unit, can be added together to determine the total current demand from that unit. The total current demand must be considered early in the planning process for a new forest management plan along with the other demands for desired benefits from the management unit.
The mill requirement for wood supply from any one management unit is commonly referred to as the Management Unit Contribution (MUC) toward a mill’s MROL. A mill commonly receives its wood supply from a variety of management units. The sources of supply to a mill are influenced by the supply available through the forest management planning process, ministerial commitments and business to business arrangements.
The current demand levels for wood supply must be considered by forest management planners, in balance with the other desired benefits from the forest, when analyzing options during the planning process. While planners try to meet the current demand for wood, these efforts cannot compromise the ecological sustainability of the forest or appropriate application of the guides. There is no guaranteed supply of wood from a forest. Wood supply is a product of a forest management process determined at the local level that considers such things as wildlife habitat requirements, aboriginal concerns, non-timber forest values, protected areas requirements, long-term community needs, and environmental impacts.
The harvest volume available from a forest management plan may meet, exceed, or fall short of the current demand for wood from the management unit (the MUC). Forest management plans contain objectives relating to the supply of wood. Where the available supply is less than the current demand, the forest management plan will address the shortfall with appropriate strategies to the extent possible. If strategies can not be developed to address the shortfall, then appropriate rationale will be included in the forest management plan.
Industry Relations staff at MNR regional offices will verify wood supply objectives for forest management planning using current information on the aggregated mill requirements from each management unit. Verification of wood supply objectives for forest management planning involves a review of wood utilization by each mill and an analysis of wood flow across the region. Regional staff play a key role in supporting the wood supply objectives through the modelling and analysis phases of the development of forest management plans. Planning team members and regional staff must also ensure that the socio-economic side of the analysis is properly considered and described in any analysis.
This strategy will address the issue concerning the quality of information which is used in forest management planning.
This strategy is provincial in scope although it is applied at the management unit level with the assistance of regional MNR staff. It will be implemented at the regional level and has a high priority within all three MNR regions.
Strategy no. 3: Promote best practices for forest management modelling
To ensure that decisions involved in forest management planning are made on a consistent and predictable basis, Best Practices for Forest Management Modelling should be employed (see Appendix 2).
In wood supply modelling, for example, it is important to use best practices to ensure that the relationship of wood supply and demand is accurately presented. Using best practices will help to provide confidence that the wood supply issues are accurately defined between management units and that efforts to deal with wood supply issues are properly focused.
The Strategic Forest Management Model (SFMM) is the current standard used by forest management planners to project wood supply. This computer- based model is used to simulate the dynamics of forest growth, habitat production and wood supply over a 100-150 year period. SFMM provides a basis for understanding the dynamics of each forest. For their part, forest management planners must take steps to ensure that the assumptions made and information used in the modelling process are as accurate and complete as possible, in order to reduce modelling errors in the prediction of long- term wood supply.
Given the importance of SFMM modelling to forest management planning, a series of Best Practices for Wood Supply Modelling has been developed. These best practices are suggested for use as the basis for modelling the forest.
Forest management plans should specify the modelling parameters or practices chosen. Although little explanation will be required if the best practices are adopted, any deviation would require substantive discussion in the forest management plan.
SFMM is an effective tool currently accepted for use for modelling forest management in Ontario. The development of more advanced tools such as spatial models is being explored. MNR will continue to work with the forest industry to develop and/or implement more advanced decision support tools.
Although SFMM is the most widely recognized model in use for forest management analysis and decision-making, several other modelling tools play important roles in landscape, habitat and socio- economic analysis. Best practices for each of these modelling tools should also be developed. Designated specialists within MNR should be available for each of the models supported by MNR in order to ensure expertise is available to forest management planners.
This strategy is provincial in scope and will be applied across all three regions. Leadership should be provided at the provincial level of MNR with support available at the regions and districts. Implementation of the available best practices and development of advanced tools are high priorities.
Strategy no. 4: Improve growth and yield information
The Ministry of Natural Resources will work with forest industry to implement a provincially coordinated program to obtain further information on forest growth and yield applicable to local planning.
Like Strategy 3 above, the purpose of this strategy is to improve the accuracy of wood supply estimates used in planning. The development of better growth and yield information has long been identified as a priority within the forestry community and is supported by a condition within the Declaration Order Regarding MNR’s Class Environmental Assessment Approval for Forest Management on Crown Lands in Ontario.
MNR will provide coordination at a provincial level, however, growth and yield is usually tied to local site conditions and silvicultural treatments so involvement of local industry forest managers will be required to assist in obtaining the needed information. Improved growth and yield information will be required to be used in forest management planning at the local level as well as for provincial level forest resource assessments.
In particular, there are three growth and yield information priorities. First, many yield tables currently in use by the forest industry do not reflect the volumes associated with the tops of trees. Most recognize a tree stem that ends at a 10 cm top diameter for spruce, jack pine and balsam fir, and a 15 cm top diameter for poplar and birch. Merchandizing or chipping makes more efficient use of tree stems and volume tables need to be adjusted to reflect this change in practice. Volumes could be as great as 10 per cent for conifer and 20 per cent for poplar over volume tables currently in use, based on northwestern Ontario experience.
The second priority is the need for managed forest yield curves based on empirical data. These curves will provide better definition of potential yields from managed stands.
Although local stand yield tables must reflect geographic growth characteristics and utilization standards, harvest volume projections in forest management plans would be more accurate and more reliable if stand yield tables derived from local forests were used. Accurate yield tables would form the basis for reliable volume predictions which in turn, will have implications for future supply predictions.
The third priority is to recognize any gains made through intensive forest management. Accurate predictions of enhanced growth from silvicultural practices, such as those proposed in Strategy 8, will need to be incorporated into forest management planning.
Information collected by programs funded through the Enhanced Forest Management – Science Information and Analysis initiative will support the implementation of this strategy.
Strategy 4 requires provincial leadership and support; however it will be implemented at the local management unit level. It applies to all three regions and is a high priority.
Strategy no. 5: Improve forest resource inventory
Ontario’s Forest Resource Inventory system has been criticized by forest industry as expensive and inadequate for today’s forest management requirements. Strategy 5 is targeted at a co- operative approach to find efficiencies in and improvements to the existing methods and developing new systems of resource information.
The Forest Information Manual (FIM) prescribes that an inventory of forest resources must be created and maintained for each designated forest management unit in the province of Ontario. The responsibility to re-inventory licensed Crown lands in a designated forest management unit rests with the SFL holders. FIM also recognizes that technology has changed significantly and there are different ways to re-inventory a forest management unit area as long as the resulting information meets the requirements and standards described in the manual. Forest managers have suggested that improvements to the quality of the inventory may be made and cost efficiencies gained through a more coordinated approach to the inventory of forest resources.
Forest Resource Inventory (FRI) data is the basic building block upon which all wood supply analysis is conducted. For landscape level analysis and for broad assumptions that form the basis for long-term wood supply, current FRI data is both suitable and reliable, although a higher level of accuracy would prove of benefit. The current system, however, does not provide detailed information with respect to stand condition and understory species. Of particular importance is the need to develop a system that incorporates successional modelling and growth and yield information (i.e. a dynamic system). Development of this type of system will more strongly support stand level decisions.
Information collected through the Enhanced Forest Management – Science Information and Analysis initiative will support the implementation of this strategy.
This strategy is provincial in scope and may be applied within all three regions. Finding improvements and efficiencies within the existing inventory systems should be a high priority while developing new resource information systems is a moderate priority due to its longer term nature.
Strategy no. 6: Improve knowledge of stand condition and forest succession
Strategy 6 follows logically from the previous strategy on inventory. This strategy seeks to maximize the amount of wood available during the period of the future gap by selecting the appropriate stands for harvest during the current operational plan.
Based on the wood supply modelling results, (usually SFMM outputs as described in Strategy 3), forest management plans identify stands for harvest during the operational plan period. These stands should accurately reflect the forest class that the model has selected, with a minimum of substitution. This requires verification of the age and state of the forest for the stand selected for harvest.
By verifying the forest inventory information, better data on the state of the forest will emerge.
Better understanding about the condition of forest stands will also support more dependable modelling results. Improved knowledge about the state of the forest together with knowledge of forest succession will in turn, support decisions that are aimed at resolving future wood supply shortages. A declining mixed wood stand for example, may have greater value in its understory to provide commercial wood supply in 20 years, than its current timber values. Surveying forest stands for their current and future potential together with improved knowledge of ongoing succession trends, will yield more dependable results from wood supply modelling.
As new forest stands are created through regeneration, it will be important to attribute those stands with the management regime under which they will be managed. Differences in future yield, stand structure and timeframe will be associated with those managed intensively, under short rotation or commercial thinning. Better understanding of current and future wildlife habitat structure, current and future age class distributions and harvest volume predictions will emerge as a result. A stand attribute that identifies management regime will contribute to more effective data management.
This strategy is provincial in scope although it is specifically targeted at the Boreal Forest rather than the Great Lakes-St. Lawrence. It will be implemented at the management unit level and it is a moderate priority.
Strategy no. 7: Increase utilization of available wood
This strategy contains a dual focus. First, for industry to make greater use of wood which is available within forest management plans. Under clauses 8, 11 and 12 of the Ontario Forest Accord, increased volume from tops, salvage from fires/blowdown and areas of low volume harvest were referenced. Since 1999, the forest industry has been using this volume (to a greater or lesser degree) to alleviate the losses resulting from areas removed from the managed land base as an outcome of the Ontario Living Legacy land use exercise. The extent that the available wood has been utilized is variable across the province. Currently, many areas are not yet experiencing supply pressures and so industry has not yet achieved the level of utilization that will be required within 10 years. The extent that industry can use available fibre is dependent on the ability of local industry to use or adapt to the quality and nature of the fibre, as well as the economics of full utilization. However, there is a need for industry to strive to make fuller use of available fibre as wood supply tightens across the regions.
Second, the forest industry and MNR will work together to identify where any opportunities for increased utilization exist and identify any barriers to increased utilization of available wood. These opportunities include but are not limited to those described in clauses 11 and 12 of the Accord. Where barriers exist MNR and industry will work together to find feasible solutions.
Implicit within this strategy is the recognition that different mills have different product requirements and that best end use should be an integral part of forest operations. Although wood flow between different mills is currently well integrated, there is still opportunity for improved direction of most suitable wood to the appropriate mill. Mill use patterns will continue to change and adapt to external pressures including the quality and size of wood available for use.
This strategy emphasizes the need to improve the volume of wood supply available to industry through increased utilization practices. It is closely linked to strategy 4 which addresses the need to recognize the increased volume in the yield curves used in wood supply modelling. Strategy 7 is not fully achieved until the projected volume is recognized per Strategy 4.
Consistent with principles of forest sustainability and the CFSA, the available volume does not include wood required to remain standing or on the forest floor to achieve biodiversity, wildlife habitat or other objectives in an approved forest management plan.
This strategy is provincial in scope and requires coordination at the provincial level to ensure appropriate levels of information sharing across the province. Implementation, however, will occur at the management unit or company woodshed level. This strategy is a moderate priority.
Strategy no. 8: Use silviculture to increase forest productivity
- Objectives to produce specified volumes, size and quality of wood within a set time;
- Criteria to identify limited areas which have potential for more intensive silviculture. This component amounts to prime-land identification (best site index) that when combined with transportation distance (km from the mill) becomes the prime-site identification;
- A plan for surveying and recording the potential sites that will culminate in a prime-site map;
- A plan for recording selected stands in the forest inventory, which requires an identifier to be included in the stand attributes;
- A recommended silvicultural budget and a set of charges against harvested timber necessary to raise the required silviculture funds;
- A set of locally originated stand yield tables that recognize the earlier yield;
- A wood supply model that incorporates the pertinent aspects of the reduced rotation silvicultural program; and,
- Use of only approved practices in conformance with the Forest Operations and Silviculture Manual.
Strategy 8 is aimed at filling the wood supply gap in the Boreal Forest. It focuses on the use of current silvicultural practices to reduce tree rotation ages. To date, silviculture in the boreal forest has been oriented toward the regeneration of harvested areas, and vegetation management through herbicide application or manual cleaning. The trend toward the use of silvicultural techniques to reduce rotations is increasing and involves the use of density control (e.g. controlling the numbers of trees in a given area) which produces commercial size trees in less time. The length of the rotation will be affected by a number of factors including the size and quality of the desired product, however rotation ages can be reduced regardless of desired end product.
Prescribed burning has been identified as a tool with good potential on certain sites to increase the productivity of the forest. As such, MNR is developing management direction related to prescribed burning to promote and facilitate its application and use for forest management. The potential use of prescribed burning, as an effective silvicultural tool, is significant for both the Boreal Forest and Great Lakes-St. Lawrence Forest.
All practices must conform to the Forest Operations and Silviculture Manual in accordance with the Crown Forest Sustainability Act, and be approved in a forest management plan. Changes to stand yield tables will be carried out only with sufficient information to support the change and with MNR review.
Applying this strategy is expected to improve projected harvest yields, however there are limits to this approach. Intensive silviculture cannot and should not be applied in all areas of the forest. Biodiversity and habitat objectives within forest management, including emulation of natural disturbances, will require a variety of silvicultural approaches at the landscape level – some more intensive, some more extensive. The implementation of a mix of silvicultural practices will produce forest stands that will contribute to the overall habitat and biodiversity goals at the landscape level. Intensive practices may be carried out to produce a range of forest types to satisfy various non-timber objectives. Mixed wood stands of hardwoods and conifers, for instance, may be grown using intensive or extensive treatments.
The cost of the silvicultural program and the desired wood product must be factored into the equation when considering spacing control and reduced rotation ages. This strategy contemplates only small reductions in the age of rotation, however even small reductions may create sufficient extra volume of wood to meet wood supply objectives.
The final report on Enhanced Forest Productivity found that better information was required to verify the expected results of silvicultural treatments. It recommended that a dependable funding mechanism be set up to ensure the required research is carried out. The mechanism referred to as the Enhanced Forest Management – Science Information and Analysis initiative is being developed to meet this requirement. Information collected through this effort will help to implement this strategy as well as other strategies included in this document. For example, this information will help to determine how habitat values may be maintained and enhanced on the landscape through various silvicultural treatments and how these contributions can be modelled.
From a regeneration perspective, some methods including planting can result in a preliminary density control that may persist for some time. Preliminary control occurs mainly in spruce and some jack pine plantations (white and red pine are also planted to a smaller degree). Stands that are established from seed (jack pine) or suckering (poplar) and coppice (white birch), either after harvesting or fire, however often go through a period of self-thinning that increases the time to reach commercial tree size. Applying density control methods for these species would reduce the time involved to achieve commercial size.
MNR is currently developing a provincial silvicultural strategy aimed at the optimum growth and productivity of Crown forests. It will recognize that silviculture is key to the production of wood, its quality and quantity, and scheduling, to sustain and grow the forest industry in Ontario.
Strategy 8 is geared toward even-aged management. It will be implemented at the management unit or company woodshed level where appropriate in the Boreal and Great Lakes-St. Lawrence Forest zones. It is considered a high priority.
Strategy no. 9: Monitor silvicultural effectiveness
Ontario is committed to ensuring that all areas within the forested landbase capable of growing productive forests are regenerated after disturbance to identified management targets within a reasonable period of time.
The Silvicultural Effectiveness Monitoring Manual was released by MNR in 2001 as a guide to using SEM within forest management. The components include planning, forestry operations, analysis of silvicultural results and reporting. The importance of effectiveness monitoring for silviculture was highlighted in both the original Class Environmental Assessment for Timber Management (1994) and the more recent Declaration Order for Forest Management (2003). SEM was included as a legal requirement in the Timber EA and reaffirmed as a priority in the Declaration Order.
As a tool which allows forest managers to evaluate different silvicultural practices and assess their potential for increasing the productivity of the forest, both MNR and the forest industry need to commit seriously to SEM. Proper assessment and analysis of the results of silvicultural interventions allows us to learn from our experience in a methodical fashion. The reporting of the results and lessons learned and then incorporation of the lessons learned into subsequent forest management planning provides for adaptive management. The end result of an active SEM program will be the increased productivity of our forests achieved with efficiency of efforts and cost.
One of the desired outcomes of MNR’s framework for strategic planning is maintenance of economic development potential associated with natural resources.
There are two aspects to SEM that need to be pursued. The first aspect is the refinement of standards by which effectiveness can be measured. Measurement parameters for young stands such as stocking, density, and height need to be refined for each species for appropriate geographic areas throughout the Province. This refinement process will increase our comfort level that young stands having defined characteristics will mature according to the expectations described in forest management plans.
In particular, forest managers should give attention to measuring and compiling results of early growth and yield, specifically the period from free-to-grow to early maturity. Early maturity in this case is defined as the stage when crown closure is complete and stand dominance and co-dominance is set – typically between 20 and 40 years of age. A more complete documentation of early growth will help build more defensible regeneration standards.
The second aspect that requires attention is continuing the program of physically measuring, compiling, analyzing and reporting the results of silvicultural effectiveness surveys for each forest. The comparison of stand surveys with forest management plan expectations is needed to affirm and report that silvicultural operations are effectively conducted on each forest. This aspect of SEM also ensures that the productivity of the forest can be increased per MNR strategic direction.
This strategy is provincial in scope and requires provincial leadership. It will be implemented, however, at the local level within forest management planning, forestry operations and compliance monitoring. The Forest Information and Forest Management Planning Manuals clearly assign responsibility for the monitoring of silvicultural effectiveness (i.e. SEM) to the SFL holder. This responsibility is reflected in the condition of each SFL. MNR holds responsibility for verification of the information provided by SFL holders. The commitment to an effective SEM program is a high priority.
Strategy no. 10: Implement fire management and forest protection
Long-term wood supply is closely tied to forest protection and in particular, MNR’s fire management program. The average annual area of forest burned in wildfires during past 25 years in the Boreal Forest amounts to 60,500 ha/year. This corresponds to 32 per cent of the average annual harvest in the same area during the second half of the 1990s.
An estimate of the amount of area burned, based on actual fire records, is factored into the wood supply modelling and is accounted for within the regional wood supply projections in this document. As such, impacts from fire do have a significant impact on long-term predicted wood supply, particularly when younger forests are consumed by fire. The estimate for the amount of forest that will be burned is an important modelling input. Likewise, the emphasis placed on prevention and suppression of fires is an important forest management decision.
Forest fire control and management has been an important aspect of forest management for over 100 years. Fire return intervals have been lengthened over the latter half of the 20th century as a result of efforts to protect expanding communities, industrial forest opportunities, and the economies that depend on the forest products industry.
Forest fire management includes both prevention/suppression efforts and strategic planning. Prevention and suppression are the tools used to control fires. The strategic planning process establishes where and to what extent these tools will be used, as well as the use of prescribed burning. Fire can create both negative and positive outcomes for a range of forest values, depending on the circumstances. These circumstances are evaluated in the fire and forest management programs and fire planning decisions are made based on the desired outcomes. Allowing certain areas to burn is an option considered in fire and forest management, and this depends on an assessment of risk.
The forest landscape mosaic has been changed over time through fire suppression, human caused fires and other interventions. This adds complexity to the modern fire management environment. Overall, the forests of Ontario are now older than they would have been with a greater component of shade-tolerant species, insect damage and woody debris. In the absence of fire, for example, boreal stands develop a significant component of shade- tolerant balsam fir, which is a preferred food of the spruce budworm. As the budworm population peaks, balsam fir and spruce are killed, creating a very volatile opportunity for fire. Regeneration of these areas without fire favours an ongoing cycle of low-productivity spruce and fir, return of the budworm, and cycles of extreme fire hazard that puts neighboring forest and human values at risk. Wind damage or “blowdown” frequently occurs in large patches in older forest stands, creating a tremendous fuel load if a fire should occur. Fire in these circumstances often returns a more productive and healthy forest. However, decadent or insect damaged stands are often interspersed with commercially valuable timber or other values that require protection. Insects, disease, and fire act together in a natural pattern that continues to challenge fire managers.
Ontario is beginning to see the effects of a progressive shift in climate. For some areas of the province, this shift will mean more frequent periods of severe fire weather and, possibly, extended fire seasons.
The actual area burned rose against wildfire targets in the last part of the 1990s. In the Boreal Forest, area burned is now above expectations (particularly in the Northwest). Fire and forest managers will need to discuss the evolving impact that area burned has on wood supply. It can be complicated, given the local impact of a fire, the local forest management plan and the availability of wood elsewhere. For example, a fire may assist wood supply and provision of habitat in the long-term, however it may be devastating to the short-term operational plan. Likewise, the fire may not have a big impact on the regional wood supply, but a big impact on the local operators and forest managers.
Fire protection for areas of investment in intensive forest management should be analyzed and protection priorities matched to wood supply priorities. The overall impact on levels of protection and fire management costs will have to be determined. In addition, forest managers should work with fire managers in the future to ensure the design of harvest and silviculture investments takes best advantage of natural fire protection opportunities.
The discussion of costs and benefits of fire management will occur within the proposed fire management strategy together with decisions on priorities. This dialogue needs to continue as circumstances evolve.
Forest protection includes the monitoring and management of insects and disease. Forest health is a significant part of the wood supply picture. Annual volume losses due to insects and disease can exceed losses due to both fire and harvesting combined. Some silvicultural methods and fire management practices can exacerbate insect and disease problems.
Although growth and yield data often take into account losses due to insects and disease, the data do not capture new pests (e.g. introduced insects) or changes in distribution or abundance of insects or diseases. In the case of forest tree diseases, changes in harvest scheduling can capture fibre that would otherwise be lost as trees die and drop out of the stand.
The development of a long-term wood supply strategy needs to take into account the losses due to insects and disease, and understand the inter- relationship between management practices and these losses.
For forest insects, it is often difficult to anticipate when and where outbreaks will occur. Therefore, MNR needs to ensure it maintains the ability to respond to insect attacks through approved management options such as salvage harvest, redirected harvest, use of insecticides, or other control methods. Forest management planning must also consider the implications of silvicultural practices on insect or disease problems. For example, stand thinning or spacing programs can lead to outbreaks of sawflies or increased inoculums of root rot fungi. Forest management planning can be used to reduce the likelihood of future problems, or anticipate their occurrence so as to mitigate their impacts.
Not all forest insect or disease problems can be predicted, though. Native species can change their significance because of changes to forest ecosystems, host abundance, or stresses such as weather or climate change. New, invasive species can establish themselves and cause significant impacts to wood supply.
Critical to protecting wood supply is the need for a comprehensive forest health monitoring program. This program needs to detect, identify, quantify, analyze, estimate impacts, and predict the occurrence of forest disturbances at the local, regional and provincial scale. The results of the forest health monitoring program must then feed into the development of relevant policies and planning and implementing management programs to reduce the impacts on wood supply. The polices and management programs need to consider landscape patterns of the disturbance and the effects of the disturbance on local, regional, and provincial wood supply.
MNR will continue to work cooperatively with the federal government and forest industry to monitor insect and disease outbreaks and abiotic factors affecting forest health. The forest management planning system allows for active forest protection within a regulated process that includes opportunities for public consultation. This process will continue to be available to forest managers.
The fire management strategy is a provincial level document with sections for each fire zone. It will be implemented at the provincial and local levels. Likewise, a strategy for protection from forest insects and diseases will require provincial leadership. The insect and disease management strategy, therefore, will be developed at the provincial level with local input. Management of insects and diseases will require leadership at the provincial level, however it will be implemented at the local level. Both are a high priority.
Strategy no. 11: Ensure guide effectiveness and efficiency
In Ontario, forest management guides provide direction specific to an identified value or group of values for forest management planning and the implementation of planning decisions. Guides are produced by MNR, based on best available science and information and developed in consultation with the public and interested parties depending on the vintage of the guide. Currently, there are 36 guides that are approved to manage or protect a wide range of identified values or features through forest management activities. For ease of explanation, the guides may be grouped into four general topics to help explain the range of subjects covered:
- Silviculture – provide direction for the management and regeneration of individual tree species or communities of species (e.g. A Silvicultural Guide for the Tolerant Hardwood Forest in Ontario);
- Habitat – provide direction for the management and protection of wildlife and fish habitat within the scope of forest management (e.g. Forest Management Guidelines for the Provision of Marten Habitat);
- Social and economic values – provide direction for protection of values on the land or contained in the forest, besides wildlife habitat, which may be affected by forest management activities (e.g. Management Guidelines for Forestry and Resource-Based Tourism); and,
- Environmental protection and operational activities – provide direction for forest management activities (e.g. Forest Management Guidelines for the Protection of the Physical Environment or Environmental Guides for Access Roads and Water Crossings).
An independent review of the forest management guides was released in May 2000 in response to a commitment under the Ontario Forest Accord. The goal of this review was to uncover ways to ensure that the guides fulfill their intended purpose in an effective and efficient manner and it included a number of recommendations to improve Ontario’s system of forest management guides. In particular the report recommended that the wide range of guides be consolidated to integrate the direction provided in existing guides. This would provide an opportunity to update the science that support the guides as well as reduce the complexity of applying them.
MNR has begun to act on this recommendation for guideline consolidation. Following the development process now underway, the 36 existing guides will be consolidated into six documents, largely classified by the scale at which they will apply. This is intended to emphasize the connectivity of the values they are geared to protect, as well as to minimize the gaps, redundancies and contradictions. The consolidation should facilitate easier use of the guides within the forest management planning process, making the process less complex, costly and time consuming for everyone.
Several of the other recommendations in the May 2000 guidelines review report have been accepted, either within the process for developing new guides (e.g. clarification of standards versus guidelines) or through the implementation within the forest management planning process.
The Declaration Order for the Environmental Assessment Approval contains several conditions pertinent to the development and implementation of forest management guides. These include:
- Monitoring and assessment of the effectiveness of guides (Condition 31);
- Provision of training on the application of guides for persons involved in the planning and implementation of forest management activities (Condition 38 a);
- Review of existing guides to ensure that they reflect current scientific knowledge as it applies to Ontario (Condition 38 c and d);and,
- Pilot testing of new, revised and amalgamated guides to assess their effectiveness and efficiency in application prior to approval for implementation in accordance with Condition 38(e).
MNR is committed to maintaining a program of scientific studies to assess the effectiveness of the forest management guides. This monitoring of the implementation of guides will continue to build the knowledge base required for the periodic review of the guides and is key to achieving both effectiveness and efficiency. Effectiveness ensures that the intention of the guide is achieved (e.g. in the case of raptors, that nesting activities continue successfully, undisturbed by forestry activities). Efficiency means that the guide achieves its objective while minimizing costs and impact on other forest values, including the supply of wood to industry.
MNR is also committed to the pilot testing of new and revised guides to assess their effectiveness and efficiency in accordance with Condition 38(e) of the Declaration Order. In support of this testing, MNR is prepared to pursue a social and economic analysis during the development of forest management guides as may be appropriate to the content of the guide. The Provincial Forest Technical Committee will be consulted during the review and revision of guides in accordance with Condition 38.
This strategy is provincial in scope and will be implemented at a provincial level with local and regional input. It has a very high priority, although there is no guarantee of increased wood supply as an outcome of the implementation of the strategy.
Great Lakes-St. Lawrence forest issues and strategies
Strategies with provincial scope
As discussed in the introduction to Part 3, the wood supply issues within the two broad forest zones are different and hence the strategies which address these issues are substantially different. However, all of the strategies presented in the Boreal Forest section, with the exception of Strategy 8, are provincial in scope. These ten provincial strategies address the concerns around overall wood supply and improving the information base we use for determining wood supply and must be considered for application within the entire area of the undertaking – including the Great Lakes-St. Lawrence Forest area.
The Great Lakes-St. Lawrence Forest has its own set of characteristics and its own set of unique issues. These are described below:
Issue 3: The current shortage of high- quality hardwood sawlogs and veneer
In discussing wood supply, hardwood sawlogs and veneer are often grouped together, mostly because the nature of the data calls for lumping rather than splitting. While there is some overlap between sawlog and veneer log specifications, generally veneer has much stricter requirements and commands much higher prices. Overall, veneer logs make up only two per cent of the hardwood sawlog and veneer category that is being harvested today on Crown land in the Southern Region.
Veneer makes up a small share of the cut, but it provides a disproportionately large share of the jobs and product value. Veneer mills require an even better log than sawmills and their supply situation is even more precarious. As a result, veneer mills draw on very large areas, reaching as far as northeastern Ontario for white birch, southwestern Ontario for hard maple, and the United States for red oak.
In sawmills, hardwood lumber is graded and priced according to the size and percentage of clear cuttings that can be ripped from the board, based on NHLA
Almost all of Ontario’s hardwood sawmills are carriage-operated, in which the log may be turned several times during the process to allow for sawing on the best available face. Carriage mills give the best lumber grade recovery, but they have a lower productivity and higher sawing cost than other mill types. Many of the larger hardwood mills also have a small-log line, in which a twin-saw headrig cuts the log into a cant, and a series of gang saws rips the cant into boards. Scragg mills, as they are known, are more efficient than carriage mills in sawing small, sound logs, but neither type can effectively handle crooked or large rotten logs.
Over the years, better markets and better prices have allowed the sawmills of the region to gradually lower their log specs and accept smaller and rougher logs. Even so, few mills can find the wood supply they need to operate two shifts year-round. Over the years, many mills have closed. Other mills have adapted by adding a small-log line to increase their production and reduce their sawing cost. A few rely on secondary manufacturing of the lumber they produce as an essential part of their business. Roundwood chippers have become an important sawmill addition for others, allowing them to accept the whole tree without having to saw it all. All of these factors have allowed a gradual but significant trend toward more complete hardwood utilization, right across the Great Lakes-St. Lawrence Forest.
Despite these improvements, there is a chronic shortage of high-quality sawlogs and veneer today, and there has been for decades. The present problem has always been attributed to past high- grading practices, but the fact that much of the hardwood resource is growing on shallow soils of only modest fertility is a big factor too. On Crown land since the 1960s, and now on private lands too, tree marking aimed at retaining the best growing stock is a third factor that is limiting the availability of good hardwood logs in mill yards today.
The forecast is for this situation to continue well into the foreseeable future. Figure 24 shows that the supply of hardwood sawlogs and veneer is not expected to meet the current level of demand for another 30 years, which is well beyond the life expectancy of current mill equipment.
Clearly, the region’s sawmills must continue to adapt to a supply of small-diameter and low-quality logs for some time to come. The mills most at risk in this situation are the small circular-saw carriage mills. Currently, these mills expect their log suppliers to dispose of the pulpwood/fuelwood component themselves, which is possible only in cuts with a low pulpwood content or in areas with a good pulpwood market. Also, these same mills lack the scale and resources to be able to take advantage of new technological advances in sawmilling and processing equipment.
While the log quality issue is expected to persist for many years, the tree marking and stand improvement efforts that began 30 years ago and that have become increasingly intensive of late are expected to eventually reverse this trend. According to Figure 24, hardwood sawlog supply is expected to peak in about 80 years, at which time sawlogs and veneer will make up 45 per cent of the hardwood cut, compared to 32 per cent today.
Strategy no. 12: Use silvicultural ground rules
Figure 24: Supply/demand Forecast for Tolerant Hardwood Sawlogs and Veneer – Southern Region
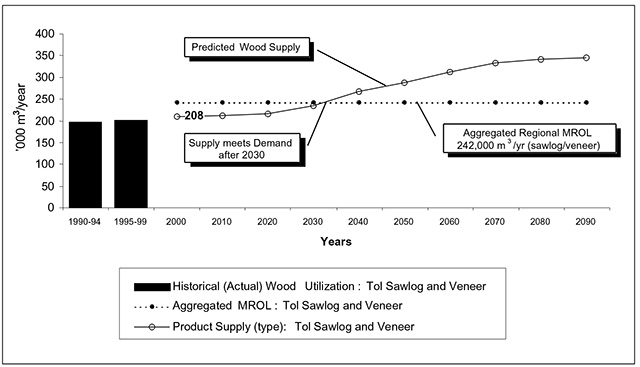
There is strong consensus, both in government and industry, that the long-term solution lies in continuing the present tree marking and stand improvement efforts. Only by improving the growing stock can the proportion of sawlogs and veneer in the cut ever be increased. There is still work to be done in refining residual stocking objectives, setting cutting cycles, and matching treatment to site, but that is just fine-tuning of the present approach. Thinning and improvement cuts as portrayed in Figure 25 will eventually raise the proportion of sawlogs and veneer in the hardwood cut and alleviate the quality log deficit.
This strategy applies across the Great Lakes-St. Lawrence Forest and should be applied to all areas of uneven-aged tolerant hardwood management. Although this strategy is already being implemented as part of normal operational practices, continuing good silvicultural practices in the hardwood forest remains as a high priority.
Strategy no. 13: Ensure logging standards for residual stand quality
Strategy no. 14: Investigate logging standards for mechanical harvesting
Figure 25: Thinning and Improvement Cut in Second-growth Hardwoods
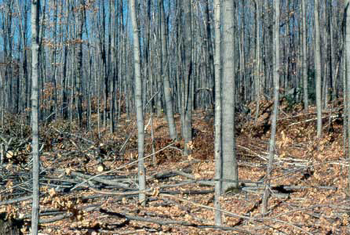
Mechanical damage to the growing stock of residual trees leads to increased disease and stem rot and reduces the volume of high-quality timber in future harvests. Likewise, site damage harms the tree growing potential of a site. Efforts to maintain low logging damage and minimize site damage must continue and MNR will ensure that silvicultural standards that minimize damage are followed.
High worker turnover, a greater proportion of pulpwood in the cuts, the need for better worker safety and tighter economic margins are all factors that will lead the logging sector in south-central Ontario toward greater mechanization in the future. It is becoming increasingly difficulty to attract motivated young people willing to work in the woods today. Although this strategy does not encourage or discourage this movement toward increased mechanization, techniques must be found to allow mechanized harvesters to operate within the existing logging damage standards.
Strategies 13 and 14 apply specifically to the partial harvest systems found within selection harvesting of tolerant hardwoods or shelterwood harvesting of pine stands – both within the Great Lakes-St. Lawrence Forest. They are to be implemented at the local level and are moderate priority.
Strategy no. 15: maximize salvage of high-quality logs
The intention of this provision is to maximize the salvage of high-quality sawlogs and veneer that would otherwise be lost to natural causes.
In the short term there is room to improve quality log supply slightly without sacrificing sustainability at all, by having tree markers focus to a greater degree on "salvage". A strategy such as this would call for tree marking prescriptions to require high- quality stems with high mortality risk to be marked first, before other high-risk trees. The MNR Tree Marking Guide
Strategy No. 15 may spark debate on what constitutes acceptable risk and according to whose judgement. Should risk tolerance vary with the value of the tree at risk? Like the debate on cutting cycle, however, these matters will lead to a fine- tuning of the strategy.
This strategy applies only to the Great Lakes-St. Lawrence Forest and will be implemented within forest management planning and operations at the local level. This is a moderate priority although it may be implemented in most management units currently.
Issue 4: The current surplus of low-grade hardwoods
The corollary to the sawlog shortage is a surplus of low-grade hardwood pulpwood and fuelwood as illustrated by Figure 26. This too has been a chronic, long-standing problem. Tolerant hardwoods pose special problems in manufacturing because of the large number of species involved, the wide range in log sizes and shapes, the large extent and diversity of defect types, and generally difficult wood properties. Figure 27 illustrates the nature of the problem of low-grade hardwoods from the perspective of a sawmill.
Figure 26: Supply/demand Forecast for Low-grade Tolerant Hardwoods, Southern Region
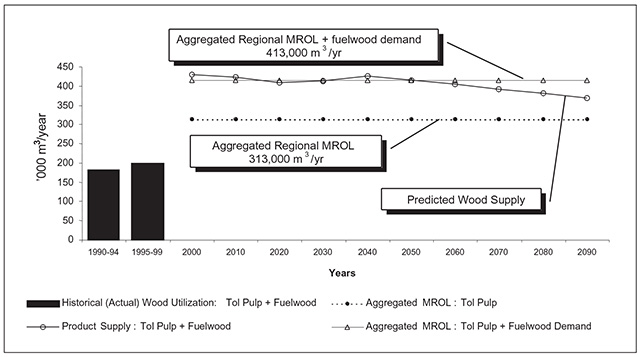
There has, however, been a gradual improvement in this situation over the past 20 years. Increased production at the paper mills that draw hardwood pulpwood from the region, and the utilization of continually smaller and rougher logs by sawmill have all helped. Also, the new SFL arrangements have encouraged the industry to meet more of its pulpwood needs from Crown land in order to boost production from the SFL area, lower SFL costs and meet CFSA utilization standards. Hardwood utilization is better now than at any time in the past.
Figure 27: Typical Low-grade Tolerant Hardwoods
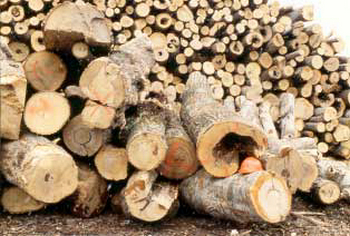
The use of low-grade tolerant hardwoods for the local home-heating market is a factor of great importance in this equation too. Crown land fuelwood consumption has averaged 75,000 m3 per year over the past five years, accounting for 18 per cent of hardwood usage. Most fuelwood on the Shield is sold by independent loggers, with a standard tri-axle log truck or trailer load (~15 m3) priced at about $500 for random-length roundwood logs. Fuelwood for home heating is a price-sensitive market, with Crown land consumption running well over 100,000 m3 in some years when energy prices are high. The forecast is for the fuelwood market to grow sporadically, along with energy prices and year-round development in cottage country.
It would be advantageous to move even more pulpwood and fuelwood because more sawlogs would be freed-up and more stand improvement could be carried out. But the fact remains that pulpwood supply is greater than demand, and the efforts to supply more are also serving to keep prices low. The problem is greatest in tolerant hardwoods and it is likely to remain with us for some time.
Strategy no. 16: Increase utilization of low-grade wood
Strategy no. 17: Permit export of low-grade hardwoods
Strategies 16 and 17 attempt to work within the existing demand to find increased utilization of the available low-grade hardwoods. Ultimately, the solution to the hardwood surplus lies in some form of industrial expansion. The NE/SC Hardwood Project was unsuccessful in its attempt to attract new industries to the region to use this surplus wood, or to have one of the existing pulp users expand production.
The most effective strategy in the present circumstances is the continuation of the current industry efforts to use as much pulpwood as is economically possible, including moving pulpwood out-of-province. For its part, MNR must be receptive to multi-year export permits, as these are necessary to secure large contracts with U.S. producers.
Two other industrial strategies are possible to deal with this situation. Both revolve around the notion that a scarce resource (in this case pulpwood markets) should be used wisely. Although they are not articulated in any management plan, both strategies are in use to a large degree already.
The first strategy is to concentrate the harvest in those forest units that yield a high sawlog content, and allow any under-harvest to occur in those types that do not. In this way, sawlog production is maximized and the pulpwood by-product is minimized. This allows for a greater overall harvest, as well as the greatest possible harvest of sawlogs.
Where pulpwood is cut in hardwood types with a low sawlog content, the second strategy is to target those allocations with the best stand improvement prospects. In this way, stand improvement benefits would be maximized and stand improvement costs would be minimized. This strategy also allows for a greater proportion of sawlogs and a lesser proportion of pulpwood in subsequent cuts.
Strategies 16 and 17 both apply throughout the Great Lakes-St. Lawrence Forest and will be applied at the management unit level. Both are low priority.
Issue 5: The uncertainty of private land wood supply
Almost half of the forested land on the Shield of the Southern Region and almost all of the forested land off the Shield is privately owned. Private land wood supply is just as important to the south-central forest industry as is the Crown land supply. Private land forests are also a significant commercial resource within the Northeast and Northwest Regions. Despite its importance, though, relatively little is known about it, including its sustainability.
MNR has an interest in the sustainability of the private timber resource but it does not regulate private land forestry. The nature of the harvest is regulated in some municipalities by municipal tree- cutting by-laws, but the level of harvest is not. Harvest levels on private land are strictly a function of supply/demand, and open market forces.
Strategy no. 18: Study private land wood supply
There is no intent on the part of MNR to regulate private land forestry or to return to directly providing forestry services to private landowners. Nonetheless, if MNR is to achieve a goal of sustainability in wood supply, it must help to bring about a better balance between the forest industry and the resources available to it. In the Southern Region where private wood makes up half of all wood supply, the private land must be factored into the equation, and to do so, MNR must acquire a better understanding of the sustainability of the private land harvest.
The lack of data on the private land resource and the private land harvest means that the answer can’t be precise, but that doesn’t mean it won’t be right. Where data on the resource is incomplete, MNR takes a conservative approach.
Data on private land forestry exists in two forms. Information on the resource itself exists in the form of FRI data.
An estimate of the sustainable private wood supply could be arrived at using FRI and Crown land forest management plan data as a benchmark, provided that the landbase is adjusted to account for official plans, zoning by-laws, landowner “willingness to sell”, future development and other factors that pertain strictly to private land. A further adjustment might be necessary to account for the generally lower intensity of forest management that occurs on private land, and the generally lower productivity and product yield that results from it in the long term.
An estimate of the current harvest could be arrived at from mill licence returns, provided that this information were adjusted to account for unprocessed products like fuelwood, logs processed by small unlicensed mills and shipments to the U.S.
This strategy applies only within Southern Region where the private land wood resource is most critical to the wood supply of the region’s mills. The study is currently underway and is a high priority.
Issue 6: A long-term trend toward declining poplar supplies
The poplar supply graph in Part 2 indicates a long- term decline in this species in Southern Region. Although a long-term decline in poplar is projected for all three regions in Ontario, the circumstances in the Southern Region are unique and require a substantially different response from the northern regions.
The extent of poplar in the Region today is largely a product of history. Most of the poplar on the Shield originated following the pine logging and wildfire era that accompanied settlement, between about 1880 and 1913. Poplar also grew up on lands that were cleared for farming in the late 1800s and later abandoned. As a result, most of the region’s poplar is now between the ages of 65 and 115 years, which is well beyond commercial maturity.
As a forest resource, poplar was largely ignored by the forest industry until relatively recently. Today, poplar from the region is used in the manufacture of particleboard, medium density fibreboard (MDF), lumber, paper, cardboard corrugated medium and oriented strandboard (OSB).
Time, natural succession, and silvicultural practice are all working against poplar wood supply in the long term. Both of the poplar species in the region are relatively short-lived, and much of that poplar is now overmature and in a decadent condition. Most poplar stands in south-central Ontario are mixed with other species, and successional trends are toward maple and balsam fir, depending on soil depth and drainage. Because much of the poplar is found on sites better suited to tolerant hardwoods or pine, silvicultural practice is not always directed at poplar replacement either. The poplar component is often removed from mixedwood stands, and the residual hardwoods or pine are then left to form the next crop. In addition, poplar on good pine sites is sometimes clear cut and converted to white pine. In only a small percentage of cases is poplar clear cut and left deliberately to regenerate back to poplar.
Although there is a surplus now, the forecast is for a poplar deficit to develop in as little as 15 years. Figure 20, (see Part 2), shows that, regionally, the poplar supply will fall below the demand level by about 2015. As supplies become scarce in some areas the demand is expected to shift to those areas where poplar remains abundant, until the poplar in those areas is depleted too. As illustrated in Figure 20, poplar supply will reach a low point in about 50 years within the Southern Region.
This decline will impact the composite board sector more than any other. Poplar makes up half or more of the furnish for corrugated medium, MDF, particleboard and OSB, and poplar is used in fine papers too. Poplar is preferred over dense hardwoods in the production of composite board because of its lighter weight, lighter colour, and superior machinability. In specialty papers, poplar adds opacity and brightness to the product. Southern Region sawmills, on the other hand, use poplar in part due to an insufficient supply of good hardwood and pine sawlogs, and in part due to the demand for poplar chips. Most of these same sawmills would prefer a steady supply of quality hardwoods, if a steady supply could be made available.
Figure 28: Poplar Age-class Distribution, Southern Region

Strategy no. 19: Notify poplar users of long-term decline in supply
The forces contributing to this downward trend in poplar supply are overwhelming. Poplar is a short- lived species and it stores poorly on the stump. Largetooth aspen is slightly better than trembling aspen in that regard, but forest inventories do not distinguish between the two species and they often grow together. The present age class distribution of the poplar resource is heavily skewed toward mature and overmature timber. It would not be possible to bring on a replacement crop of poplar in the time remaining, given this age class imbalance. Nor is poplar production even desirable on sites capable of growing better hardwoods or pine.
This same trend is thought to exist in other intolerant and mid-tolerant hardwood species for essentially the same reason, but it did not surface in the long-term forecasts. (The current SFMM model is unable to account for successional trends in uneven-aged management.) These other hardwood species include white birch, yellow birch, red oak, white ash, basswood, and black cherry. Together they make up one-third of the region’s hardwood sawlogs and veneer.
This strategy applies only to the Southern Region and will be applied on a company mill basis. It is a moderate priority.
Issue 7: Unregenerated white pine backlog
One potential wood supply issue has been identified that was not reflected in long-term supply forecasts.
There is a general concern among forest managers that a decline in white pine supplies may occur when the first cohort of the region’s white pine managed under the shelterwood system reaches the removal cut stage, over the next 20 years.
The problem stems from the difficulty in regenerating white pine after logging, especially on competition- prone till soils. White pine is a slow starter and a poor competitor, whose ecological niche has been to colonize the relatively competition-free environments of old burns and old, sandy fields. But pine stands on good sites develop a cooler, moister and richer understory as they mature, which fills with the advance growth of other species. Successional trends in this part of Ontario are strongly toward maple and balsam fir, and both species are very resistant to today’s herbicides.
Strategy no. 20: Ensure regeneration of white pine shelterwoods
If past shelterwood efforts are not brought up to standard before their next harvest allocation, this has the potential to result in a dip in white pine supplies at that time. The final shelterwood stages (the removal cuts) may not take place until regeneration in the understory meets the white pine regeneration standards. The management units most likely to be affected are those in which much of the pine is growing on competition-prone till soils. Those units where the pine is growing on deep sandy soils of glacial-fluvial origin tend to be less affected.
This issue has the potential to be an important one. Regionally, pine accounts for one quarter of the total harvest, one third of sawlog supply and one half of composite board furnish. The problem, should it arise, is expected to be short-term and self- limiting, though. Shelterwood removal cutting may resume again as soon as the regeneration in these old cutovers is brought up to standard.
Some of these backlog areas are known, and these are listed in the inventory of “xyz Lands” for each SFL. SFL Paragraph 16.2 requires the licensee to regenerate Class X and Y backlog areas to the appropriate standards. (Class X and Y lands are areas harvested after April 1, 1995 or treated using funds from the Forest Renewal Trust or special purpose account for that management unit.)
SFL-holder regeneration obligations do not extend to backlog areas resulting from earlier cuts or to treatments funded from other sources. If licensees wish to harvest these other shelterwood areas, they must first treat and regenerate them to the current standards too.
This strategy applies to the entire area of the Great Lakes-St. Lawrence Forest and will be implemented on a management unit basis although it may require regional coordination. It is a moderate priority.
Part 4. Assessment of wood supply issues
Introduction
Each of the strategies presented in Part 3 of this document are intended to address one or more of the identified wood supply issues. These strategies describe in broad terms, the approach recommended, the rationale behind the approach, some of the steps to be taken and the scale at which the strategy will be implemented.
Part 4 contains a descriptive assessment for each strategy of its potential to contribute to addressing the identified wood supply issues. The assessment of potential is quantified where possible; however, the impact of implementing many of the strategies is not quantifiable. Where this is the case, the descriptive assessment is provided. The purpose of the assessment allows forest managers to estimate where their efforts are best directed and to what degree the strategy may address the wood supply issue. Each of the strategies contain a priority rating, which is dependent to a large extent on this assessment.
Table 5 presents this assessment information in tabular form for easy reference.
Boreal forest
Following an analysis of long-term wood supply and current industrial demand within the Provincial Wood Supply Strategy, two issues were identified in the Boreal Forest context:
- Future Wood Supply Drops Below Current Demand; and,
- Quality of Wood Supply Information.
The first issue is further explained in the sentence from Part 3: “The developing gap between wood supply and demand presents an unavoidable dilemma – increase the wood supply or diminish the demand.”
The second issue recognizes that our ability to accurately forecast long-term wood supply is limited by the quality of the information used in forest management.
Eleven strategies are proposed to help mitigate the wood supply gap and address information needs within the Boreal Forest.
Their potential to address the two identified wood supply issues is described below.
Strategy 1: review mill wood demand
The review of mill wood demand process is underway in all three regions. The Provincial Wood Supply Strategy uses the Ministry Recognized Operating Level (MROL) as a measure of current mill demand.
The MROL reviews consider the current MROL, current supply agreements or commitments, accepted business plans, current utilization and available supply in forest management plans in assessing whether the existing MROL should remain unchanged, or whether there is a recommendation made to increase or lower the MROL.
Upon completion of the MROL reviews for each region, there may be a change in the magnitude of the gap between regional wood supply and aggregated mill demand. Where there is a projected gap in wood supply, a reduction in the MROL for a species group will reduce the wood supply gap while an increase in MROL will aggravate the forecast problem.
A reduction in MROL may reduce the existing wood supply gap; however, an increase in actual wood supply is a preferred solution for long-term wood supply shortages in order to maintain socio- economic benefits from forest management.
The estimates for degree of change follow for each species group in each of the Northwest, Northeast and Southern Regions.
Table 5: Summary of strategies assessment
| Strategy No. | Description of Strategy | Geographic Scope | Priority | Implementation Level | Value of Strategy |
|---|---|---|---|---|---|
| 1 | Review mill wood demand | Boreal & GLSL | High | Provincial and Management Unit | More accurately defines wood supply & mill consumption relationship |
| 2 | Provide demand information to planning teams | Boreal & GLSL | High | Regional | Establishes realistic harvest objectives |
| 3 | Promote best practices for forest management modelling | Boreal & GLSL | High | Provincial & Management Unit | Ensures consistent use of wood supply models |
| 4 | Improve growth & yield information | Boreal & GLSL | High | Provincial, Regional & Management Unit | More accurate inputs into wood supply modelling & more confidence in forecasts |
| 5 | Improve forest resource inventory | Boreal & GLSL | High | Provincial & Management Unit | More accurate inputs into wood supply modelling & more confidence in forecasts |
| 6 | Improve knowledge of stand condition & forest succession | Boreal & GLSL | Medium | Provincial, Regional & Management Unit | More accurate inputs into wood supply modelling & more confidence in forecasts |
| 7 | Increase utilization of available wood | Boreal & GLSL | Medium | Management Unit | Making full use of available wood – 5 to 15% increase in available supply |
| 8 | Use silviculture to increase forest productivity | Boreal & GLSL | Medium | Management Unit | Implementing silvicultural activities to grow more wood in less time – 5 to 10% long-term |
| 9 | Monitor silvicultural effectiveness | Boreal & GLSL | High | Management Unit | Determination of best silvicultural treatments or practices leads to improved supply forecasts |
| 10 | Implement forest protection strategies | Boreal & GLSL | High | Provincial, Regional & Management Unit | Potential to protect current and future wood supply |
| 11 | Ensure guide effectiveness and efficiency | Boreal & GLSL | High | Provincial | Improves the accuracy of information used in forest management planning |
| 12 | Use silvicultural ground rules | GLSL | High | Regional & Management Unit | Improves growing stock quality in suitable hardwood stands |
| 13 | Ensure logging damage standards for residual trees | GLSL | Medium | Regional & Management Unit | Reduces potential damage to crop trees |
| 14 | Investigate logging damage standards for mechanical harvesting | GLSL | Medium | Regional & Management Unit | Minimize logging damage to crop trees in mechanized selection harvest systems |
| 15 | Maximize salvage of high-quality logs | GLSL | Medium | Regional & Management Unit | Increases the use of high-quality stems with high mortality risk |
| 16 | Increase utilization of low-grade wood | GLSL | Low Regional & Management Unit | Promotes increased use of low-grade wood & access to more high-quality material | |
| 17 | Permit export of low-grade tolerant hardwoods | GLSL | Low Regional & Management Unit | Provides increased use of low-grade wood & access to more high-quality material | |
| 18 | Study private land wood supply | GLSL | High | Regional & Management Unit | Provides better wood supply estimates from private land |
| 19 | Notify poplar users of long-term supply decline | GLSL | Medium | Regional & Management Unit | Prepares the forest industry for reduced volume |
| 20 | Ensure regeneration of white pine shelterwoods | GLSL | Medium | Regional & Management Unit | Promotes successful white pine regeneration and maintains wood supply |
Northwest wood demand
SPF
Initial indications are that the aggregated MROL for spruce-pine-fir (SPF) is too high and the estimate of mill demand may drop once the review is complete. The amount of decrease in demand will be less than 10 per cent. This amount of change would match the dip in the long term supply. The primary reason for this change is that utilization over the past 10 years does not support maintaining MROLs at their current level. When initially established in the Northwest Region, the MROLs were closely aligned with supply rather than actual utilization. This resulted in an MROL higher than the actual utilization.
Poplar
The poplar wood demand recognizes the new laminated strand lumber mill in Kenora. This mill began operations in October 2002. It requires several years of operation to determine its ultimate impact on the Northwest poplar demand. There are indications that once the review is complete the MROL could decrease by no more than three per cent. This amount of change would not satisfy the gap in long-term poplar supply, which bottoms out at 25 per cent less than the current demand.
White birch
The demand for white birch has been mostly theoretical until 2002 when pulpmills began to use more birch. As pulpmills used more birch in chip form, more birch lumber could be economically produced causing an overall increase in the actual demand for this species.
It is expected that a review of birch demand will show an increasing industrial willingness to use this species to replace the diminishing supplies of SPF and poplar. Long-term supply and demand for birch are expected to balance in only a few years time.
Northeast wood demand
SPF
The aggregated MROL for SPF appears to be in line with the true demand (utilization) and will not likely change as a result of the review.
Poplar
The previously aggregated MROL for poplar is likely lower than the expected utilization. Hence, the gap may be exacerbated.
White birch
The MROL for white birch was recently adjusted, so it is not likely to change. The aggregated MROL now recognizes the expansion of two OSB mills in Timmins and Englehart, a new pallet mill in North Bay and a proposed veneer mill along the north shore of Lake Huron.
White pine
The MROL reviews will likely result in an increase in the aggregated MROL for red and white pine. This is because current utilization exceeds the MROL for the region.
Tolerant hardwoods
Although there has been a slight increase in utilization over time, there will likely be a decrease in the aggregated MROL. The change should more closely reflect current utilization levels.
Southern region wood demand
SPF
The current MROL for SPF is not likely to change.
Poplar
As the predicted wood supply of poplar is to decrease in favour of other hardwood species, the aggregated MROL will follow the downward trend.
White birch
As the predicted wood supply of white birch is to decrease, the aggregated MROL will likely follow the downward trend.
White pine/red pine
The fact that the current white and red pine usage is greater than the MROLs suggests that the MROLs for white and red pine should be reviewed and revised to reflect current demand.
Tolerant hardwoods
Although there has been a slight increase in utilization of the low-grade hardwood resource, there will likely be no significant change to the aggregated MROL.
Strategy 2: Provide demand information to planning teams
The intention of this strategy is to ensure industrial wood demand is properly represented within the forest management planning process. This means MNR staff who deal directly with industrial wood requirements become involved in the planning process from the beginning and provide a fair and balanced analysis of the information used within the forest modelling and objective setting exercises.
Implementation of this strategy will lead to better representation of wood supply requirements within forest management plans and will help to address the issue of quality of information.
There is no assessment of the impact to wood supply for this strategy. Wood supply is determined on an individual management unit basis and the application of this strategy may result in changes on either the positive or the negative side.
Strategy 3: Promote best practices for forest management modelling
Background
The Best Practices for Wood Supply Modelling were assembled to guide resource managers in setting-up and conducting forest level analyses. They are meant to provide an analysis starting point and to provoke thinking about modelling assumptions and inputs. Those who conduct analyses should be cognizant of the impacts of choosing certain methods/inputs and the relationships between inputs.
Other models and decision support tools are used within forest management planning. The intention of Strategy 3 is to ensure the Best Practices for Wood Supply Modelling is implemented and best practices are developed for other models. The strategy also recommends that there should be MNR modelling experts available for the models supported by MNR to provide advice and foster consistency in use.
The adherence to a set of best practices together with the availability of MNR model experts will greatly assist in improving the quality and consistency of analyses, hence information. Inconsistent application of modelling techniques leads to errors in results – some of which can be significant.
Sensitivity analysis and wood supply
Extensive wood supply analyses were conducted in support of the State of the Forest Report, 2001. The ministry’s most current forest inventories, scientific and economic information, and strategic forest modelling methodologies were employed for these analyses. Small changes to modelling rules and assumptions were made and the affect on the results were noted. These are called sensitivity analysis. The State of the Forest Report analyses revealed key implications for wood supply modelling practices that were built into the Best Practices.
As one example of the implication of using the Best Practices, this section presents the results of a simple change to a single model input – forest succession.
Figure 29: Provincial Conifer Harvest Forecast Volume when Successional Ages are Changed by 20 Years
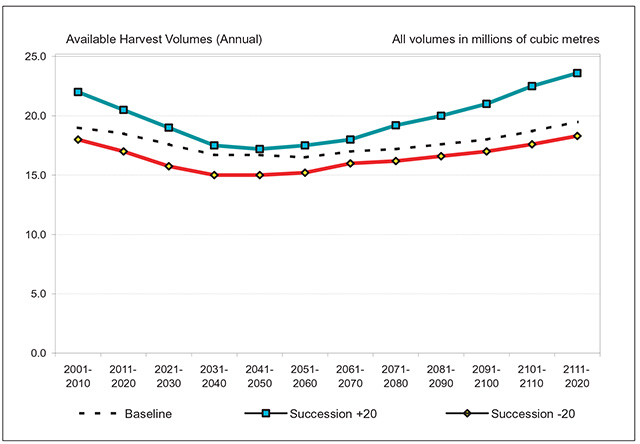
Forest succession is an important part of every wood supply model. Succession ages are used in modelling in an attempt to represent the approximate age a forest stand undergoes a substantial change in composition or stand description. The results of varying the age and rate of forest succession is described below. Figure 29 illustrates the impacts of varying succession ages by 20 years.
The Succession +20 alternative assumes that the current assumptions are 20 years off, and has moved them 20 years into the future. This not only moves the wood supply dip even further ahead, it means that forest stands are available for harvest for an additional 20 years. The most dramatic impact of this adjustment is an increase in available harvest volumes by 12 per cent. The impact is greatest in northern boreal units with an older age class structure. Only succession was adjusted for this alternative, no changes were made to yields or operability.
The Succession – 20 alternative is the opposite of the previous run, and assumes that stands begin to succeed 20 years earlier than we currently assume. As can be expected, the result is a 10 per cent drop in available harvest volumes.
The above example illustrates how changes in succession ages can affect available wood supply and thus the need for careful use of model inputs. Implementation of the Best Practices for Wood Supply Modelling will help to bring consistency to the analysis conducted by plan authors and allow for an easier verification by MNR modelling specialists. The result will be a greater confidence in the wood supply forecasts expressed in forest management planning.
Strategy 4: Improve growth and yield information
Growth and yield is identified as one of five research priorities needed to address the issue of quality of information. The other four priorities are forest succession, resource inventory, silvicultural effectiveness and guide effectiveness. A provincially coordinated program with a long-term commitment to collect information on growth and yield will assist greatly with addressing the issue of quality of information.
Improved growth and yield information will affect long-term wood supply in three ways:
- Improved local stand yield tables;
- The addition of small diameter volumes (tops) to yield tables; and,
- Managed forest yield tables.
Improved local stand yield tables
The development and use of local stand yield tables will more accurately predict local wood supply. This will help to clarify wood supply issues but will not necessarily increase or decrease total regional wood supply. It is not yet possible to estimate the effect of new local stand yield tables as there is insufficient data upon which to establish a trend.
Small diameter volumes (tops)
As discussed in the Regional Reports, there is a trend to making greater use of small diameter wood, either at mills or by bush-chipping. This trend toward greater utilization of available wood is encouraged in the Ontario Forest Accord by way of clauses 8 and 12 as one of the means to mitigate wood supply losses.
Until recently, forest industry generally utilized wood to a 10 cm top in SPF and 16 cm top for poplar and birch. Most yield tables were developed using these top diameter dimensions. The greater volume of available wood which has resulted from utilization of logs to smaller top diameters has not been generally recognized within the yield tables that are used for wood supply modelling. Hence, there is a potential under-estimation within the modelling of the wood currently available.
Table 6 reports the actual percentages of small diameter wood which are being achieved under clause 12 of the Forest Accord, in the Northwest and Northeast Regions. Since only a few forest management plans have used volume tables which recognize the smaller top diameters, the effect of adding the extra volume may be estimated from Table 6. The differences in utilization of undersized material between Northwest and Northeast Regions may be explained by significant differences in forest industry structure between the two regions. These differences are discussed in the Regional Reports section and under Strategy 7 impacts, below.
Figures 30 and 31 illustrate graphically the potential gain in yield which can be realized by incorporating undersized volumes into local yield tables. Figure 30 shows the estimated gain in the Northwest Region at year 2000 and the projected potential gain in the future for the low-point in the supply. The supply low-point occurs about 2030 for SPF and poplar and about 2080 for white birch. Figure 31 illustrates similar information for the Northeast Region.
It must be noted that the analysis shows the maximum potential of undersize recovery. Actual practice will be different as new local yield tables are prepared. Some new tables based on the collection of actual stand volume data may show decreases in net merchantable volumes in spite of the addition of undersized volumes. This may be due to errors in estimation in current yield curves or an overall decline in net merchantable volume due to factors such as an aging forest. Adding undersize volumes to smaller base volumes will not necessarily result in increases of long-term volumes but will help to reduce the impact of declines due to other factors.
Also, the gains made through increased utilization of tops are generally useable only for pulpmills. Only a small percentage of the gain can mitigate supply shortages faced by sawmills, veneer users or OSB mills. Any gains in supply for these users must be realized through improvements in integration with pulpmills.
Table 6: Sensitivity of Long-term Wood Supplies to Recovery of Undersize Volumes
Recovery of Undersize Material by Northern Ontario Forest Industry - 2002
| Species | Northwest Region: Total Volume Scaled | Northwest Region: % Undersized | Northeast Region: Total Volume Scaled | Northeast Region: % Undersized |
|---|---|---|---|---|
| Jack Pine | 3,167,284 | 2.0% | 2,890,693 | 0.5% |
| Spruce | 4,962,312 | 4.9% | 5,141,710 | 4.0% |
| Balsam Fir | 402333 | 3.6% | 199,410 | 2.9% |
| Spruce-Pine-Fir combined | 8,531,928 | 3.7% | 8,231,813 | 2.8% |
| White Birch | 161,783 | 25.9% | 247,511 | 13.1% |
| Poplar | 2,420,397 | 13.3% | 2,367,177 | 4.0% |
Managed forest yield tables
Managed forest yield tables will have an effect that is different from adding undersize volumes to local yield tables. Reducing the time necessary to grow harvestable trees in managed stands has the effect of making volumes of wood available during periods when they would not be available under longer growing periods.
However, the effect of reduced growing periods on the regional or provincial wood supplies will be limited by the amount of area in which the techniques can be appropriately applied. The estimate of possible yield improvement is included in Strategy 8 below.
Figure 30: Sensitivity of Wood Supply to Recovery of Undersize Volume – Northwest Region
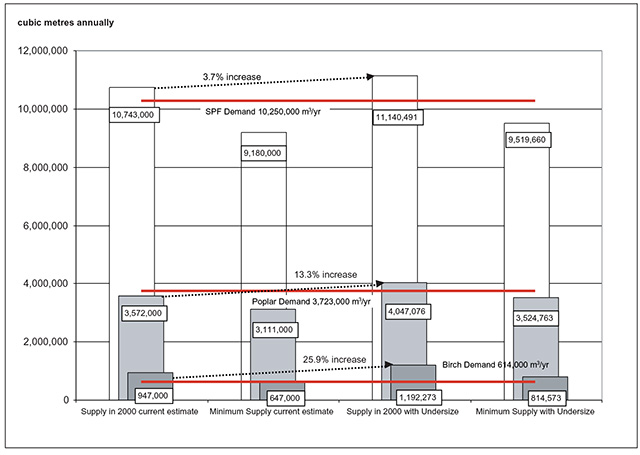
Figure 31: Sensitivity of Wood Supply to Recovery of Undersize Volume – Northeast Region
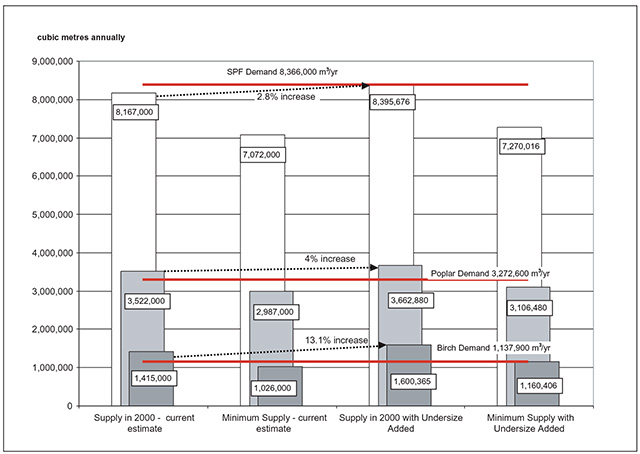
Strategy 4 is linked directly to Strategies 7 and 8. The implementation of Strategies 7 and 8 will increase the volume of wood supply available to forest industry, however the extra volume will not be recognized and modelled until it is included in the yield curves and volume tables. Implementation of Strategy 4 by itself, however, will not increase the actual volume of wood available to industry – it only acts to recognize the volume in the modelling. Strategy 7 seeks to improve the utilization of available wood, e.g. better use of top material, so the yield curves would recognize additional fibre availability. Strategy 8 recommends the implementation of reduced rotation programs, so the intensive yield curves would allow for earlier harvest operability. The effect of the new guide that requires increased volumes of wood to remain on site for habitat and diversity objectives may counter balance any yield gains made through Strategy 4.
Strategy 5: Improve forest resource inventory
This strategy looks to improving the quality of the Forest Resources Inventory as a basis for sound decision-making. It contains two separate approaches. The first part of the strategy seeks to improve the quality of the inventory through a coordinated approach to the surveying of forest resources. This approach will use the economies of working at a larger scale to find new techniques and reductions in cost per unit area.
The second part of this strategy recommends that forest industry and MNR work together to develop and implement an information system for forest inventory that includes successional modelling and growth and yield information. This strategy will allow for more detailed management of the forest resource and protection of non-timber values.
Application of this strategy should improve the quality of the information used in wood supply decision-making, however, the effect on available wood supply is expected to be neutral since gains in some areas are likely to be cancelled by reductions in others.
Verification of the appropriateness of areas selected for harvest will have a positive effect on the long- term wood supply. The degree of impact is impossible to determine, however it would likely provide only a small percentage of benefit.
Strategy 6: Improve knowledge of stand condition and forest succession
Strategy 6 builds on the improved inventory information described in Strategy 5. Better knowledge of the state of the forest together with a more comprehensive understanding of forest succession trends will support decisions that will benefit current and future wood supply. Where forest management plans forecast future declines in wood supply, an emphasis on the future succession and hence the predicted future state of a forest stand may help to eliminate the future wood supply gap. The example of allocating a declining mixed wood stand 20 years into the future may help fill in the future gap. One stand will make no difference to long-term wood supply; however, a shift in philosophy around scheduling harvest for future values can make a significant contribution to addressing the wood supply gap. This idea will be difficult to implement, particularly in the context of landscape planning requirements. Consideration of partial harvest systems in mixed wood stands may also assist in improving future wood supply forecasts.
Similar to Strategy 5 above, the verification of the appropriateness of areas selected for harvest will have a positive affect on the long-term wood supply. Again, the degree of impact is difficult to determine although the potential for benefit may be significant.
Implementation of this strategy will also help address the issue concerning quality of information. Forest succession is one of the key information priorities. The sensitivity of wood supply forecasts to changing forest succession ages is fully explored as an example in the assessment of Strategy 3, above. In the example, increasing the succession age by 20 years increased wood supply by 12 per cent. Decreasing the succession age by 20 years decreased wood supply by 10 per cent.
Strategy 7: Increase utilization of available wood
The seventh strategy targeted at addressing the wood supply issue in the Northeast and Northwest Regions calls for industry to make greater use of available volume from harvested areas. Under clauses 8, 11 and 12 of the Ontario Forest Accord, increased volume from tops, salvage from fires and blowdown, and areas of low-volume harvest were referenced. Since 1999, the forest industry has been using this volume, to a greater or lesser degree, to alleviate the losses resulting from areas removed from the managed land base by the Ontario Living Legacy.
Implementing this strategy will yield a net positive increase in volume for wood supply. The additional volume to be gained through the use of tops depends on the type of operations and the degree that full utilization is currently being achieved on a forest. Fibre utilization is greatest with full-tree chipping, followed by tree-length cut and haul operations. Cut-to-length and roadside processing into shortwood lengths create short pieces at the top which can not be safely transported to mills. The gains made by utilizing smaller tops are lost because of the short pieces left at the harvest site. Processing to a smaller top size, however, does reduce the usual volume losses associated with cut-to-length and roadside processing into short lengths.
Undersize recovery experience in the Northwest Region indicates that there could be a higher rate of recovery in the Northeast Region – refer to Table 6. This greater recovery is due to an extensive use of bush-chippers during the last ten years in the Northwest. The potential for a similar use of chippers in the Northeast Region is limited by the structure of the forest industry relative to the Northwest. Forest management units that provide a higher percentage of fibre to OSB, veneer and sawmills will have a smaller recovery percentage than forests that produce a higher percentage of wood to pulpmills.
The forest industry has increased their utilization of available wood and there is evidence of potential for greater utilization; however, there is a limit to the undersized wood that can be recovered. Initial investigations of bush-chipping showed that up to 10 per cent undersize volume could be recovered from SPF and up to 25 per cent from birch and poplar. The 2002 data from the Northwest Region indicates industry is currently utilizing 3.7 per cent of the 10 per cent potential for SPF and 13.3 per cent of the 25 per cent potential for poplar.
Therefore, if undersize recovery were perfect, additional fibre volumes would increase by no more than 6.3 per cent in SPF and 11.7 per cent in poplar in the Northwest. In theory, the recovery should be similar in the Northeast. In reality however, these percentages are far too high to use for wood supply estimation because bush-chipping cannot be used universally. Wood chips are appropriate only for pulpmills or the composite industry and bush- chipping has not been demonstrated to be an economically feasible option where the production of sawlogs, OSB logs, and veneer logs is a primary objective of harvesting operations. Pulpmills can consume a much higher percentage of very small diameter wood. The key to maximizing undersize recovery will be to sort timber at the right place in the harvesting and transporting operations to ensure the efficient production of the required products at acceptable costs.
Achieving significantly greater recovery levels from tops will often require costly changes in wood processing equipment and restructuring of forestry operations. Also, the majority of the fibre that can be recovered is useable only in the pulp or composite product industry – it will not provide direct benefit to the sawmilling or veneer industry where the greatest shortages exist. In some cases, the small diameter top volume can replace larger logs which are currently being chipped for pulp or composite materials, however integration between different mill types, as discussed in Part 2, has cumulatively increased the best use of the better quality logs over the past two decades. Hence, the increase of small diameter wood fibre will not improve wood supply to any great extent for saw and veneer mills.
A rigorous program on the part of forest industry and supported by MNR, targeted at improving the utilization of available wood, will help to mitigate future wood supply shortages. The actual percentage of gain needs to be investigated through a cost/benefit analysis. At the same time, losses to wood supply due to other factors should be analysed and reported on.
Strategy 8: Use silviculture to increase forest productivity
Analyses conducted at the regional and provincial level in support of the State of the Forest Report, 2001 indicate that an intensive silviculture program (reduced rotation) has the potential to offset shortfalls in wood supply in the medium term, and can increase harvest levels in the long-term. Figure 32 compares the long-term wood supply level developed using available intensive silvicultural practices to a baseline run, both for SPF species group. These two modelling predictions are compared to the OFAAB Sharing Threshold to provide some context. Note that the intensive silviculture run crosses the Sharing Threshold 20 years in advance of the baseline run.
The baseline is a generic alternative that has all the characteristics of a normal FMP model, without the detailed constraints that many FMP teams add to their model to refine results. This run is similar to the individual management unit modelling except that the yield curves and management assumptions use standard approaches for ecological regions. Generally, this alternative yields five to ten percent more available harvest volume than a normal FMP model, although in some cases it can yield up to ten percent less. This run provides a basis of comparison with other runs.
The intensive silviculture alternative provides wood supply modelling with some additional incentives for increasing silvicultural investment. A 10 to 20 per cent increase to the yields of intensively managed stands over the other alternatives, additional thinning and tending options and other opportunities to increase productivity were inputs to the models. The intensive silviculture line in Figure 32 indicates the effect of increasing yields on regenerated stands by 15 per cent. Fifteen per cent was selected based on contribution of two factors. First, a 10 per cent gain based on an assumption that intensive silviculture can take place on 20 per cent of the land base and yield 50 per cent increase in volume where it is applied. And second, a further five per cent gain which is attributable to genetic gains and immediate volume gains from thinnings.
The analysis indicates that the short-term effects of these inputs are minimal, as Ontario has little area currently managed under an intensive regime. The real value of these options will be realized slowly over the next few decades, as stands in this class can be established, or existing stands can be modified to increase potential yields. This alternative softens the drop in wood supply in 2040 and 2050 by 5 to 10 per cent. The thinning and tending options available in this alternative are most often used by well-accessed boreal forest management units, preferring jack pine to spruce in most cases. In the development of actual forest management plans, a range of silvicultural practices are used to achieve plan objectives. Intensive practices as described in Strategy 8 are feasible and desirable on only a limited amount of the landbase.
Figure 32: Provincial Harvest Volume Forecasts – Baseline and Intensive Silviculture for SPF
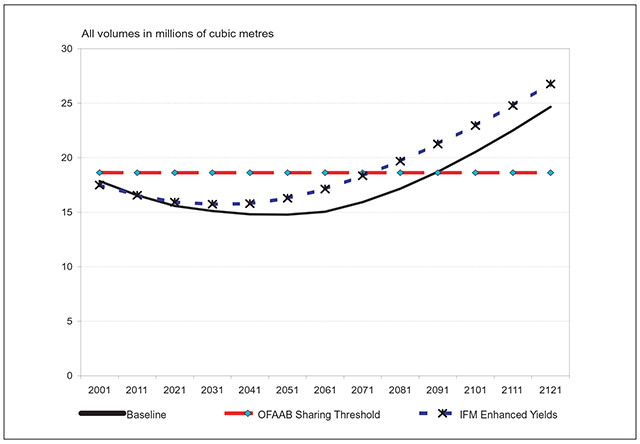
Enhanced silviculture on 10 to 12 percent of productive Crown forest land may yield an improvement of 1 to 3 percent during the lowest point in long-term wood supply. In the Northwest Region, this effect could result in a 100,000 to 300,000 m3 contribution to the 1 million m3 SPF gap in long-term wood supply (by 2030). There is similar potential in the Northeast Region. The potential effect applies to all species groups.
Strategy 9: monitor silvicultural effectiveness
Silvicultural effectiveness monitoring (SEM) is one of the identified priorities required for improving wood supply knowledge. It is the basis for silvicultural decisions within forest management planning.
Effectiveness monitoring is a multi-stage program that provides information on post-renewal forest succession and outcomes of different silvicultural treatments. This information allows forest managers to compare the relative merits of different treatments including which treatment provides the best growth potential on the site. To this extent, silvicultural effectiveness monitoring will provide a large amount of information for improving the quality of information used in wood supply modelling. It is also used to set the various regenerations standards used in forest management planning (Silvicultural Ground Rules).
The end result of silvicultural effectiveness monitoring is increased productivity at the forest level. SEM uses adaptive management as part of an overall silviculture program with a goal of increasing future wood supply when integrated with Strategy 8 above. The potential for increased wood supply volume is therefore captured in the discussion for Strategy 8.
Strategy 10: Implement fire management and forest protection
The intention of Strategy 10 is to minimize the amount of forest lost to fire and other destructive agents.
As presented in Part 3, the average annual area of forest burned in wildfires during past 25 years in the Boreal Forest amounts to 60,500 ha/year. Potentially this incurs a sizeable impact on wood supply in Ontario. Not every hectare burned, however, has a direct affect on wood supply; some areas are re- burned, some are decadent or low-volume and hold very little potential for commercial forestry, and some areas are excluded from harvest operations. Notwithstanding these caveats, any effort that reduces area burned will likely result in more commercially available forest and greater industrial wood supply. The amount of this impact will be tied to the level of protection afforded by the approved fire management strategy. A fire management strategy that places an emphasis on commercial wood values will have a positive affect on wood supply even if overall area burned is not greatly affected. The key is to direct efforts where greatest impact for maintaining wood supply will result.
Strategy 11: Ensure guide effectiveness and efficiency
Strategy 11 is part of the group of strategies which will address the issue of quality of information. The outcome of following this strategy may be increased wood supply from reducing redundancies and contradictions in guides, however increased wood supply is not guaranteed or even indicated as a probability.
Modelling for wood supply is very dependent on managing for a set of forest or societal values. These values often appear as objectives in the plan or as inputs into modelling. Management decisions concerning these inputs are made within the forest management plan and are normally directed by the guides. Therefore the guides, their interpretation and their implementation have a direct impact on wood supply.
Area reserved from harvest for wildlife habitat is a easily understood example of the affect of a guide on wood supply. The area surrounding an eagle’s nest or a lake with moose aquatic feeding area will be reserved from harvest in an effort to protect the identified value. Better understanding of the affect of development or disturbance near these values and the proximity of the disturbance can be used to refine the guides or their implementation. This refinement will help forest managers make decisions in forest management that protect the value and meet the intent of the guide without excessive reserve.
As guides are reviewed or new ones are developed, MNR will be ensuring they reflect current scientific knowledge and determining how effectively they meet their intent. As part of this examination, MNR will be considering the social and economic implications of the guide and its implementation.
The intent of this strategy is to ensure that guides are based on the best available science and that the results of the implementation of guides are monitored for their effectiveness and efficiency. Because guides have large implications for wood supply, increased understanding of the science behind them is a priority. It is difficult to assess the potential as it is anticipated there will be both positive and negative impacts on wood supply, however it will add considerably to the quality of information used in forest management planning.
Great Lakes-St. Lawrence Forest
The remaining nine strategies apply specifically to the Great Lakes-St. Lawrence Forest and the assessment of their impact is examined only in the context of this broad forest zone.
Many of the nine strategies discussed below are not quantifiable. Some are linked directly to the forest management planning process, where MNR is to ensure that objectives, strategies, standards and prescriptions are in place to address the implementation of these strategies as they relate to wood supply issues. Other strategies are information sharing or collaborative studies to determine results that in turn will generate quantifiable information for the future. We have provided a descriptive assessment instead on the non-quantifiable strategies. The following text is that assessment for the Great Lakes-St. Lawrence Forest strategies.
Strategy 12: Use silvicultural ground rules
Despite technological improvements at the sawmill, there is currently a shortage of high quality sawlogs and veneer. The present problem has always been attributed to past high-grading practices, but the fact that much of the hardwood resource is growing on shallow soils of only modest fertility is a key factor too. While the log quality issue is expected to persist for many years, the tree marking and stand improvement efforts that began 30 years ago and that have become increasingly intensive of late are expected to reverse this trend eventually.
The forecast is for this situation to continue well into the foreseeable future. Figure 24 (Supply/ demand Forecast for Tolerant Hardwood Sawlogs and Veneer, Southern Region) shows that the combined hardwood sawlog and veneer supply is expected to meet the current level of demand in 30 years, (approximately 242,000 m3).
In addition, the hardwood sawlog supply is expected to peak in about 80 years, at which time sawlogs and veneer will make up 45 per cent of the hardwood cut, compared to 32 per cent today.
There is a strong consensus, in both government and forest industry, that the long-term solution lies in continuing the current practices as described by this strategy. There is still work to be done in refining residual stocking objectives, setting cutting cycles and matching treatment to site, but that is just fine-tuning of the present approach.
Strategy 13: Ensure logging damage standards for residuals
The success of partial harvesting systems is dependent upon the survival and growth of the residual trees and regeneration. It is, therefore, extremely important that any harvesting operation leave as many stems as possible undamaged and the site in a productive state.
A wide assortment of injury and damage maybe encountered such as:
- Bole wounds caused by bark scraping;
- Root breakage;
- Branch breakage and resulting crown damage;
- Stem breakage; and,
- Soil/site damage – erosion/rutting.
As mentioned previously, there is a current shortage of quality material and any stem or site damage can affect the future wood supply. MNR and other resource partners began to examine these issues in the early 90’s. The result was the development of management standards that are contained in guides such as A Silvicultural Guide for the Tolerant Hardwood Forest in Ontario.
As the forest industry is relying on new harvesting methods and a wider range in the seasons of operation, projections that are more accurate must be developed to account for the potential negative impacts to stem and site vigor. A basic premise of selection silviculture is that consecutive improvements in stand quality and vigour can be achieved with effective tree marking and careful logging. However, there is potential for damage to the residual stand with successive logging operations, which can counteract the “value-added” benefits of good tree marking. Unfortunately, little regionally specific data is available that describes the incidence or impact of logging damage, especially when comparing different harvesting equipment or seasons of operation. At the present time, there are a number of studies through various partnerships that are examining careful logging, rutting and site disturbance, harvest season and harvest methods. These will then provide results to refine growth and yield models to reflect changes in productivity and stand quality/quantity that may result from logging damage.
Strategy 14: Investigate logging damage standards for mechanical harvesting
The efforts to minimize logging damage must continue, and techniques must be found to allow mechanical harvesters to operate in hardwood forests within the existing logging damage standards. High worker turnover, a greater proportion of pulpwood in cuts, the need for better worker safety and tighter economic margins are all factors that will lead the logging sector in south- central Ontario toward greater mechanization in the future.
According to SFL companies, current mechanical harvesting comprises a range of 5 to 50 per cent of the harvest level with the potential in five to ten years to be in the 50 to 70 per cent level across the region.
This strategy is not quantifiable but is a collaboration between MNR, forest industry and other partners to be pro-active as to the future of mechanical harvesting and the management of our forests.
Strategy 15: Maximize salvage of high quality logs
In the short term, there may be room to improve quality log supply slightly without sacrificing sustainability at all, by having certified tree markers focus to a greater degree on “salvage”. A strategy such as this calls for tree marking prescriptions to require high quality stems with high mortality risk to be marked first, before other high-risk trees. The Ontario Tree Marking Guide describes these factors and experienced markers do this now. In discussion with the SFL holders, it appears most are implementing this strategy so it is not expected to provide a significant benefit for the supply of quality logs.
Strategy 16: Increase utilization of low-grade wood
The surplus of low-grade hardwood pulpwood and fuelwood has been a chronic and long standing problem. Over the past 20 years, there has been a gradual improvement in this situation. This is due to three factors: increased production at the paper mills that use hardwood pulpwood, the utilization of continually smaller logs by sawmills and the new SFL arrangements that have encouraged the industry to meet more of its pulpwood needs from Crown land in order to boost SFL production, lower SFL costs and meet the CFSA utilization standards. Hardwood utilization is better now than at anytime in the past. As illustrated on Figure 26 (Supply/demand Forecast for Low Grade Tolerant Hardwoods, Southern Region), the actual utilization of hardwood pulp and fuelwood between 1990–94 and 1995–99 has steadily increased and will probably continue. It would be advantageous to move even more low-end hardwoods because more sawlogs would be freed-up and more stand improvement could be carried out. But, the fact remains that pulpwood supply is greater than demand.
Increased utilization of low-grade wood will have a direct affect on the issue of the surplus. Utilization is monitored by MNR staff within Industry Relations Branch and is reported within the management unit annual reports.
Strategy 17: Permit export of low-grade hardwoods
As stated in the discussion on Strategy 16, the current surplus of low-grade hardwoods has been a long-standing issue. At present, the most effective approach is the continuation of the current industry efforts to move as much pulpwood as is economically possible, including moving this material out-of- province. For its part, MNR must be receptive to multi-year export permits, in accordance with the CFSA, as these permits are necessary to secure large contracts with U.S. producers.
When markets have been receptive for this type of material, Southern Region has pursued these export permits. As an example in 2000/2001, a multi-year export permit resulted in over 15,000 m3 of pulpwood shipped to mills in the U.S. The amount of wood shipped and hence the impact on the identified issue will depend on markets.
Strategy 18: Study private land wood supply
Almost half of the forested land on the Shield and almost all of the forested land off the Shield are privately owned. Private land wood supply is just as important to the south-central forest industry as is the Crown land supply. Despite its importance, though, relatively little is known about it, including its sustainability.
MNR has an interest in the sustainability of the private timber resource but it does not regulate private land forestry. If MNR is to achieve a goal of sustainability in wood supply, it must help to bring about a better balance between the forest industry and the resources available to it. In Southern Region, where private wood makes up half of all the wood supply, the private land must be factored into the equation and to do so, MNR must acquire a better understanding of the sustainability of the private land harvest.
A project plan to undertake a Southern Region Private Wood Supply Study has been prepared and approved. The plan outlines the Project Team, Technical Advisory Committee that includes forest industry and deliverables with timelines. Phase one of the project is to examine the northern portion of the region (the “Area of the Undertaking”) where forest information is generally better. Phase two will cover the remainder of the region in the second year. The Technical Advisory Group has developed a methodology for phase one of the project. It is anticipated that this phase will be initiated in 2004 with a completion by March 2005. The assessment of wood supply on private land will not regulate private land forestry, however it will assist greatly with an overall understanding of the sustainability of the forest resource in south-central Ontario.
Strategy 19: Notify poplar users of long-term decline in supply
Time, natural succession, and silvicultural practice are all working against poplar wood supply in the long term. Both of the region’s poplar species are relatively short-lived and much of the region’s poplar is now over-mature and in a decadent condition. Most poplar stands in south-central Ontario are mixed with other species, and succession trends are toward maple and balsam fir.
Although there is a surplus now, the forecast is for a poplar deficit in as little as 15 years. Figure 20 (Supply/demand Forecast for Poplar, Southern Region), shows that, regionally, poplar supply will fall below the demand level by 2015.
The forces contributing to this downward trend are overwhelming. It would not be possible to bring on a replacement crop of poplar in the time remaining, given the age class imbalance. Nor is poplar production even desirable on sites capable of growing better hardwoods or pine.
This strategy is an information sharing undertaking so the forest industry can assess the situation themselves and develop business decisions suitable to their situation in a timely manner.
Strategy 20: Ensure regeneration of white pine shelterwoods
There is a general concern among forest managers that a decline in white pine supplies may occur when the first cohort of the region’s white pine managed under the shelterwood system reaches the removal cut stage, over the next 20 years. The reason for the concern is the poor natural regeneration that typically results following white pine shelterwood seeding cuts on competition prone till sites. The Reports of Past Operations from current management plans show success rates ranging from 11 percent to 79 percent in white pine across the region. The general belief is that current silvicultural efforts, which rely more heavily on artificial methods, will produce much better results.
The problem, should it arise is expected to be short- term and self-limiting. Shelterwood removal cutting may resume as soon as the regeneration in these old cutovers is brought up to standard.
Only some of these backlog areas are known and these are listed in the inventory of “xyz lands” for each SFL. At this point, this strategy is not quantifiable, but MNR is committed to monitoring through SFL operations to ensure that SFL holders regenerate backlog areas as per the SFL. MNR will work with the SFLs to address this potential concern.
Part 5. Future
This Provincial Wood Supply Strategy has been produced with the goal of ensuring that there is a sustainable wood supply at an appropriate level for Ontario’s primary wood-using industries within the bounds of overall forest sustainability. They bring together wood supply forecasts and industrial requirements into one framework document, together with strategies for resolving challenges and taking advantage of opportunities. There are a number of future initiatives or directions for sustaining wood supply that are discussed below.
Related to this strategy, MNR is proposing to develop a Forest Sector Strategy for Ontario. The Provincial Wood Supply Strategy will provide information and background for this economic strategy, in particular in describing the state of the resource through the supply and demand information.
Progress on the Enhanced Forest Management – Science Information and Analysis initiative of the Provincial Forest Policy Committee will also have implications for the implementation of this strategy. This science related initiative will focus on establishing a source of dedicated, long-term funding that will assist the government and the forest industry in better understanding silviculture effects and effectiveness (on growth and yield, environment etc.) in order to maximize returns on silviculture investments. Action on this project will assist with the implementation of the strategies contained within this document.
This strategy is intended to be a living document, which is to be updated on a periodic basis to present new supply and demand information and incorporate new ideas for resolving challenges. MNR will endeavour to update supply information within the wood supply database on an annual basis as new forest management plans are approved. The forest resource requirements (MROLs) will be reviewed on a periodic basis and when required. The supply and demand database (Appendix 1) is available only in an electronic version and updates will be made in this electronic form on the MNR internet website. Information and graphs presented within the text of the Provincial Wood Supply Strategy will only be updated when the entire document is revised.
In an effort to produce these strategies on a limited schedule, their scope was restricted. Future updates of these strategies will consider such items as:
- Wood supply planning at a woodshed or sub- regional level:
- One of the benefits of recent forest industry mergers has been the ability to plan and build wood flow strategies on a woodshed basis. The individual management unit remains the basis for forest management planning because of the emphasis on setting objectives at a local level. In setting management unit objectives, there is also a need to consider the local wood demand and supply circumstances within a regional context. Company woodsheds can provide the regional context in which wood supply planning can be set in a manner similar to other management objectives such as habitat. In this way, wood supply can be more effectively managed within a regional or sub-regional context.
- Some forest industries have begun to examine their strategic and operational wood supply planning on an entire woodshed basis. Development of spatial tools, for instance, will assist in achieving the most effective flow of wood to the right destination at the minimum cost.
- MNR will need to work with industry to investigate and realize the wood supply benefits of broader scale planning.
- Expanding socio-economic analysis:
- Achieving the balance between wood use and other forest values requires a good understanding of the socio-economic value of all forest resources.
- Socio-economic analysis should be given greater emphasis to better evaluate the significance of wood supply and other forest values within forest management planning.
- Refining the forecasts of product breakdown for sawlogs and veneer for white and red pine, poplar, white birch and tolerant hardwoods:
- Supply information is generally not well understood or reported on a product basis. This is most critical for the mills in the Great Lakes-St. Lawrence Forest where there are chronic shortages of sawlogs and veneer, and associated surpluses in low- grade product.
- The refinement of supply forecasts are also very important to industry throughout the Boreal Forest. Individual strategies should specifically address the product differences where appropriate, as the wood supply strategies evolve.
- Improving data availability for clients:
- The Ministry of Natural Resources has made great strides recently in making data available to its clients and the public. Appendix 1, the wood supply database, is a good example of making current information broadly available. The timely and convenient availability of information and data on wood supply should continue to be an objective.
- Monitoring progress.
- Changes in supply will be monitored during the next five years as forest management plans are updated and their supply numbers are summarized to regional totals. These changed in supply will be monitored also through the Forest Resources Assessment as set out by FRAP.
- Wood supply projections year by year will be archived within the MNR database to help assess supply trends.
- Finally, emerging trends and issues will be monitored and additional strategies considered.
- Assessment of the effectiveness of the strategies:
- The Provincial Wood Supply Strategies contain a number of strategies that are intended to improve the level of wood supply available to industry. The projected potential of these strategies to address the wood supply issues is contained in Part 4 of this document.
- The continued testing and assessment of these strategies will be addressed in part within the analysis provided by the Forest Resources Assessment, which is a requirement of the Forest Resource Assessment Policy.
Appendix 1: Wood supply for each forest and region in Ontario
Wood supply and demand information, as well as “Room to Grow” utilization benchmarks, is provided in chart form within an Excel™ spreadsheet. This spreadsheet is available upon request by emailing the Manager, Timber Allocation and Licencing Section in Forest Industry Division.
The information will be updated annually to incorporate changes to wood supply and benchmark information.
Appendix 2: Best practices for wood supply modelling
These Best Practices for Wood Supply Modelling were assembled to guide resource managers in setting-up and conducting forest level analyses. They are meant to provide an analysis starting point and provoke thought on model assumptions and inputs. Those who conduct analyses should be cognizant of the impacts of choosing certain methods/inputs and the relationships between inputs.
Scope
Analytical techniques used to assess forest resource supply are necessarily simplifications of the real world. Many of the factors used as inputs to the analysis are uncertain due in part to variations in physical, biological and social conditions. Ongoing science-based improvements in the understanding of ecological dynamics will help reduce some of this uncertainty. These best practices were developed through a synthesis of current information and expert opinion. They will be updated periodically as our understanding of analytical approaches/procedures improves, therefore please ensure to use the most recent version when conducting analyses.
The most recent version of the Best Practices for Wood Supply Modelling is available upon request by emailing the Manager, Timber Allocation and Licencing Section in Forest Industry Division.
It is located under Forest Publications with the electronic version of the Provincial Wood Supply Strategy.
Principles
Analysts should attempt to reflect as closely as possible operability and forest management factors (guides, yields, etc.) of current practices. It is not appropriate to base analyses on unsupported speculation, although sensitivity and risk analyses can be used to investigate any number of hypotheses.
In keeping with the objective of good forest stewardship, projected short and medium-term harvest levels should be compatible with a smooth transition to the long-term level thus, timber supply should remain stable enough so that there will be no inordinately adverse impacts on current or future generations.
51880
(0.8 k P.R., 01 06 04)
ISBN 0-7794-6269-6 Printed on recycled paper.
Footnotes
- footnote[1] Back to paragraph This report pertains only to the “Area of the Undertaking” as designated by the Class Environmental Assessment for Timber Management on Crown Lands in Ontario, and as shown on Figure 1. Virtually all commercial harvesting on Crown lands occurs inside this area.
- footnote[2] Back to paragraph Declaration Order Regarding MNR’s Class Environmental Assessment Approval for Forest Management on Crown Lands in Ontario, MNR-71.
- footnote[3] Back to paragraph Refer to Ministry of Natural Resources - Beyond 2000, Queen’s Printer for Ontario, 2000. Copies are available from the Natural Resources Information Centre, 300 Water Street, P.O. Box 7000, Peterborough, Ontario, K9J 8M5.
- footnote[4] Back to paragraph FRAP was a requirement of Term & Condition No. 105 of the Environmental Assessment Board’s approval of the Class Environmental Assessment by the Ministry of Natural Resources for Timber Management on Crown Lands in Ontario.
- footnote[5] Back to paragraph . Ministry of Natural Resources - Beyond 2000, Queen’s Printer for Ontario, 2000. Copies are available from the Natural Resources Information Centre, 300 Water Street, P.O. Box 7000, Peterborough, Ontario, K9J 8M5.
- footnote[6] Back to paragraph . Ontario Forest Accord Advisory Board. 2002. Room to Grow: Final Report of the Ontario Forest Accord Advisory Board on Implementation of the Accord. Ont. Min. Nat. Res. Sault Ste. Marie, ON.
- footnote[7] Back to paragraph . Appendix 1 is in the form of an Excel™ workbook containing wood supply, wood utilization and OFAAB data for the entire province. A pivot table in the file allows the reader to view raw data and produce summaries and graphs for any management unit, region, species group and (in some cases) product.
- footnote[8] Back to paragraph . PTSBS was the MNR’s provincial timber scaling and billing system that was in used up until March 31, 1999. TREES is the current wood measurement accounting system; the acronym stands for Timber Resource Evaluation System.
- footnote[9] Back to paragraph . The MNR has established recognized operating levels for all of Ontario’s licensed mills based on their current capacity and historic consumption levels. A number of factors, including markets, prices, labour and operating logistics, prevent mills from operating at their full productive capacity. MROLs tend towards mill capacity but they are usually higher than actual usage. The MROLs for individual mills are broken down by their various supply sources, including Crown management units, private lands, federal lands, other provinces, and log imports from the United States. MROLs are updated every five years or as needed to keep the Ministry apprised of current industrial demand. For complete information on MROLs, the reader should refer to Wood Disposition Process and Regional Wood Supply and Demand Outlooks: Phase 1.
- footnote[10] Back to paragraph . The six species groups are tolerant hardwoods, white and red pine, poplar, spruce-pine-fir (SPF), white birch and other conifers.
- footnote[11] Back to paragraph . There is no requirement for mills consuming less than 1,000 m3 of roundwood annually to be licensed.
- footnote[12] Back to paragraph . SFMM is the strategic forest management model used in calculating allowable cuts on Crown land management units, and in making long-term wood supply forecasts.
- footnote[13] Back to paragraph . Plonski, W.L., Normal Yield Table for Ontario, Dept. of Lands and Forests, Silviculture Series No. 2, Toronto, Ontario, 1960.
- footnote[14] Back to paragraph . There is a 9th pulpmill in Thunder Bay that uses only recycled cardboard fibre.
- footnote[15] Back to paragraph . W.L. Lees and Associates 1999, The Economic Contribution of the Primary Forest Products Industry to Northwestern Ontario, The Northwest Forest Network.
- footnote[16] Back to paragraph . For a definition of supply and demand and for an explanation of the data sources used, please refer to Part 2.
- footnote[17] Back to paragraph . W.L. Lees and Associates 1999, The Economic Contribution of the Primary Forest Products Industry to Northwestern Ontario, The Northwest Forest Network.
- footnote[18] Back to paragraph . Part 1 contains supply and demand definitions as well as an explanation of the data sources referred to here.
- footnote[19] Back to paragraph . Lumber prices improved from the early 1990s and showed much better return during the mid to late 1990s.
- footnote[20] Back to paragraph . The NE/SC Hardwood Project was a 2000 Government of Ontario initiative in which proponents were invited to make a proposal to build a new facility or expand an existing one, based on the available, unutilized white birch and low-grade tolerant hardwoods in northeastern and south-central Ontario. Fourteen proposals were made and four were accepted, none of them for low-grade tolerant hardwoods.
- footnote[21] Back to paragraph According to Central and Eastern Ontario: Healthy Forests, Healthy Business. Ontario Ministry of Natural Resources, Publication No. ISBN 0-7794-1481-0, 2001. Copies are available from the Ottawa Valley Economic Development Office, Renfrew, Ontario.
- footnote[22] Back to paragraph . At the time of writing, one of these SFLs is pending. The licence held by the Algonquin Forestry Authority is not actually an SFL, but an SFL-like arrangement.
- footnote[23] Back to paragraph . Wood Disposition Process and Regional Wood Supply and Demand Outlooks 1998, Ontario Ministry of Natural Resources.
- footnote[24] Back to paragraph Best practices for wood supply modelling are listed in Appendix 2 “Best Practices for Wood Supply Modelling.”
- footnote[25] Back to paragraph . The state of a forest stand is a product of age, species, site and past disturbances, i.e. fire, blowdown, harvesting.
- footnote[26] Back to paragraph . Silvicultural Effectiveness Monitoring Manual for Ontario, Ministry of Natural Resources, 2001, Queen’s Printer for Ontario
- footnote[27] Back to paragraph Beyond 2000 – Ministry of Natural Resources – Strategic Directions, Ministry of Natural Resources, 2000, Queen’s Printer for Ontario
- footnote[28] Back to paragraph . National Hardwood Lumber Association, 322 S. Michigan Avenue, Chicago, Illinois 60604.
- footnote[29] Back to paragraph . Anderson, H.W. and Rice J.A., A Tree-marking guide for the tolerant hardwoods working group in Ontario, 1993, Ontario Ministry of Natural Resources, Science and Technology Series, Volume 8.
- footnote[30] Back to paragraph . UGS refers to “unacceptable growing stock”. The UGS category includes cull trees and trees that are at risk due to structural, pathological or other health problems. Most UGS trees contain low-grade products, but trees with high-quality stems can have health problems too.
- footnote[31] Back to paragraph . The NE/SC Hardwood Project was a 2000 Government of Ontario initiative in which proponents were invited to make a proposal to build a new facility or expand an existing one, based on the available, unutilized white birch and low-grade tolerant hardwoods in northeastern and south-central Ontario. Fourteen proposals were made and four were accepted, none of them for the low-grade tolerant hardwoods of south-central Ontario.
- footnote[32] Back to paragraph . Sub-section 30(1) of the CFSA requires that trees cut on Crown land be manufactured in Canada. Exemptions to this provision may be granted where no market for the wood exists in Canada. Chips produced as a by-product of the manufacture of lumber are deemed to have been manufactured, and are automatically exempt from this clause. Export permits are limited to a maximum of five years to allow for opportunities for markets to develop within Canada.
- footnote[33] Back to paragraph . FRI refers to Ontario’s forest resource inventory system, a system that provides information on forest cover, species composition, stand age, height, stocking, site class, and ownership. The date of the last private land inventory (or the aerial photography on which it is based) ranges from 1969 to 1987 across the region.
- footnote[34] Back to paragraph . Uniform shelterwood is a silvicultural harvest method in which the mature stand is removed in a series of cuts, and the new stand is established in its understory. In Ontario, white pine shelterwood cuts typically consist of four cuts about 20 years apart: a preparatory cut to thin the stand and produce large, full crowns; a seeding cut to establish regeneration in the understory; and two removal cuts in which the remaining mature trees are removed and the regeneration is released.