Public Accounts 2023–24: Annual report
The annual report is a high-level summary of the fiscal year’s results. It includes financial statements, analyzes the state of the Ontario government’s finances and outlines achievements for the fiscal year.
Foreword
I am pleased to present the 2023–24 Public Accounts for the Province of Ontario. The Public Accounts provide the people of Ontario with a clear and comprehensive view of the province’s finances. This year marks the seventh year in a row that the Public Accounts has received a clean audit opinion from the province’s Auditor General.
This document outlines the care our government has taken to continue delivering on our commitments set out in the 2023 Budget: Building a Strong Ontario while safeguarding the province’s economic position for future generations.
Here in Ontario, we are creating more jobs with bigger paycheques for workers, while keeping costs down for families and businesses. Our plan is attracting domestic and international manufacturing investments, expanding the province’s electricity capacity, kickstarting innovation and helping small businesses thrive.
The 2023–24 Public Accounts shows that our government is building Ontario by investing $195.2 billion across all programs. This represents a 4.7 per cent or $8.8 billion increase in program spending over the previous fiscal year. We are continuing on a clear path back to balance, with revenues up $52 billion since we took office.
Delivering on the most ambitious capital plan in Ontario’s history remains a priority for our government. That is why infrastructure spending increased by $4.4 billion, to a total of $23.6 billion, to build roads, public transit, hospitals, schools and other community infrastructure that people rely on. This includes eight kilometres of new lanes added to Highway 401 in Cambridge, new contract awards to build the Bradford Bypass, and our historic plan to expand the subway system by 50 per cent.
In education, our government continues to invest in the repair and construction of new schools. Approximately $1.4 billion in funding supported nearly 3,500 repair and rehabilitation projects. In the 2023–24 school year, 21 new schools and additions were opened, creating over 7,000 new student spaces, including six French-language school projects and over 700 child care spaces. That means more Ontario students have begun the school year in modern, state-of-the-art classrooms.
In health care, our government has continued to bring care closer to home. By increasing investments in the health sector by $7 billion or 8.9 per cent in 2023–24, more money is being directed towards local hospitals and health care facilities to support more convenient care closer to where people live.
To help ensure public safety, our government has increased investment in the justice sector by 10.9 per cent, to a total of $6 billion. This includes fighting auto theft, transforming correctional services in Northern Ontario, and increasing access to justice in communities across the province.
The results in the 2023–24 Public Accounts show that we remain laser focused on a targeted, responsible approach to the province’s fiscal plan, creating the conditions to attract jobs and investments, building critical infrastructure and providing the people of Ontario with the services they depend on.
Our government will continue to build Ontario, so it remains the best place to work, live and raise a family, anywhere in the world.
Original signed by:
The Honourable Caroline Mulroney
President of the Treasury Board
Introduction
The Annual Report is a key element of the Public Accounts of the Province of Ontario and is central to demonstrating the Province’s transparency and accountability in reporting its financial activities and position. Ontario’s Consolidated Financial Statements present the financial results for the 2023–24 fiscal year against the 2023 Budget released on March 23, 2023, and the financial position of the government as of March 31, 2024. As in previous years, the Annual Report also compares the current year’s results to the prior year’s results and provides a five-year trend analysis for many key financial ratios.
Producing the Public Accounts of Ontario requires the teamwork and collaboration of many stakeholders across Ontario’s public sector. The Office of the Auditor General plays a critical role in auditing and reporting on the Province’s financial statements, and the Standing Committee on Public Accounts also plays an important role in providing legislative oversight and guidance. I would like to thank everyone for their contributions and collaboration.
We welcome your comments on the Public Accounts. Please share your thoughts by email to infoTBS@ontario.ca, or by writing to the Office of the Provincial Controller, Re: Annual Report, Treasury Board Secretariat, Second Floor, Frost Building South, 7 Queen’s Park Crescent, Toronto, Ontario M7A 1Y7.
Carlene Alexander, CPA, CGA, MBA
Deputy Minister and Secretary of the Treasury Board and Management Board of Cabinet
Treasury Board Secretariat
Statement of responsibility
The Consolidated Financial Statements are prepared by the Government of Ontario in accordance with the accounting principles for governments issued by the Public Sector Accounting Board (PSAB).
The Consolidated Financial Statements are audited by the Auditor General of Ontario in accordance with the Auditor General Act, and with Canadian generally accepted assurance standards. The Auditor General expresses an independent audit opinion on these Consolidated Financial Statements. Her report, which appears on pages 45-49, provides her audit opinion and the basis for this opinion.
Management prepares the Consolidated Financial Statements in accordance with generally accepted accounting principles for the public sector. Management is also responsible for maintaining systems of financial management and internal controls to provide reasonable assurance that transactions recorded in the Consolidated Financial Statements are within statutory authority, assets are properly safeguarded, and reliable financial information is available for preparation of these Consolidated Financial Statements.
Original signed by:
Carlene Alexander, CPA, CGA, MBA
Deputy Minister,
Treasury Board Secretariat
August 30, 2024
Original signed by:
Jason Fitzsimmons
Deputy Minister,
Ministry of Finance
August 30, 2024
Original signed by:
Beili Wong, FCPA, FCA
Comptroller General and Associate Deputy Minister,
Office of the Comptroller General
Treasury Board Secretariat
August 30, 2024
Original signed by:
Khalida Noor, CPA, CA
Assistant Deputy Minister and Provincial Controller,
Treasury Board Secretariat
August 30, 2024
The Government of Ontario is responsible for the Consolidated Financial Statements and accepts responsibility for the objectivity and integrity of these Consolidated Financial Statements and the Financial Statement Discussion and Analysis. Those charged with governance are responsible for overseeing the Government of Ontario’s financial reporting process.
Original signed by:
The Honourable Caroline Mulroney
President of the Treasury Board
August 30, 2024
Original signed by:
The Honourable Peter Bethlenfalvy
Minister of Finance
August 30, 2024
Financial statement discussion and analysis
Highlights
2023–24 Financial highlights (billion dollars) — Table 1
| Item | 2023 Budget $ | 2023–24 actual $ | 2022–23 restated actual $ | Change from 2023 Budget $ | Change from 2022–23 restated actual $ |
|---|---|---|---|---|---|
| Total revenue | 204.4 | 205.9 | 192.9 | 1.6 | 13.0 |
| Expense — Programs | 190.6 | 195.2 | 186.4 | 4.6 | 8.8 |
| Expense — Interest on debt | 14.1 | 11.4 | 12.4 | (2.7) | (1.0) |
| Total expense | 204.7 | 206.6 | 198.8 | 1.9 | 7.8 |
| Reserve | 1.0 | – | – | (1.0) | – |
| Annual deficit | (1.3) | (0.6) | (5.9) | 0.7 | 5.2 |
| Item | 2023–24 actual $ | 2022–23 restated actual $ | Change from 2022–23 restated actual $ |
|---|---|---|---|
| Financial assets | 144.1 | 133.9 | 10.3 |
| Liabilities | 552.1 | 533.7 | 18.4 |
| Net debt | (408.0) | (399.8) | (8.2) |
| Non-financial assets | 163.7 | 153.8 | 9.9 |
| Accumulated deficit | (244.3) | (246.0) | 1.7 |
| Item | 2023–24 actual $ | 2022–23 restated actual $ | Change from 2022–23 restated actual $ |
|---|---|---|---|
| Accumulated operating deficit | (246.7) | (246.3) | (0.4) |
| Accumulated remeasurement gains/(losses) | 2.4 | 0.3 | 2.1 |
Note: Numbers may not add due to rounding.
Financial highlights
Change from 2022–23 Actuals
- The Ontario government recorded a $0.6 billion deficit for the fiscal year ended March 31, 2024, compared to the previous year’s restated deficit of $5.9 billion. The $5.2 billion decrease in annual deficit is mainly due to higher revenues and lower interest on debt, partially offset by an increase in program expenses. (see Table 1 above).
- Total revenues were $205.9 billion, which are $13.0 billion or 6.8 per cent higher than the previous year, largely due to increases in taxation revenues, transfers from the Government of Canada, Income from Investment in Government Business Enterprises and revenues reported by ministries and the broader public sector. See details on pages 8-9.
- Total program expenses were $195.2 billion, which is $8.8 billion or 4.7 per cent higher than the previous year. Expenses are higher in the Health sector mainly due to increased compensation costs and investments in base programs to meet the growing demand of health care services; in the Education sector due to funding to support enrolment growth, commitments consistent with labour agreements reached and the continued implementation of the Canada-wide Early Learning and Child Care system; in the Postsecondary education sector mainly due to higher college spending; in the Children’s and social services sector mainly due to higher social assistance caseloads and increases to the monthly core allowances for the Ontario Disability Support Program; and in the Justice sector mainly due to investments in policing and public safety initiatives. These increases are partially offset by lower spending in the Other sector mainly due to higher expenses in 2022–23 related to the recognition of contingent liabilities for Treaty rights and Aboriginal rights and other claims against the Crown. See details on pages 13-15.
- Interest on debt was lower than the previous year by $1.0 billion, or 8.2 per cent, as a result of higher interest and investment income and higher interest capitalization from consolidated entities. See details on page 21.
- Non-financial assets increased by $9.9 billion from the previous year, mainly due to an increase of $11.1 billion in the net book value of Ontario’s capital assets, such as buildings and transportation infrastructure, offset by a decrease of $1.3 billion in inventory assets in personal protective equipment. Total infrastructure expenditure increased by $4.4 billion from the previous year. Ontario invested $19.1 billion in assets owned by the government and its consolidated entities, which reflect new capital investments and repairs to existing assets. The government also made $4.5 billion in additional capital investments in transfers to non-consolidated partners and other infrastructure expenditures. See details on page 24-26.
- Total liabilities increased by $18.4 billion and total financial assets increased by $10.3 billion, resulting in an increase of $8.2 billion or 2.0 per cent in net debt from the previous year (see details on pages 27-28). The increase of liabilities is mainly due to an increase in debt. The increase of financial assets is mainly due to higher accounts receivable from taxation revenue and higher investment in Government Business Enterprises. The accumulated deficit decreased by $1.7 billion, or 0.7 per cent, from the previous year mainly as a result of the reported deficit of $0.6 billion and accumulated remeasurement gains of $2.4 billion.
Change from the 2023 Budget
- The Ontario government recorded a $0.6 billion deficit for the fiscal year ended March 31, 2024, compared to a forecasted deficit of $1.3 billion in the 2023 Budget, resulting from a combination of higher revenues and lower-than-planned interest on debt, offset by increased program spending. (See Table 1 above).
- Total revenues of $205.9 billion, were $1.6 billion or 0.8 per cent higher than planned in the 2023 Budget, mainly due to higher-than-expected income from Investment in Government Business Enterprises (GBEs) and revenues reported by ministries, consolidated government organizations including the broader public sector. This was partially offset by weaker-than-expected taxation revenues reflecting the latest actual tax assessment information for 2023 and prior years received from the Canada Revenue Agency (CRA) and lower-than-expected transfers from the Government of Canada. See details on page 10.
- Total program expenses of $195.2 billion, were $4.6 billion or 2.4 per cent higher than the 2023 Budget. Program expenses are higher in the Education, Health and Justice sectors, mainly due to Protecting a Sustainable Public Sector for Future Generations Act, 2019 (Bill 124) funding not being built into the 2023 Budget (as remedy negotiations had not yet begun), as well as funding to support commitments consistent with labour agreements reached. Higher program expense in the Health sector is also due to higher-than-forecasted hospital spending and write-off of personal protective equipment; in the Justice sector due to investments in policing and public safety initiatives; and in the Postsecondary Education sector due to higher-than-forecasted college spending. See details on pages 17-18.
- Interest on debt was lower than the 2023 Budget by $2.7 billion, or 19.1 per cent, due to lower- than-forecasted interest rates, higher interest capitalization from consolidated entities and an increase in interest and investment income from the broader public sector. See details on page 21.
Analysis of 2023–24 results
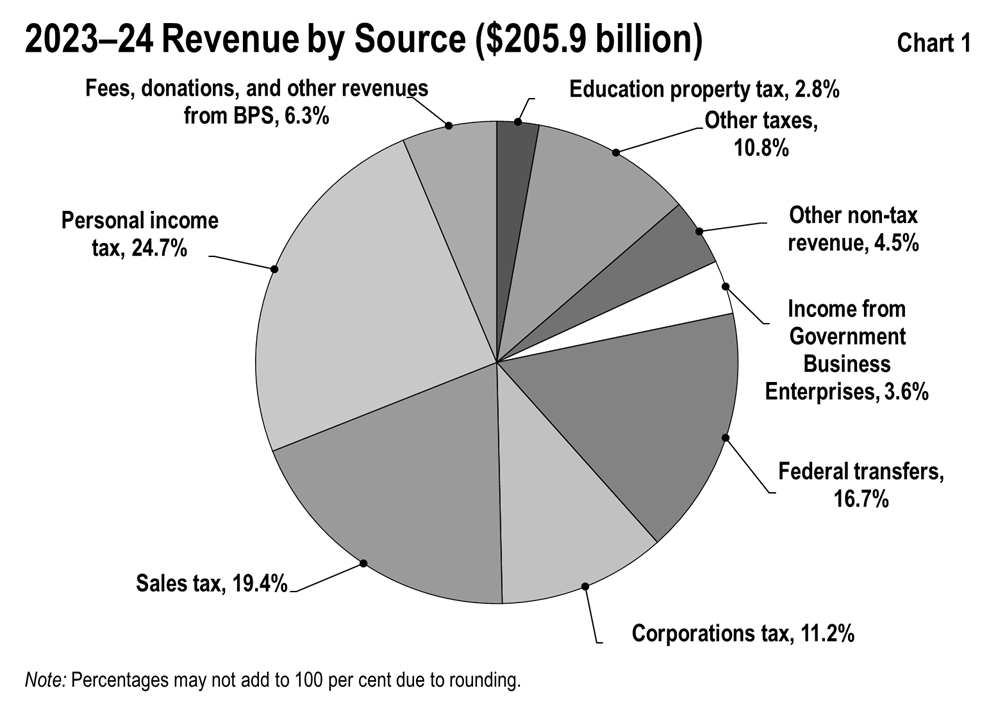
Revenue
| Revenue | 2023 Budget $ | 2023–24 actual $ | 2022–23 restated actual $ | Change from 2023 Budget $ | Change from 2022–23 restated actual $ |
|---|---|---|---|---|---|
| Personal income tax | 56.0 | 50.8 | 44.2 | (5.2) | 6.6 |
| Sales tax | 35.4 | 39.9 | 36.1 | 4.5 | 3.8 |
| Corporations tax | 24.7 | 23.1 | 27.8 | (1.5) | (4.7) |
| Employer health tax | 8.2 | 8.6 | 7.8 | 0.4 | 0.8 |
| Education property tax | 5.7 | 5.8 | 6.0 | 0.1 | (0.2) |
| Ontario health premium | 4.9 | 5.0 | 4.4 | 0.1 | 0.6 |
| Gasoline and fuel tax | 2.9 | 2.1 | 2.7 | (0.7) | (0.5) |
| Other taxes | 6.5 | 6.5 | 7.5 | - | (1.0) |
| Total taxation revenue | 144.2 | 141.9 | 136.5 | (2.4) | 5.3 |
| Transfers from Government of Canada | 34.8 | 34.3 | 31.3 | (0.5) | 3.1 |
| Income from Investment in Government Business Enterprises | 6.3 | 7.4 | 6.1 | 1.1 | 1.3 |
| Fees, donations and other revenues from Broader Public Sector Organizations | 11.1 | 13.1 | 11.5 | 2.0 | 1.6 |
| Other non-tax revenue | 7.9 | 9.2 | 7.5 | 1.4 | 1.8 |
| Total revenue | 204.4 | 205.9 | 192.9 | 1.6 | 13.0 |
Note: Numbers may not add due to rounding.
Change from 2022–23 actuals
Total revenues for 2023–24 increased by $13.0 billion or 6.8 per cent from the previous year.
- Taxation revenue increased by $5.3 billion or 3.9 per cent in 2023–24, in line with 2023 Nominal Gross Domestic product growth of 4.3 per cent. Higher revenues reported for Personal Income Tax (PIT) and Sales Tax and Ontario Health Premium (OHP) were partially offset by lower Corporations Tax (CT).
- Transfers from Government of Canada increased by $3.1 billion or 9.8 per cent in 2023–24, mostly reflecting higher transfers from major federal funding programs including Canada Health Transfer, Canada Social Transfer, Equalization, and support for Canada-wide Early Learning and Child Care and Shared Health Priorities. This increase was partially offset by reprofiling of the National Housing Strategy funding and the expiry of COVID-19 time-limited funding.
- Income from Investment in Government Business Enterprises increased by $1.3 billion or 21.1 per cent in 2023–24, mainly due to higher net income from Ontario Power Generation (OPG), largely reflecting the change in the asset retirement obligations adjustment resulting from the conversion of OPG’s reporting basis from US GAAP to International Financial Reporting Standards (IFRS), and the Ontario Nuclear Funds realized gains. Revenue from the Liquor Control Board of Ontario (LCBO), Hydro One Ltd. (HOL), the Ontario Cannabis Retail Corporation (OCRC), also known as the Ontario Cannabis Store (OCS), and iGaming Ontario (iGO) are also higher compared to 2022–23. This was partially offset by lower net income from the Ontario Lottery and Gaming Corporation (OLG).
- Fees, donations and other revenues from broader public sector organizations (BPS) increased by $1.6 billion or 13.7 per cent in 2023–24, mainly due to higher third-party revenue from colleges driven by higher revenue from international student tuition and private partnerships.
- Other non-tax revenue increased by $1.8 billion or 23.6 per cent in 2023–24, mainly due to higher recoveries of prior-year expenditures, higher revenues from sales and rentals, fees, licences, permits, and other miscellaneous revenues reported by ministries and consolidated government organizations.
Change from the 2023 Budget
Revenues for 2023–24 were $1.6 billion or 0.8 per cent higher than expected in the 2023 Budget.
- Taxation revenues were $2.4 billion or 1.6 per cent lower than forecasted in the 2023 Budget, mainly due to lower-than-expected CT and PIT reflecting the latest 2023 and prior year tax assessments information available from the CRA. This was partially offset by higher-than-expected Sales Tax reflecting upward revisions to Ontario’s official 2022 and 2023 Harmonized Sales Tax (HST) entitlements by the CRA.
- Transfers from the Government of Canada were $0.5 billion or 1.5 per cent lower, mainly due to reprofiling of funding under the Investing in Canada Infrastructure Program, the National Housing Strategy and the Canada-wide Early Learning and Child Care Agreement. This was partially offset by higher funding for the Labour Market Transfer Agreements and higher transfers to broader public sector organizations.
- Income from GBEs was $1.1 billion or 17.1 per cent higher, mainly reflecting higher revenues from OPG, LCBO, and iGO. Higher net income from OPG was primarily due to the change in the asset retirement obligations adjustment resulting from the conversion of OPG’s reporting basis from US GAAP to International Financial Reporting Standards (IFRS), and the Ontario Nuclear Funds realized gains. LCBO’s higher net income mainly reflects lower cost of sales and other expenses. The net income from iGO represents a new revenue stream to the Province that was consolidated into the provincial financial statements after Budget 2023. This was partially offset by lower net income from the OLG.
- Fees, donations, and other revenues from BPS were $2.0 billion or 17.7 per cent higher, mainly due to growth in third-party revenues from colleges and hospitals. Higher college sector revenues were primarily due to higher tuition from international students and private partnerships. Higher hospital sector revenues were due to higher research grants and third-party revenues from ancillary services.
- Other non-tax revenues increased by $1.4 billion or 17.7 per cent mainly reflecting higher-than-expected recoveries of prior-year expenditures, higher revenues from fees, licences, permits, and other miscellaneous revenues reported by ministries and consolidated government organizations.
Revenue trend
Chart 2 shows the recent trends in revenue for Ontario’s major revenue sources.
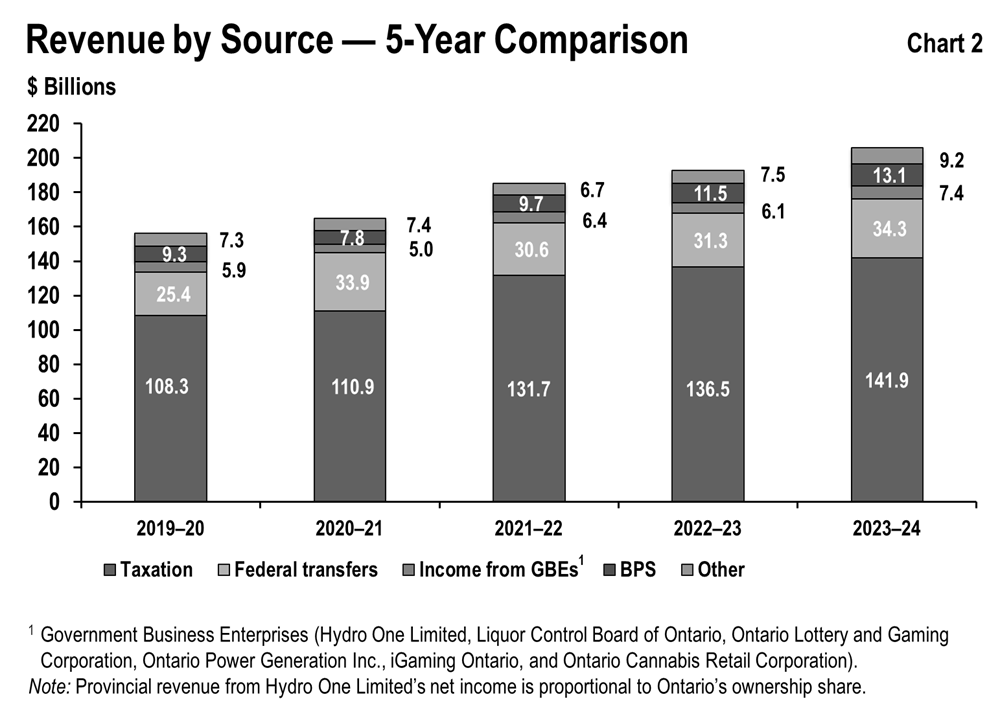
Taxation revenue
Between 2019–20 and 2023–24 taxation revenue grew at an average annual rate of 7.0 per cent, higher than the average annual rate of nominal GDP growth of 5.2 per cent.
Although economic growth and taxation revenue growth are closely linked, the relationship is affected by several factors, including but not limited to:
- Growth in some revenue sources, such as Corporations Tax and Mining Tax, which can diverge significantly from economic growth in any given year due to the inherent volatility of business profits as well as the use of tax provisions, such as the option to carry losses forward or backward;
- The impact of housing completions and resales on HST and Land Transfer Tax revenue, which is proportionately greater than their contribution to GDP; and
- Changes in volume-based gasoline and fuel taxes which are more closely aligned to growth in real GDP as opposed to nominal GDP since these revenue sources are not directly influenced by price changes.
Federal government transfers
Government of Canada transfers are based on existing federal-provincial funding arrangements and formulas. These include major federal transfers such as Canada Health Transfer, Canada Social Transfer and Equalization. There are also a number of federal transfers to the Province which are largely program-specific, such as Early Learning and Child Care, Shared Health Priorities, Labour Market Development and Infrastructure. Some transfers are ongoing while others are time-limited.
Between 2019–20 and 2023–24, Government of Canada transfers grew at an annual average rate of 7.8 per cent.
Income from investment in Government Business Enterprises
Income from GBEs includes OPG, HOL, LCBO, OLG, OCS and iGO.
Between 2019–20 and 2023–24, income from GBEs increased at an annual average rate of 5.9 per cent reflecting revenue growth from all existing GBEs including iGO, which was consolidated into the provincial financial statements as a GBE in 2022–23 Public Accounts.
Fees, donations and other revenues from Broader Public Sector Organizations
Between 2019–20 and 2023–24, revenue from BPS increased at an average annual rate of 8.9 per cent. This increase mainly reflects third-party revenue growth from existing BPS sectors (colleges, hospitals, and school boards). It also includes a new revenue stream to the Province from the children’s aid societies (CAS), which was consolidated into the provincial financial statements for the first time in the 2022-23 Public Accounts.
Other non-tax revenues
Other non-tax revenues arise from a number of sources, including sales and rentals of goods and services, fees, licences, permits, reimbursements of provincial expenditures in delivering specific services, royalties for using crown resources, and power supply contract recoveries.
Other non-tax revenues increased at an annual average rate of 6.0 per cent between 2019–20 and 2023–24.
Expense
| Expense | 2023 Budget $ | 2023–24 actual $ | 2022–23 restated actual $ | Change from 2023 Budget $ | Change from 2022–23 restated actual $ |
|---|---|---|---|---|---|
| Health sector | 81.0 | 85.5 | 78.5 | 4.4 | 7.0 |
| Education sector | 34.7 | 37.2 | 34.5 | 2.4 | 2.6 |
| Postsecondary education sector | 12.1 | 13.2 | 11.8 | 1.1 | 1.5 |
| Children’s and social services sector | 19.4 | 19.5 | 18.1 | 0.1 | 1.4 |
| Justice sector | 5.4 | 6.0 | 5.4 | 0.7 | 0.6 |
| Other programs | 38.1 | 33.8 | 38.0 | (4.2) | (4.2) |
| Total program expense | 190.6 | 195.2 | 186.4 | 4.6 | 8.8 |
| Interest on debt | 14.1 | 11.4 | 12.4 | (2.7) | (1.0) |
| Total expense | 204.7 | 206.6 | 198.8 | 1.9 | 7.8 |
| Reserve | 1.0 | – | – | (1.0) | – |
Note: Numbers may not add due to rounding.
Change from 2022–23 actuals
Total program expenses for 2023–24 increased by $8.8 billion or 4.7 per cent, from $186.4 billion in the previous fiscal year to $195.2 billion.
- Health sector expense increased by $7.0 billion or 8.9 per cent over the previous fiscal year, mainly due to increased spending in base health sector programs to meet growing demand. Key Health sector investments included:
- $1.8 billion in additional funding to address increased compensation costs, including Bill 124 remedy settlements and agreements for physicians and nurses;
- $1.6 billion in higher spending mainly for operating expenses in hospitals including services, supplies and equipment;
- $1.3 billion in additional funding primarily to support increased utilization of health care services to meet Ontario’s growing population, including more visits to physicians and the introduction of new drugs onto the drug formularies;
- $1.1 billion increase in health sector program investments including Ontario Health Teams, emergency health services, digital health and supports to health human resources;
- $0.7 billion in additional investments to support increased long-term care staffing and improve average direct hours of care for long-term care residents;
- $0.5 billion in additional investments to expand and improve access to home and community care, including contract rate increases to support the workforce;
- $0.3 billion in additional funding for the Construction Funding Subsidy to help fast-track the construction of new or redeveloped long-term care homes; and
- The variance also reflects a $0.6 billion decrease in pandemic-related spending for long-term care homes.
- Education sector expenses increased by $2.6 billion or 7.6 per cent over the previous fiscal year. This is mainly due to funding to support enrolment growth, commitments consistent with labour agreements reached and the continued implementation of the Canada-wide Early Learning and Child Care system to reduce average out-of-pocket child care fees.
- Postsecondary education sector expenses increased by $1.5 billion or 12.5 per cent over the previous fiscal year. This is mainly due to higher college spending related to increased enrolment levels and operating costs, as well as higher spending on student financial assistance.
- Children’s and social services sector expenses increased by $1.4 billion or 7.5 per cent over the previous fiscal year, primarily due to increases to the monthly core allowances for the Ontario Disability Support Program and the maximum monthly amount for the Assistance for Children with Severe Disabilities program, increases in demand-driven programs such as Social Assistance and Developmental Services, and investments to support the Ontario Autism Program and youth leaving the child welfare system.
- Justice sector expenses increased by $0.6 billion or 10.9 per cent over the previous fiscal year, mainly due to compensation costs, including Bill 124 remedy settlements, providing support for the Ontario Provincial Police, basic constable training and First Nations policing and investments in public safety initiatives, such as improving the province’s bail system and addressing auto theft.
- Other programs expenses decreased by $4.2 billion or 11.0 per cent over the previous fiscal year, mostly reflecting:
- A $6.3 billion decrease due to higher expenses in 2022–23 related to the recognition of contingent liabilities for Treaty rights and Aboriginal rights and other claims against the Crown; and
- $209 million decrease due to winding down of the time-limited Ontario COVID-19 Worker Income Protection Benefit program that reimbursed employers for COVID-19 paid leave days and the Ontario Jobs Training Tax Credit at the end of 2022 which supported hiring, training, retraining and upskilling workers.
The decrease in 2023–24 is partially offset by:
- $769 million increase primarily due to increased funding to support Metrolinx operations, higher amortization expense associated with more transportation assets entering in service, higher transfer payments for municipal transit capital projects due to project milestones achieved, and financial supports provided to the City of Toronto under the New Deal;
- $632 million increase in contaminated sites liability adjustments;
- $443 million increase for Homelessness Prevention Programs including funding for shelters and homelessness programs in the cities of Toronto and Ottawa;
- $235 million increase due to higher cost in business investment tax credits, primarily from the implementation of the new Ontario Made Manufacturing Investment Tax Credit; and
- $207 million increase in energy-related expenses, primarily due to higher costs to deliver the suite of electricity price mitigation programs.
See Chart 3 for details of program expenses by sector.
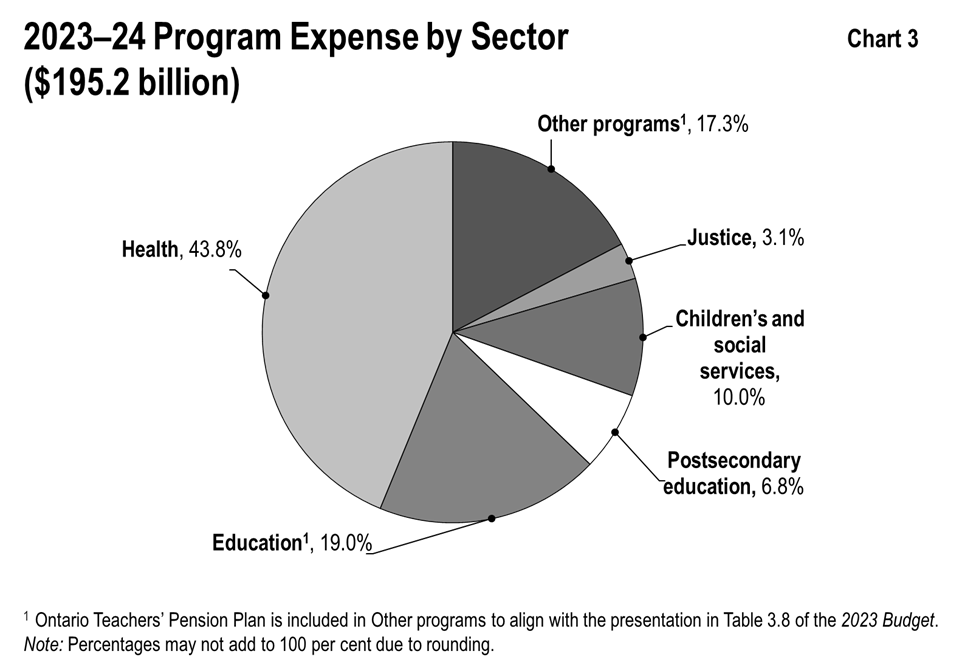
Chart 4 shows spending by type of expense. Government spending related to salaries and benefits includes those expenses for organizations consolidated as part of the government reporting entity, including hospitals, school boards, colleges and children’s aid societies, as well as the Ontario Public Service.
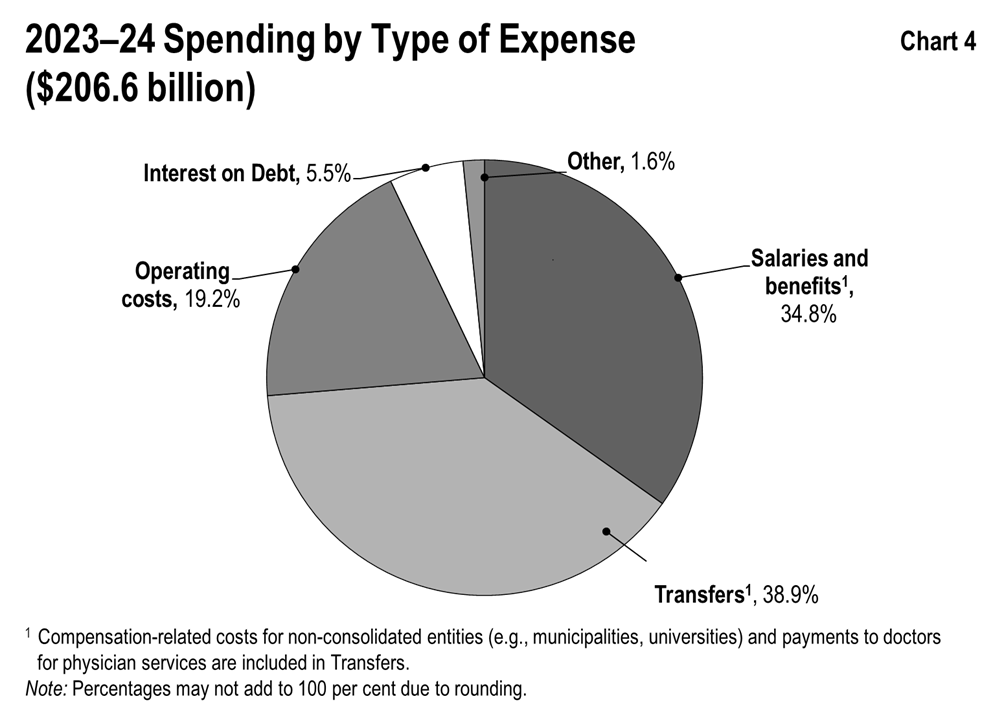
The expense labelled “Transfers” in Chart 4 reflects payments to a variety of service providers that support the delivery of public services. These third-party funding recipients consist of health care professionals including physicians, social service agencies, universities, child care providers and municipalities. As service providers, a large share of the spending of these third parties typically goes to salaries and benefits, i.e., compensation-related costs. Transfers do not include transfers to hospitals, school boards, colleges, and children’s aid societies — these are reflected in expense types such as operating costs and salaries and benefits, as reported by the organizations.
Change from the 2023 Budget
Total program spending for 2023–24 was $195.2 billion, which is $4.6 billion or 2.4 per cent higher than the 2023 Budget. Changes in program spending were primarily attributed to the following factors:
- Health sector expense was $4.4 billion or 5.5 per cent above plan, including Bill 124 funding not being built into the 2023 Budget (as remedy negotiations had not yet begun), increased utilization of Ontario Drug Benefit programs including introduction of new drugs on the provincial formularies, additional funding to support and expand home and community care, and other health sector program investments. The variance also reflects the write-off of expired and obsolete personal protective equipment and critical supplies and equipment inventory.
- Education sector expense was $2.4 billion or 7.0 per cent above plan, primarily due to Bill 124 funding not being built into the 2023 Budget (as remedy negotiations had not yet begun), as well as funding to support commitments consistent with labour agreements reached and additional capital investments.
- Postsecondary education sector expense was $1.1 billion or 9.2 per cent above plan, mainly due to higher-than-forecasted college spending to support increased enrolment levels and operating costs. This also reflects lower-than-expected spending for student financial assistance.
- Children’s and social services sector expense was $0.1 billion or 0.6 per cent above plan, primarily due to increased demand for social assistance programs such as Ontario Works, driven by an increased number of asylum seekers, and new investments in children’s rehabilitation services.
- Justice sector expense was $0.7 billion or 12.8 per cent above plan, primarily due to compensation costs, including Bill 124 remedy settlements, providing support for the Ontario Provincial Police, basic constable training and First Nations policing and investments in public safety initiatives, such as improving the province’s bail system and addressing auto theft.
- Other programs expense was $4.2 billion or 11.1 per cent below plan, mainly due to the following factors:
- $4.0 billion decrease in contingency funds that were used during the fiscal year to fund program expenses in the various sectors for emerging needs and unforeseen events. This is a decrease from the $4.6 billion in contingency funds in 2022-23;
- $837 million decrease primarily due to updated construction schedules for programs such as the Broadband and Cellular Infrastructure Program and Transit-Oriented Communities;
- $491 million decrease in energy-related expenses, primarily due to lower-than-forecasted costs to sustain the suite of electricity price mitigation programs; and
- $185 million decrease primarily due to revised implementation timelines for the Skills Development Fund Capital Stream.
The decrease was partially offset by:
- $718 million increase in contaminated sites liability adjustments; and
- $495 million increase primarily due to financial support provided to the City of Toronto under the New Deal, and increased costs of transit and highway operations.
Expense trend
Chart 5 shows the recent trends in spending for major program areas.
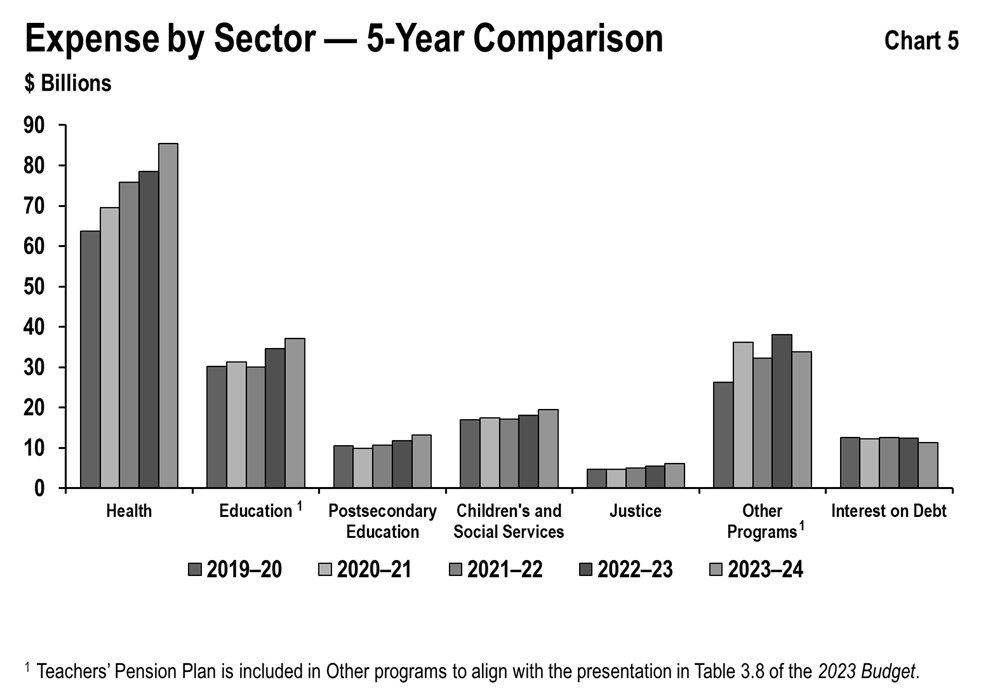
- Health sector expense increased from $63.7 billion in 2019–20 to $85.5 billion in 2023–24, or on average by 7.6 per cent per year. The increase includes:
- Support for Ontario hospitals to expand capacity, meet patients’ needs and increase access to high-quality care, closer to home;
- Additional funding to improve and transform home and community care services;
- Investments to meet demand for health care services, including increased utilization of drug programs and cancer treatment services, as well as more visits to physicians;
- Funding for health human resources initiatives to support the existing workforce and recruit and retain health care providers;
- Additional funding to improve access to mental health and addictions services through the Roadmap to Wellness: A Plan to Build Ontario’s Mental Health and Addictions System; and
- Support for long-term care homes through increased investments in the Long-Term Care Staffing Plan, operating funding to help with financial stability and the Construction Funding Subsidy to advance construction of new and redeveloped beds.
- Education sector expense increased from $30.2 billion in 2019–20 to $37.2 billion in 2023–24, or on average by 5.3 per cent per year. The increase is mainly due to:
- Implementing the Canada-wide Early Learning and Child Care system;
- Modernizing the school curriculum and additional funding for reading and math programs; and
- Providing funding to support enrolment growth and commitments consistent with labour agreements reached.
- Postsecondary education sector expense increased from $10.5 billion in 2019–20 to $13.2 billion in 2023–24, or on average by 5.9 per cent per year. This increase is mainly due to higher college spending as a result of increased enrolment levels and operating costs. This also reflects increased spending on capital grants to help colleges and universities modernize facilities by upgrading technology, supporting critical repairs and improving energy efficiency.
- Children’s and social services sector expenses increased from $17.0 billion in 2019–20 to $19.5 billion in 2023–24, or on average by 3.4 per cent per year. This increase primarily reflects:
- Higher social assistance funding to address demand;
- Increases to the monthly core allowances for the Ontario Disability Support Program and the maximum monthly amount for the Assistance for Children with Severe Disabilities program; and
- Investments to support client needs in the Ontario Autism Program and Developmental Services program.
- Justice sector expense increased from $4.6 billion in 2019–20 to $6.0 billion in 2023–24, or on average by 6.9 per cent per year. The increase is primarily due to the following investments:
- Initiatives to address auto theft, strengthen the Province’s bail system and combat gun and gang-related violence;
- Support for essential services in courts, corrections, policing, and coroner and forensic pathology services; and
- Implementation of the Justice Accelerated Strategy and the Criminal Justice Digital Design initiative to establish new and innovative ways of delivering justice services remotely, in-person and online.
- Other programs expenses increased from $26.2 billion in 2019–20 to $33.8 billion in 2023–24, or on average by 6.6 per cent per year. The increase is primarily due to:
- Growth in amortization expense related to new transportation assets entering into service and increased investments in transit services and highway operations;
- Infrastructure program investments such as the Ontario Community Infrastructure Fund, Broadband and Cellular Infrastructure Program and Investing in Canada Infrastructure Program;
- Strategic investments and industrial land development, including Ontario’s auto manufacturing sector, and increases for investment tax credits;
- Increased investments in the hiring, training, retraining and upskilling of workers through the Skills Development Fund Training Stream; and
- Additional investments to support Francophone communities and businesses through initiatives such as the Francophone Community Grants Program and the Francophone Economic Development Strategy.
Interest on debt
Interest on debt expense decreased from $12.4 billion in 2022–23 to $11.4 billion in 2023–24 as a result of higher interest and investment income and higher interest capitalization from consolidated entities.
Interest on debt expense was $2.7 billion below plan from the 2023 Budget in 2023–24, due to lower-than-forecasted interest rates, higher interest capitalization from consolidated entities and an increase in interest and investment income from the broader public sector.
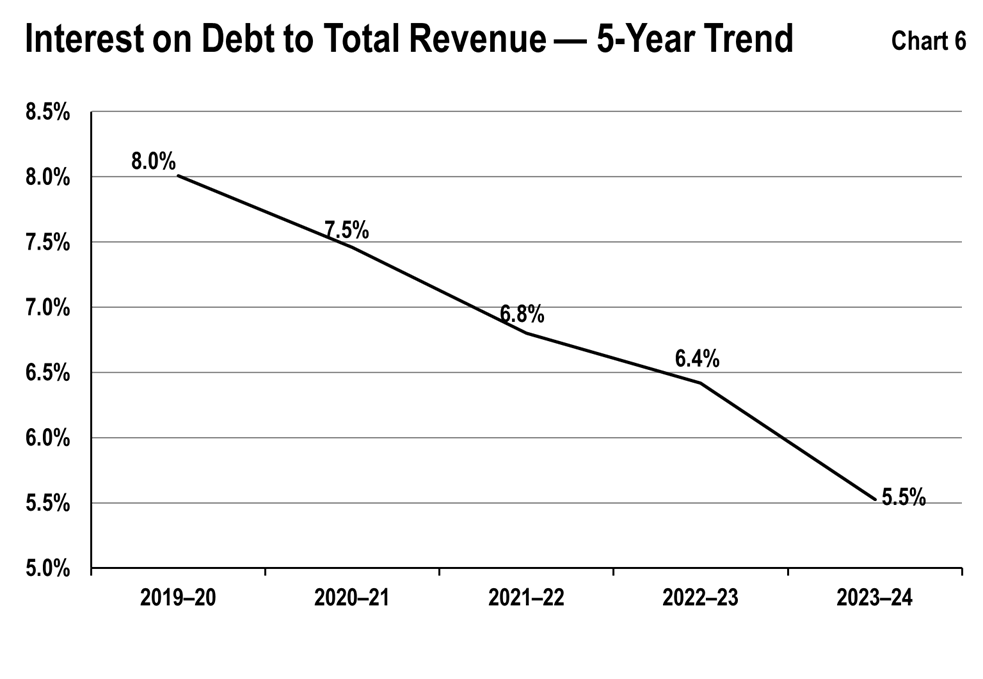
Chart 6 shows that the ratio of interest on debt to total revenue has fallen for Ontario over the period between 2019–20 to 2023–24, from a high of 8.0 per cent in 2019–20 to the current level of 5.5 per cent. The decrease from 6.4 per cent in 2022–23 to 5.5 per cent in 2023–24 is due to the rate of increase in Ontario’s total revenues which is greater when compared to the rate of change in Ontario’s interest on debt expenses.
Statement of financial position analysis
| Item | 2023–24 actual $ | % of total | 2022–23 restated actual $ | % of total | Variance increase (decrease) $ |
|---|---|---|---|---|---|
| Cash and cash equivalents | 41.5 | 28.8 | 39.9 | 29.8 | 1.6 |
| Portfolio investments | 25.9 | 18.0 | 34.0 | 25.4 | (8.1) |
| Accounts receivable | 26.1 | 18.1 | 12.3 | 9.2 | 13.8 |
| Loans receivable | 11.9 | 8.3 | 11.9 | 8.9 | - |
| Derivative assets | 4.5 | 3.1 | 4.6 | 3.4 | (0.1) |
| Other assets | 1.1 | 0.8 | 1.3 | 1.0 | (0.2) |
| Investment in Government Business Enterprises | 33.2 | 23.0 | 30.0 | 22.4 | 3.2 |
| Total Financial Assets | 144.1 | 100.0 | 133.9 | 100.0 | 10.2 |
Note: Numbers may not add due to rounding.
Financial assets consist of items that include cash and cash equivalents and portfolio investments that are available to the government to meet its expenditure needs; accounts and loans receivable, which are amounts it expects to receive from third parties; and other items including derivative assets and investment in GBEs.
Total financial assets increased by $10.2 billion in 2023–24 over the prior fiscal year. The increase was attributable to a (see Table 4):
- $13.8 billion increase in accounts receivable, mainly due to increases in receivables from Corporations Tax, PIT, other taxes, transfers from Government of Canada, debt issuance and bond sales; and
- $3.2 billion higher investment in GBEs, mainly due to higher net assets from OPG, HOL, LCBO and OLG.
These increases in 2023–24 are partially offset by:
- $8.1 billion lower in portfolio investments primarily due to no debt pre-borrowing activities in 2023–24.
Chart 7 shows the recent trends in financial assets for the government.
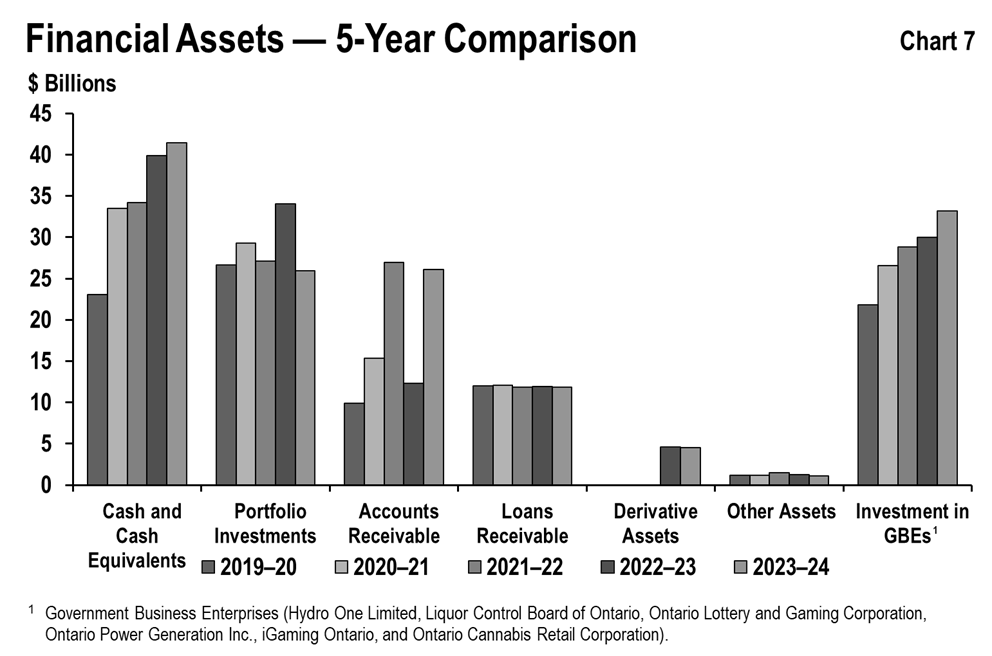
The level of financial assets, including cash, accounts receivable and portfolio investments tends to be more variable, since these assets year-over-year often reflect specific circumstances at the fiscal year-end such as pre-borrowing for the following period’s needs.
After a large increase in total net investments in GBEs in 2020–21, total investment in GBEs showed smaller increases in 2021–22 and 2022–23, and again a larger increase in 2023–24. The net increases were mainly due to the increases in net assets in GBEs, including investment earnings from the Ontario Nuclear Funds for nuclear waste management and decommissioning, and in 2023–24 net income from OPG.
Tangible capital assets
The government is responsible for a large portfolio of non-financial assets, which is almost entirely made up of tangible capital assets.
Tangible capital assets owned by the government and its consolidated entities represent the largest component of Ontario’s infrastructure investments. These assets include those it owns directly, such as provincial highways, as well as the assets of hospitals, school boards, colleges, children’s aid societies, and agencies that are consolidated in its financial statements. The assets of GBEs are reflected in Ontario’s statement of financial position as an investment in GBEs under financial assets.
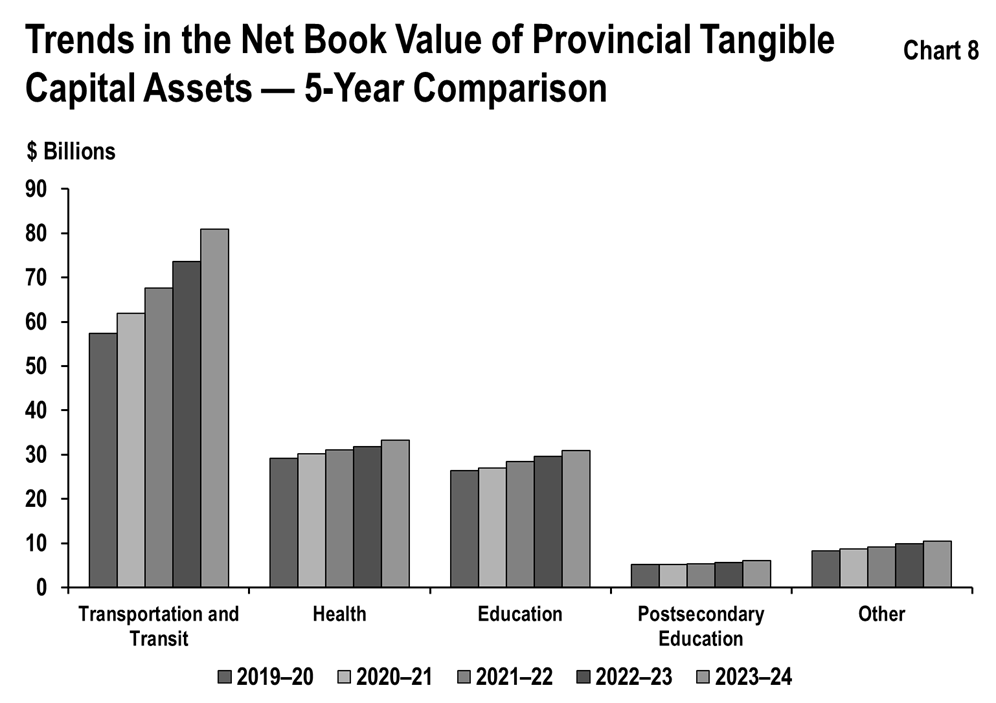
The reported net book value of Ontario’s tangible capital assets was $161.6 billion in 2023–24, increasing by $11.1 billion, or 7.4 per cent over the prior fiscal year. Buildings, including hospitals, schools and college facilities, make up the single largest share at $73.3 billion in aggregate. The total on the balance sheet also includes assets under construction, some of which are being built using the public private partnership (P3) model, in which the private sector finances the assets during construction. The impacts of P3s on balance sheet liabilities are discussed in the Other Long-Term Financing section.
Growth in the net book value of capital assets has averaged 6.3 per cent annually over the period between 2019–20 and 2023–24. Most of the growth has been in new and rehabilitated buildings and transportation infrastructure including provincial highways and bridges, and the transit network owned by Metrolinx, an agency of the government.
See Chart 8 for the recent trends in the net book value of provincial tangible capital assets by sector.
Infrastructure expenditures
Ontario’s infrastructure spending in 2023–24 was $23.6 billion (see Table 5). This includes $19.1 billion invested in assets owned by the government and its consolidated entities as discussed in the Tangible Capital Assets section, and $4.5 billion provided for capital investment to non-consolidated partners such as universities and municipalities as well as other infrastructure expenditures.
Total infrastructure spending in 2023–24 was $4.4 billion higher than the previous year, with increased expenditures across all sectors. Increased investments include highways, public transit, hospitals, schools, and repairs on existing provincial assets. The increase also includes a $0.6 billion one-time accounting adjustment for contaminated sites.
The total was higher than the $23.5 billion set out in the 2023 Budget, primarily driven by increases in the Education, Health, Postsecondary Education and Transportation sectors. These increases are partially offset by deferred capital spending in the other sectors due to changes in project construction timelines.
| Sector | Investment in capital assets $ | Transfers and other infrastructure expenditures $ | Total infrastructure expenditures $ | 2023 Budget total infrastructure expenditures $ |
|---|---|---|---|---|
| Transportation and transit | 10.2 | 1.3 | 11.5 | 10.9 |
| Health | 3.6 | 0.5 | 4.1 | 3.9 |
| Education | 3.2 | 0.1 | 3.3 | 3.0 |
| Postsecondary education | 0.8 | 0.2 | 1.0 | 0.8 |
| Other sectors | 1.2 | 2.4 | 3.6 | 4.8 |
| Totals | 19.1 | 4.5 | 23.6 | 23.5 |
Note: Numbers may not add due to rounding.
Liabilities
Ontario’s liabilities consist of debt and other financial obligations, including accounts payable and the estimated cost of future payments, including pensions and other employee future benefits liability. See Table 6.
| Item | 2023–24 actual $ | % of total | 2022–23 restated actual $ | % of total | Variance increase (decrease) $ |
|---|---|---|---|---|---|
| Accounts payable and accrued liabilities | 48.9 | 8.9 | 46.1 | 8.6 | 2.8 |
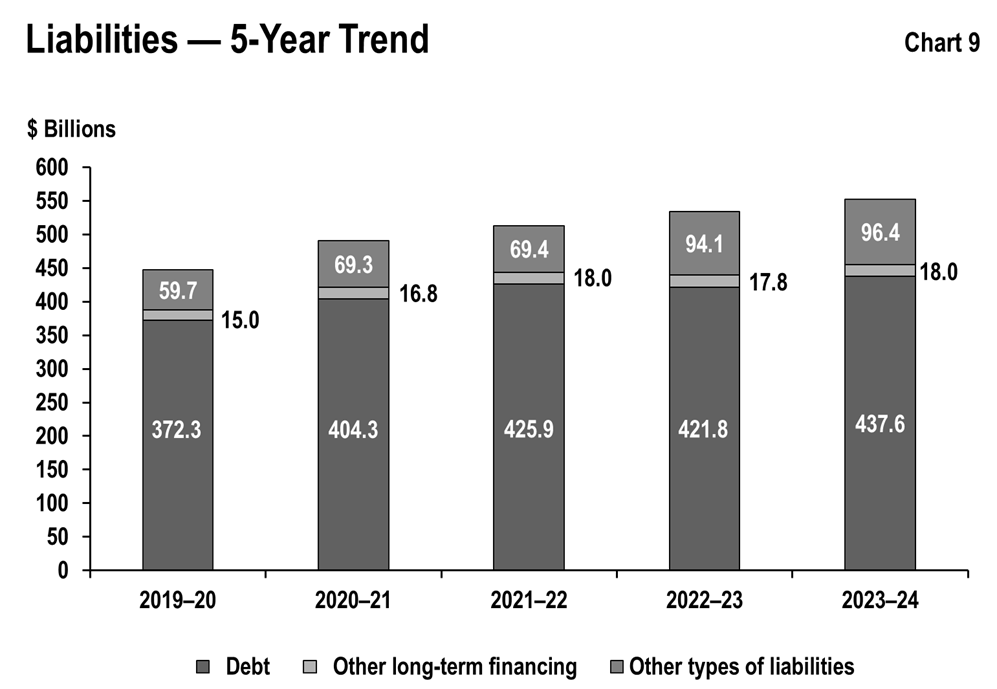
| Debt | 437.6 | 79.3 | 421.8 | 79.0 | 15.8 |
| Other long-term financing | 18.0 | 3.3 | 17.8 | 3.3 | 0.2 |
| Deferred revenue and capital contributions | 17.4 | 3.2 | 17.2 | 3.2 | 0.2 |
| Pensions and other employee future benefits liability | 13.8 | 2.5 | 14.1 | 2.6 | (0.3) |
| Derivative liabilities | 6.9 | 1.3 | 7.7 | 1.4 | (0.8) |
| Other liabilities | 9.4 | 1.7 | 8.9 | 1.7 | 0.5 |
| Total liabilities | 552.0 | 100 | 533.6 | 100 | 18.4 |
Note: Numbers may not add due to rounding.
Debt
Debt makes up the largest share of liabilities. From 2022–23 to 2023–24, debt increased by $15.8 billion to $437.6 billion at fiscal year-end, primarily to finance the operating deficit, changes in the Province’s holdings of its own bonds and treasury bills, investments in infrastructure as well as operating cash requirements.
Table 7 summarizes the government’s financing in 2023–24.
| Item | Amount $ |
|---|---|
| Operating deficit and other transactions | 4.2 |
| Investment in capital assets owned by the government and its consolidated organizations, including hospitals, school boards, colleges and children’s aid societies | 17.5 |
| Decrease in the government’s cash and investments funded by cash holdings | (6.5) |
| Subtotal | 15.2 |
| Decrease in other long-term financing, Tangible Capital Assets financed by Public Private Partnership (P3) | 0.7 |
| Net new financing | 15.8 |
Note: Numbers may not add due to rounding.
The government completed an annual borrowing program of $42.6 billion in 2023–24, compared to the $32.2 billion borrowed in 2022–23.
Other long-term financing
This category includes obligations to finance construction of public assets including those procured through the P3 model and total debt of BPS. All assets that are owned by the Ontario government and its consolidated entities, and the associated financing liabilities, are reflected on Ontario’s balance sheet during construction and as the liabilities are incurred. For information on asset investments, see the Tangible Capital Assets section.
Other types of liabilities
Other types of liabilities include accounts payable, pensions and other employee future benefits, unspent transfers received from the federal government representing deferred revenues, derivative liabilities, and other liabilities.
Chart 9 shows the recent trends in liabilities for Ontario. This trend over the period between 2019–20 and 2023–24 shows public debt rising, mainly to fund capital investments and the annual deficits. Other types of liabilities, including accounts payable and deferred revenue, tend to be more variable since they often reflect specific circumstances at the fiscal year-end, such as accrued liabilities for goods and services.
Risks and risk management
Ontario’s financial results and financial reporting are subject to various risks and uncertainties over which the Provincial government may have limited or no control.
A majority of Ontario’s taxation revenue is administered and collected by the federal government through various tax collection agreements. Actual tax assessments from the Canada Revenue Agency for the current tax year and prior years are provided to the Ontario Ministry of Finance well after the tax year has ended. In the absence of actual tax data from the federal government, the Ministry of Finance uses economic driven models to produce the forecasts for federally administered taxes. Ontario manages risks to the revenue forecast by consulting with private-sector economists to inform the government’s planning assumptions. For prudent fiscal planning, the Ontario Ministry of Finance’s GDP growth projections are typically set slightly below the average private-sector forecast. Ontario’s revenues rely heavily on the level and pace of economic activity in the province.
The ongoing monitoring of revenues allows the government to assess potential risks to its finances. Collaboration with the Canada Revenue Agency, which administers approximately 80 per cent of Ontario’s taxation revenues, is essential to achieving this. As well, Ontario continues to explore ways to enhance its tax revenue forecasting and monitoring.
There are also risks arising from other sources of revenue, such as federal transfers and income from GBEs. Since these represent a smaller share of total revenue compared to larger revenue sources such as tax revenue — the risks they present are relatively less material to the fiscal plan. In addition, these risks are difficult to predict and quantify; for example, federal transfers are subject to federal policy changes while GBE net incomes are subject to regulatory decisions and market conditions. Note 1 to the Consolidated Financial Statements provides additional details on measurement of uncertainty.
Additionally, given the current pace of change and the interdependent nature of the external and emerging risk environment, the Province needs to consider potential threats and opportunities as it sets priorities. Areas like artificial intelligence, geopolitical stability, cybersecurity, infrastructure, sustainability, supply chain challenges and the changing workforce create a dynamic environment that may introduce or amplify existing risks to government and requires targeted responses and mitigation to support the government’s ability to achieve its priorities.
To address these challenges, critical investments and additional expenditures enabled the provision of services and the delivery of programs. This included the development of responsive policies and enhancements to existing programs across areas such as the health, education, and justice sectors, as well as a continued focus on modernizing government services to support economic development, enable digital transformation, and address key infrastructure needs.
Other risk management tools the government utilized include contingency funds to address risks that materialized. In the 2023 Budget, the government committed a total of $4.0 billion ($3.9 billion for operating and $0.1 billion for capital) for the standard contingency fund. Funds from the standard contingency fund were used to support initiatives such as:
- Addressing the increased compensation requirements for Ontario’s Public Service and broader public sector;
- Supporting and expanding the home and community care sectors;
- Supporting municipalities through new deals to support municipal roads and transit systems, and shelters and homelessness programs;
- Managing emergency situations, including wildland fire response, for the public health and safety of Ontario’s people and places; and
- Health sector supports for increased utilization of Ontario Drug Benefit programs and cancer treatment services.
As required under the Fiscal Sustainability, Transparency and Accountability Act, 2019, a reserve is included in the projected surplus/deficit each year to guard against unforeseen revenue and expense changes that could have a negative impact on the government’s fiscal performance. The 2023 Budget included a $1.0 billion reserve for 2023–24. Excluding this reserve, the projected deficit for 2023–24 in the 2023 Budget was $0.3 billion.
Provisions for losses that are likely to occur as a result of contingent liabilities, such as ongoing litigation and land claims, and that can be reasonably estimated, are expensed and reported as liabilities. Note 1 to the Consolidated Financial Statements provides further details.
Note 3 to the Consolidated Financial Statements explains the government’s risk management strategies, which are intended to ensure that exposure to borrowing-related risk is managed in a prudent and cost-effective manner.
Changes in Canadian generally accepted accounting principles (GAAP) for the public sector issued by the Public Sector Accounting Board (PSAB) can have an impact on Ontario’s budgets, estimates and actual results. This fiscal year, the adoption of new accounting standards, Section PS 3400 Revenue and Section PS 3160 Public Private Partnerships, resulted in an impact to the Public Accounts. Disclosures on the impact of adoption of new accounting standards are included in Note 1(f) to the Consolidated Financial Statements. The Office of the Comptroller General, Treasury Board Secretariat, actively monitors proposed changes and provides input to standard setters to support the development of standards that support sound public policy decision-making, transparency and accountability in reporting.
Key financial ratios
In this section of the Annual Report, the use of key measures of financial position will be used to assess Ontario’s financial position. The levels and trends of these measures indicate the impacts of economic and other events on the Ontario government’s finances. The ratio and level of each over the past five fiscal years are outlined in Table 8.
| Item | 2019–20 | 2020–21 | 2021–22 | 2022–23 | 2023–24 |
|---|---|---|---|---|---|
| Sustainability — Net debt-to-GDP (%) | 39.5 | 42.6 | 39.9 | 38.1 | 37.3 |
| Sustainability — Net debt to total revenue (%) | 225.6 | 225.8 | 206.8 | 207.3 | 198.1 |
| Sustainability — Net debt per capita (%) | 24,180 | 25,234 | 25,794 | 26,443 | 26,138 |
| Flexibility — Interest on debt to total revenue (%) | 8.0 | 7.5 | 6.8 | 6.4 | 5.5 |
| Flexibility — Own-Source revenue to GDP (%) | 14.6 | 15.1 | 16.2 | 15.5 | 14.2 |
| Vulnerability — Federal transfers to total revenue (%) | 16.3 | 20.6 | 16.5 | 16.2 | 16.7 |
| Vulnerability — Foreign currency debt to total debt (%) | 16.1 | 15.8 | 16.1 | 14.0 | 12.9 |
| Vulnerability — Unhedged foreign currency debt (%) | 0.2 | 0.1 | 0.1 | 0.1 | 0.1 |
Note: Numbers may not add due to rounding.
Measures of sustainability
Net debt provides a measure of the future government revenues that will be required to pay for the government’s past transactions. Net debt as a percentage of Ontario’s GDP shows the financial demands on the economy resulting from the government’s spending and taxation policies. A lower ratio of net debt-to-GDP generally indicates higher sustainability.
The government’s net debt-to-GDP ratio was 37.3 per cent at the end of fiscal year 2023–24, lower than the 37.8 per cent forecast in the 2023 Budget. As shown in Table 8, this ratio has decreased by 0.8 percentage points over the prior year, largely due to net debt increasing at a slower rate than GDP. The ratio of net debt to total revenue is another key measure of sustainability, since net debt reflects the future revenue that is required to pay for past transactions and events. A lower net debt-to-revenue ratio generally indicates higher sustainability. This ratio was 198.1 per cent at the end of fiscal year 2023–24, lower than the 198.9 per cent forecast in the 2023 Budget. The ratio decreased by 9.2 percentage points from the prior year primarily due to revenues rising faster than net debt.
Measures of flexibility
The ratio of Interest on Debt to Total Revenue shows the share of provincial revenue that is being used to pay interest expense on debt and therefore is not available for programs. A lower ratio generally indicates that a government has more flexibility to direct its revenues to programs. The ratio has fallen for Ontario over the past five years, from a high of 8.0 per cent in 2019–20 to the current level of 5.5 per cent. Despite upward movements in interest rates from the previous year, the government’s strategy of extending duration terms of its borrowing program and locking in interest rates that continued to be historically low, for a longer period, has also contributed to lower interest costs. This strategy has extended the weighted-average term to maturity of provincially issued debt from approximately 8 years in 2009–10 to approximately 15 years in 2023–24.
Own-source revenue as a share of Ontario’s GDP shows the extent to which the government is leveraging funds from the provincial economy collected through taxation, user fees and other revenue sources it controls. A high taxation burden may make a jurisdiction less competitive, therefore increases in this ratio may reduce future revenue flexibility. During 2020–21 and 2021–22, financial support from all levels of government was provided to people and businesses in response to COVID-19, which contributed to growth in Personal and Corporate Income Tax revenues. As this support did not directly increase GDP, it led to an increase in the ratio.
Measures of vulnerability
Transfers from the federal government as a percentage of total revenue is an indicator of the degree to which Ontario relies on the federal government for revenue. A higher ratio may imply that a provincial government is more reliant on federal transfers. Provinces may have limited control over the value of these transfers, and changes in federal policies can result in shifts in federal revenues to provinces.
Ontario’s share of revenue from federal transfers (including direct transfers to the BPS) is 16.7 per cent in 2023–24, close to the same level as 2019–20.
Foreign currency debt to total debt is a measure of vulnerability to changes in foreign currency exchange rates. Accessing borrowing opportunities in foreign currencies allows Ontario to diversify its investor and funding base. It also ensures that the government will continue to have adequate access to capital in the event that domestic market conditions become more challenging. Ontario manages foreign currency risk by hedging its exposure to foreign currencies through the use of financial instruments. Effective hedging has allowed the government to consistently limit its exposure to foreign currency fluctuations to 0.2 per cent of debt issued for provincial purposes in 2019–20, declining to 0.1 per cent in 2020–21 and remaining unchanged in 2023–24.
Fiscal management
Use of taxpayer dollars
To support long-term economic growth and sustainable public finances, the government remains committed to ensuring taxpayer dollars are managed appropriately. In this regard, the government emphasizes the use of evidence-based decision-making and performance measurement to identify opportunities for modernization and improvement. This approach supports the development and implementation of programs and services aiming to improve outcomes and efficiency while maintaining fiscal sustainability.
The Audit and Accountability Committee (AAC) plays an important role in supporting the government’s efforts to ensure the effectiveness and efficiency of operations, and sound stewardship of public funds through effective risk management, governance and internal control practices. The AAC supports enhanced governance by providing input and direction to ensure internal audit services continue to align with emerging risks and government priorities, based on independent strategic advice provided by the Ontario Internal Audit Committee (OIAC), an advisory audit committee of the AAC.
Non-financial activities
This section discusses key non-financial results of major sectors. The purpose is to provide highlights of Ontario government spending and the related activities in these sectors.
Health sector
The Province is delivering connected and convenient care that focuses on delivering the right care in the right place, faster access to care, better quality of long-term care and hiring more health care workers. The goal is to make health and long-term care more convenient by connecting people to quality care, closer to home.
Results reported in 2023–24 include, but are not limited to:
- Investing in 29 new or expanded primary care teams to reduce barriers for underserved communities and connect people to primary care, particularly those in marginalized or vulnerable populations.
- Continuing to support over 16,000 health care workers through the Clinical Scholar Program to ensure newly graduated nurses, internationally educated nurses and nurses wanting to upskill have the support they need to confidently transition into and grow in the nursing profession.
- Supporting over 1,000 personal support workers and registered practical nurses through the Bridging Educational Grant.
- Enabling health care workers already registered or licensed in another Canadian jurisdiction to start work immediately in Ontario.
- Strengthening Emergency Department (ED) care by delivering enhanced ED training to over 400 nurses working in smaller, rural and northern hospitals.
- Enhancing health care in Northern Ontario through enhanced travel and accommodation support for medical residents who are completing clinical assignments in Northern Ontario.
- Adding more than 300 spaces in paramedic programs at provincial colleges across Ontario to provide more opportunities to students who want to become paramedics.
- Expanding the role of registered nurses to prescribe medications for conditions such as contraception, immunizations, smoking cessation and topical wound care in a variety of settings close to home.
- Expanding the common ailments program to enable pharmacists to prescribe medications for an additional six common medical ailments.
- Enabling online submission of applications and receipts for the Ontario Drug Benefit Program.
- Announcing the lowering of the eligibility age of self-referral for publicly funded mammograms through the Ontario Breast Screening Program (OBSP) from 50 to 40.
- Adding four new Ontario Health Teams to connect people to care in West Parry Sound, Cochrane, and Timiskaming Districts, as well as Greater Sudbury and Sudbury East, Espanola, Manitoulin, Elliot Lake, and surrounding areas, and bringing the total number of Ontario Health Teams to 58.
- Launching eight Youth Wellness Hubs across the province to connect young people to supports and services for substance use and other mental health concerns. Accelerating the reach of the Ontario Structured Psychotherapy program through 10 network-led organizations with over 100 service locations across Ontario to offer more mental health services in every region of the province.
- Negotiating new contracts with home oxygen vendors to ensure the continuity of supply across the province.
- Providing free publicly funded flu shots and COVID-19 vaccines at local pharmacies, public health units and primary health care providers, and introducing the first publicly funded Respiratory Syncytial Virus (RSV) vaccine program for high-risk older adults and in some congregate care settings.
- Investing in local hospitals and health care facilities to support easier and faster care close to home, including a new Cardiac Catheterization Lab at St. Mary’s General Hospital in Kitchener and a new inpatient acute care unit at the Waypoint Centre for Mental Health Care in Penetanguishene.
- Starting construction on 60 long-term care homes and approximately 5,900 new beds while redeveloping and upgrading over 4,000 additional beds totaling approximately 9,900 long-term care beds.
- Finishing construction and opening 10 long-term care homes with about 970 new beds and over 920 upgraded or redeveloped beds for a total of approximately 1,890 long-term care beds.
- Completing the Accelerated Build Pilot Program to address capacity issues in urban areas by building four new long-term care homes on hospital-owned lands that are helping to meet urgent needs for more long-term care homes in Mississauga, Ajax and Toronto.
- Launching the Equipment and Training Fund to help long-term care homes purchase diagnostic equipment and better train staff to assess, manage and treat residents’ conditions that most often lead to preventable emergency department visits.
- Helping over 900 people launch careers as personal support workers in long-term care homes and in the home and community care sector through training and recruitment incentives.
Education sector
Ontario’s publicly funded early years and education system is focused on preparing Ontario’s children and students for success, and ensuring that young people develop in-demand skills that can be applied to the labour market for good, high-paying jobs. The government is committed to ensuring Ontario continues to have a leading education system, both in English and French, that focuses on important foundational skills like reading, writing and math.
Results reported in 2023–24 include:
- Continuing to modernize curriculum to ensure students have foundational skills in reading, writing, math and STEM to better prepare them for the jobs of tomorrow. This includes:
- Revising existing Ontario curriculum including elementary language/Français curriculum and new Grade 9 English/Français courses for implementation in the 2023–24 school year.
- Revising elementary Social Studies curriculum for implementation in the 2023–24 school year and introducing expanded mandatory learning on the Holocaust, Holodomor and Black history in the compulsory Grade 10 History course and new mandatory learning on Black history in Grade 7 and 8 History for the 2025–26 school year.
- Launching mandatory Mental Health Literacy Modules for students in Grades 7 and 8 beginning in the 2023–24 school year to help students manage stress, care for their mental health and know when and how to get support.
- Implementing a new Grade 10 Computer Studies course starting in the 2023–24 school year, to help students identify connections between digital technologies and different industries and occupations.
- Releasing new financial literacy learning modules for Grade 9 and 10 students to strengthen students’ financial literacy skills.
- Continuing investments in focused supports in the classroom and at home to help students build the math and literacy skills and knowledge they need to succeed.
- Enacting Bill 98 – the Better Schools and Student Outcomes Act, 2023 – which enabled a number of improvements to Ontario’s publicly funded education system including new ways to measure and track student achievement, build schools quicker, and improve transparency for parents.
- Improving access to child care with 505,055 licensed child care spaces for children 0-12 years of age, a 6.8 per cent increase since March 31, 2022.
- Reducing average child care fees through the continued implementation of the Canada-wide Early Learning and Child Care system by an average of 50 per cent from 2020 levels, saving parents about $6,500 per eligible child on average for a full year.
- Supporting the recruitment and retention of qualified professionals working in licensed child care through the announcement of the Workforce Strategy in November 2023.
- Successfully negotiating deals in 2023–24 with all teacher unions, averting strikes or the withdrawal of services.
- Engaging Indigenous partners in fall 2023 as well as education sector stakeholders to discuss key education priorities for First Nation, Métis, Inuit and urban Indigenous students in Ontario.
- Doubling the investment in capital priorities for a total of $1.3 billion for 2023–24, to help start building more schools faster.
Postsecondary education sector
Ontario’s postsecondary system prepares students and job seekers with the high-quality education, skills and opportunities needed to get good jobs and provides Ontario’s businesses with the skilled workforce and talent they need to thrive and prosper. The postsecondary system is a critical part of the province’s social and economic fabric, contributing to stronger and healthier communities.
Results reported in 2023–24 include:
- Increasing postsecondary education attainment rate in 2023–24 to 75 per cent — up from 74 per cent in 2022–23.
- Providing financial assistance through the Ontario Student Assistance Program to approximately 440,000 full-time students in the 2023–24 fiscal year.
- Supporting 3,800 students through the Ontario Learn and Stay Grant with over $30 million in grant funding issued, exceeding the original target of 2,500 recipients.
- Supporting 307 research projects for ground-breaking work at leading research institutes and organizations across the province, including at colleges, universities and research hospitals, through the Ontario Research Fund and Early Researcher Awards.
- Supporting the training of more doctors with an expansion of 260 undergraduate seats and 449 postgraduate positions in medical schools over the next five years.
- Continuing to support the delivery of nursing education by adding up to 3,000 additional enrolment spaces for Practical Nursing and Bachelor of Science in Nursing students beginning in fall 2023.
- Supporting commercialization through Intellectual Property Ontario, which onboarded 229 new clients, for a total of 269 clients.
- Supporting about 6,500 high-quality research internships through Mitacs, an organization that builds research partnerships between postsecondary institutions and industry, with $32.4 million over three years.
- Supporting STEM with an investment of $100 million in 2023–24 for program costs at publicly assisted colleges and universities.
Children’s and social services sector
The Ministry of Children, Community and Social Services works to improve outcomes for children, youth, families and individuals who need support and leads initiatives that increase women’s social and economic opportunity across Ontario. In supporting people through key transition points in life, the ministry helps build an Ontario where children, youth, women and families feel safe, supported and set up for success.
Results reported in 2023–24 include:
- Helping people with disabilities keep pace with the rising costs of living by increasing Ontario’s total social assistance disability payments by almost 12 per cent, since September 2022, for the Ontario Disability Support Program and the Assistance for Children with Severe Disabilities program.
- Continuing to support the enrolment of children into core clinical services by investing in the Ontario Autism Program and providing thousands of children with school supports as they enter kindergarten or grade one for the first time.
- Launching Ontario STANDS (Standing Together Against gender-based violence Now through Decisive actions, prevention, empowerment and Support), a four-year, cross-government action plan to better respond to gender-based violence, build safer and healthier communities, and support women’s wellbeing and economic opportunities.
- Taking further steps to end gender-based violence and support victims by signing a four-year bilateral agreement between Canada and Ontario to implement the National Action Plan to End Gender-Based Violence.
- Launching a call for applications to help equip low-income women with the skills and knowledge to find a job or start a business in high-demand sectors.
- Helping women experiencing social and economic barriers connect to supports and develop the skills they need to gain financial security and independence through an expansion of the Investing in Women’s Futures Program to 10 additional locations.
- Launching the Ready, Set, Go program to connect youth in the child welfare system, ages 18 to 23, with services and supports they need to prepare for and succeed after leaving care.
- Enabling school-aged children and youth to have healthy meals and snacks throughout the school year by partnering with community organizations to launch the Healthy Students Brighter Ontario campaign through the Student Nutrition and First Nations Student Nutrition Programs.
Justice sector
The justice sector supports the administration and delivery of justice services, including the administration of courts, prosecution of offences, provision of legal services and supports to victims and vulnerable persons, as well as administering the public safety, policing and correctional systems to ensure that Ontario’s diverse communities are supported and protected.
Results reported in 2023–24 include:
- Continuing the largest transformation of the justice sector in Ontario’s history, designed to bring more services online across Ontario, including rural, Northern and First Nation communities. This included:
- Extending availability of video and audio court hearings to every region, enabling 124 courtrooms across Ontario to support hybrid hearings, making available 48 satellite units to support virtual court proceedings in 27 First Nation fly-in communities in Northern Ontario, and providing high-speed internet and video conferencing capabilities;
- Expanding electronic filing service to include more than 800 types of civil, family, bankruptcy, Divisional Court and Small Claims Court documents; and
- Developing a single online platform to allow court users to file documents, pay fees and increase access to hearings.
- Transforming correctional services in Northern Ontario by:
- Introducing new measures, such as the creation of an Organized Crime Towing and Auto Theft Team, to combat and prevent auto theft by identifying, disrupting and dismantling organized crime networks.
- Removing financial barriers for those considering a career as a police officer and increasing the capacity of the Basic Constable Training program to approximately 2,000 graduates in 2024.
- Fighting hate-motivated crimes as part of Ontario’s Guns, Gangs and Violence Reduction Strategy by supporting victims and survivors of intimate partner violence/domestic violence, human trafficking and child exploitation through the Victim Support Grant program.
- Strengthening the province’s bail system by providing support to Ontario Provincial Police detachments, municipal and First Nation police services, as well as establishing serious violent crime bail support teams to ensure Crown attorneys are available to prepare for bail hearings.
- Supporting the work of the Alcohol and Gaming Commission of Ontario in licensing and regulating a new retail marketplace for alcohol, including expanding the sale of beer, wine, cider and ready-to-drink beverages to grocery, convenience and big box stores across Ontario.
- Supporting Ontario’s regulated iGaming market, which sustained almost 15,000 jobs in its second year of operation and added a combined $1.24 billion to federal, provincial and municipal government revenues.
Condition and capacity of provincial tangible capital assets
Infrastructure investments should be made using an evidence-based approach. This includes a focus on asset management to ensure the delivery of high-quality public services, while efficiently managing the costs.
- The Province compiled its first infrastructure asset inventory in 2016 as a key step in managing provincial assets more effectively. The infrastructure asset inventory is now updated annually and currently contains information such as the location, age, condition and value of over 15,000 tangible capital assets, including buildings and Ontario’s entire road and bridge network. This covers the majority of the infrastructure assets owned or consolidated (i.e., certain BPS organizations) by the Ontario government, as well as some other assets that are funded in part, but not owned or consolidated, by the government.
- The Province uses the infrastructure asset inventory to track, monitor and report on the physical condition of assets. For example, the infrastructure asset inventory contains indicators such as Facility Condition Indexes (FCIs), Bridge Condition Indexes (BCIs) and Pavement Condition Indexes (PCIs), which help to inform the state of infrastructure assets.
- Ontario has expanded its infrastructure asset data to include other relevant data and analysis, such as the current and projected capacity and utilization of assets. This integrated data provides a base to support evidence-based infrastructure planning decisions which help ensure that infrastructure investments provide value for money and are made at the right time and the right place.
Transparency and accountability
Ontario continues to take steps that enhance government transparency and fiscal accountability in its financial reporting. Throughout the fiscal year, the government provides regular updates on Ontario’s finances. The Annual Report and Consolidated Financial Statements, along with supplementary information, are central to demonstrating the government’s transparency and accountability in reporting its financial activities and its position at the end of the fiscal year.
Recent developments in public sector accounting standards
The Ontario government’s financial reports are prepared in accordance with the accounting standards for governments set by the Public Sector Accounting Board (PSAB) and contained in the Chartered Professional Accountants of Canada (CPA Canada) Public Sector Accounting Handbook.
Public Private Partnerships
In April 2021, PSAB issued a standard, Section PS 3160 Public Private Partnerships (PS 3160) effective for fiscal years beginning on or after April 1, 2023. The standard provides guidance related to the accounting and disclosure of certain public private partnerships, where the private sector partner is responsible for procuring infrastructure, financing the infrastructure cost past the point of when it is ready for use and operating and/or maintaining the infrastructure.
Effective April 1, 2023, the Province adopted Section PS 3160 using retroactive method with restatement of 2022–23 figures. The significant accounting policy disclosures are included in Note 1(e).
Purchased intangibles
The Public Sector Accounting Board (PSAB) issued a new guideline, the Public Sector Guideline-8 (PSG 8), Purchased Intangibles. These amendments and the new guidelines are effective April 1, 2023 and require purchased intangibles assets to be capitalized.
Purchased intangible assets are non-financial assets lacking physical substance that are purchased through an arm’s length exchange transaction between knowledgeable, willing parties that are under no compulsion to act. Effective April 1, 2023, the Province adopted PSG-8 prospectively. The significant accounting policy disclosures are included in Note 1(e).
Revenue
Effective April 1, 2023, the Province adopted Public Sector Accounting Standard Section PS 3400, Revenue. This standard provides a framework for recognizing revenue by distinguishing between revenue arising from transactions that include performance obligations, referred to as exchange transactions, and those that do not have performance obligations, referred to as non-exchange transactions. The Province adopted Section PS 3400 using the retroactive method with restatement of 2022–23 figures. The significant accounting policy disclosures are included in Note 1(e).
The C.D. Howe Institute Fiscal Accountability Report
Annually, the C.D. Howe Institute issues its commentary on the fiscal reporting transparency of senior Canadian governments, with a focus on the relevance, accessibility, timeliness and reliability of these government financial reports, including the Public Accounts. Each government is assigned a letter grade based on the quality of the numbers presented in these reports, access and user friendliness, and the ability to use them for various decision-making purposes.
The last report was released in October 2023. In the report, for the second consecutive year, Ontario had maintained its grade.
At the time of the Auditor General opinion date for the 2023–24 Public Accounts, the 2024 Fiscal Accountability Report covering the Public Accounts of Ontario 2022–2023 had not been issued.
Chart descriptions
Chart 1: 2023–24 Revenue by Source
This chart shows the percentage composition of Ontario’s Total Revenues in 2023–24 by source. Total revenue is $205.9 billion.
Personal Income Tax accounts for 24.7 per cent. Sales Tax accounts for 19.4 per cent. Federal Transfers account for 16.7 per cent. Other taxes account for 10.8 per cent. Corporations Tax accounts for 11.2 per cent. Fees, donations and other revenues from BPS account for 6.3 per cent. Other non-tax revenue accounts for 4.5 per cent. Education Property Tax accounts for 2.8 per cent. Income from Investment in Government Business Enterprises accounts for 3.6 per cent.
Note: Percentages may not add to 100 per cent due to rounding.
Chart 2: Revenue by source — 5-year comparison
This bar graph shows recent trends in revenue for Ontario’s major revenue sources. The source categories include taxation, federal transfers, income from investment in Government Business Enterprises, fees, donations and other revenue from hospitals, school boards and colleges, children’s aid societies, and other revenues for the period between 2019–20 to 2023–24.
Notes: Government Business Enterprises are: Hydro One Limited, Liquor Control Board of Ontario, Ontario Lottery and Gaming Corporation, Ontario Power Generation Inc., iGaming Ontario and Ontario Cannabis Retail Corporation. Provincial revenue from Hydro One Limited’s net income is proportional to the government’s ownership share.
Chart 3: 2023–24 Program expense by sector
This chart shows the percentage composition of Ontario’s program expenses in 2023–24 by sector. Program expense equals total expense minus interest on debt expense. Total program expense in 2023–24 was $195.2 billion.
The details of the program expenses by sector are as follows: Health accounts for 43.8 per cent; Education accounts for 19.0 per cent; Other programs account for 17.3 per cent; Children’s and social services account for 10.0 per cent; Postsecondary education accounts for 6.8 per cent; and Justice accounts for 3.1 per cent.
Notes: The Teachers’ Pension Plan expense is included in Other programs and aligns with the presentation in Table 3.8 of the 2023 Budget. Percentages may not add to 100 per cent due to rounding.
Chart 4: 2023–24 Spending by type of expense
This chart shows the percentage composition of Ontario’s total expenses in 2023–24 by type of expense. Total expense is $206.6 billion.
Transfers account for 38.9 per cent. Salaries and benefits account for 34.8 per cent. Operating costs account for 19.2 per cent. Interest on debt account for 5.5 per cent. Other expenses account for 1.6 per cent.
Notes: Compensation related costs for non-consolidated entities (for example, municipalities, universities) and payments to doctors for physician services are included in Transfers. Percentages may not add to 100 per cent due to rounding.
Chart 5: Expense by sector — 5-year comparison
This bar graph shows the trend in total spending for major program areas: Health, Education, Children’s and social services, Postsecondary education, Justice, Other programs, and interest expense for the period between 2019–20 to 2023–24.
Notes: The Teachers’ Pension Plan is included in Other programs to align with the presentation in Table 3.8 of the 2023 Budget.
Chart 6: Interest on debt to total revenue — 5-year trend
This graph shows the trend in the total interest on debt cost to total revenue from 8.0% in 2019–20 to 5.5% in 2023–24.
Chart 7: Financial assets — 5-year comparison
This bar graph shows the trend in Ontario’s financial assets by category: cash, investments, accounts receivable, loans receivable, derivative assets, other assets, and investment in Government Business Enterprises from 2019–20 to 2023–24.
Note: Government Business Enterprises include: Hydro One Limited, Liquor Control Board of Ontario, Ontario Lottery and Gaming Corporation, Ontario Power Generation Inc., iGaming Ontario and Ontario Cannabis Retail Corporation.
Chart 8: Trends in the net book value of Provincial Tangible Capital Assets — 5-year comparison
This bar graph shows the trends in net book value of provincial tangible capital assets by sector: Transportation and transit, Health, Education, Postsecondary education and Other for the period between 2019–20 to 2023–24.
Chart 9: Liabilities — 5-year trend
This bar graph shows the recent trends in total liabilities for Ontario by type: debt, other long-term financing and other types of liabilities from 2019–20 to 2023–24.
Footnotes
- footnote[1] Back to paragraph Comparatives on Budget and prior year Actuals have been reclassified to be reflected on the same basis as that used to report the Actual current year balances. Actual results for 2022–23 are also restated to reflect the implementation of Public Sector Accounting Standard (PSAS) Section PS 3610 Public Private Partnership (P3) and Section PS 3400 Revenue. See Note 17 to the Consolidated Financial Statements.
- footnote[2] Back to paragraph Ontario Teachers’ Pension Plan impact is included in Other programs to align with the presentation in Table 3.8 of the 2023 Budget. In the Consolidated Financial Statements, this item appears under the Education sector. Schedule 4 to the Consolidated Financial Statements provides details.
- footnote[3] Back to paragraph Comparatives on prior year Actuals have been reclassified to be reflected on the same basis as that used to report the Actual current year balances. Actual results for 2022–23 are also restated to reflect the implementation of PSAS Section PS 3400 Revenue. See Note 17 to the Consolidated Financial Statements.
- footnote[4] Back to paragraph Includes adjustments for the net book value of assets disposed during the year, as well as changes in valuation.
- footnote[5] Back to paragraph Mainly transfers for capital purposes to municipalities and universities and expenditure for capital repairs.
- footnote[6] Back to paragraph Includes social and justice sectors, high-speed internet, government administration, natural resources, and the culture and tourism industries.
- footnote[7] Back to paragraph Includes other partner funding which refers to third-party investments primarily in consolidated entities such as hospitals, colleges, school boards and children’s aid societies.
- footnote[8] Back to paragraph Includes federal and municipal contributions to provincial infrastructure investments.
- footnote[9] Back to paragraph Actual results for 2022–23 are restated to reflect the implementation of PSAS Section 3610 Public Private Partnership (P3) and Section 3400 Revenue. See Note 17 to the Consolidated Financial Statements.
- footnote[10] Back to paragraph Decrease in cash from a net decrease of $3.6 billion in changes to assets and liabilities and an operating deficit of $0.6 billion. See the Consolidated Statement of Cash Flow.
- footnote[11] Back to paragraph New Tangible Capital Asset investments of $17.8 billion less proceeds of $0.3 billion from the sale of tangible capital assets.
- footnote[12] Back to paragraph Decrease in cash due to investment retirement in excess of purchases of $8.1 billion and the build-up of cash reserve of $1.6 billion.
- footnote[13] Back to paragraph Including net decrease in financing of capital projects through Public Private Partnership (P3). See Note 4 to the Consolidated Financial Statements.