Soil capability for agriculture in Ontario
Learn how to use the Canada Land Inventory to assess the effects of climate and soil characteristics on the limitations of land for growing common field crops.
Purpose
This technical information is for municipalities, contractors and land use planners in Ontario.
The purpose of this information is to provide a comprehensive classification framework for the application of the Canada Land Inventory (CLI) Soil Capability for Agriculture to mineral soils and landscapes in Ontario. The guidelines given here supersede those provided in CLI, Soil Capability Classification for Agriculture
Introduction
The CLI for agriculture is an interpretative system for assessing the effects of climate and soil characteristics on the limitations of land for growing common field crops. Common field crops in Ontario include:
- corn
- soybeans
- small grains
- perennial forages
This system does not classify land for horticultural or other specialty type crops.
The system evaluates mineral soils’:
- productivity relative to all mineral soils in Ontario and Canada
- flexibility or range of common field crops they can produce
- management needs with respect to necessary improvements and conservation practices for field crop production
The system emphasizes the potential capability of soils. Therefore, the present land use and management of a given land area may or may not reflect its potential soil capability. For example, a forested area may rate highly under the CLI even though it has not been cleared and developed for agricultural use.
Assumptions
CLI classification depends on combinations of climate and soil characteristics which affect limitations to soil use and productive capacity for common field crops. The need for land improvement by the removal of shrubs, trees and stumps is not considered a limitation to agricultural capability unless it is considered unfeasible to remove them.
Contemporary best management practices for soil management and field crop production are in place.
The various soils within a given capability class are considered similar in degree of limitation, notwithstanding the various kinds of limitations which may be present.
The soil capability class represents the potential capability of land in its improved state. Land requiring improvements, such as stone removal or tile drainage that are feasible and can be done by the individual farmer or landowner, is classified according to what its ongoing limitations would be with the needed improvements in place. It is recognized that in some local or site-specific situations certain improvements may not be feasible even though such improvements are generally feasible on similar soils elsewhere.
The capability classification of the soils in an area may be changed when major reclamation works are installed which permanently reduce or eliminate the present limitations.
Distance to market, kind of roads, location, size of farms, characteristics of land ownership and cultural patterns and the skill or resources of individual operators are not criteria for CLI classification.
Capability groupings may be subject to change as new information about the behaviour and responses of soils become available.
Capability class and subclass definitions
In the CLI system, there are 7 capability classes. Soils descend in quality from Class 1, which is highest, to Class 7 soils, which have no agricultural capability for the common field crops. Class 1 soils have no significant limitations. Class 2 through 7 soils have one or more significant limitations, each of which are denoted by a capability subclass.
Definitions of the capability classes
Class 1
Soils in Class 1 have no significant limitations in use for crops. They are level to nearly level, deep, well to imperfectly drained and have good nutrient and water holding capacity. They can be managed and cropped without difficulty. Under good management they are moderately high to high in productivity for the full range of common field crops.
Class 2
Soils in Class 2 have moderate limitations that reduce the choice of crops or require moderate conservation practices. These soils are deep but may not hold moisture and nutrients as well as Class 1 soils. The limitations are moderate, and the soils can be managed and cropped with little difficulty. Under good management they are moderately high to high in productivity for a wide range of common field crops.
Class 3
Soils in Class 3 have moderately severe limitations that reduce the choice of crops or require moderate conservation practices. The limitations are more severe than for Class 2 soils. They affect one or more of the following practices:
- timing and ease of tillage
- planting and harvesting
- choice of crops
- methods of conservation
Under good management these soils are fair to moderately high in productivity for a wide range of common field crops.
Class 4
Soils in Class 4 have severe limitations that restrict the choice of crops, or require special conservation practices and very careful management, or both. The severe limitations seriously affect one or more of the following practices:
- timing and ease of tillage
- planting and harvesting
- choice of crops
- methods of conservation
These soils are low to medium in productivity for a narrow to wide range of common field crops but may have higher productivity for a specially adapted crop.
Class 5
Soils in Class 5 have very severe limitations that restrict their capability to producing perennial forage crops, and improvement practices are feasible. The limitations are so severe that the soils are not capable of use for sustained production of annual field crops. The soils are capable of producing native or tame species of perennial forage plants and may be improved through the use of farm machinery. Feasible improvement practices may include:
- clearing of bush
- cultivation
- seeding
- fertilizing
- water control
Class 6
Soils in Class 6 are unsuited for cultivation but are capable of use for unimproved permanent pasture. These soils may provide some sustained grazing for farm animals, but the limitations are so severe that improvement through the use of farm machinery is impractical. The terrain may be unsuitable for the use of farm machinery, or the soils may not respond to improvement, or the grazing season may be very short.
Class 7
Soils in Class 7 have no capability for arable culture or permanent pasture. This class includes marsh, rockland and soil on very steep slopes.
Definitions of the capability subclasses
Capability subclasses indicate the kinds of limitations present for agricultural use. Thirteen subclasses were described in CLI Report No. 2. Eleven of these Subclasses have been adapted to Ontario soils.
Subclass definitions
Subclass C: Adverse climate
Subclass C denotes a significant adverse climate for crop production as compared to the median climate, which is defined as one with sufficiently high growing-season temperatures to bring common field crops to maturity, and with sufficient precipitation to permit crops to be grown each year on the same land without a serious risk of partial or total crop failures. In Ontario, this subclass limitation is applied to land averaging less than 2300 crop heat units (CHU).
Subclass D: Undesirable soil structure and/or low permeability
Subclass D is used for soils which are difficult to till, or which absorb or release water very slowly, or in which the depth of rooting zone is restricted by conditions other than a high-water table or consolidated bedrock. In Ontario, this subclass limitation is based on the existence of critical clay contents in the upper soil profile. These soils are generally more susceptible to compaction than lighter textures soils are.
Subclass E: Erosion
Soils falling under Subclass E have been damaged by erosion and loss of organic matter, topsoil and/or subsoil has reduced productivity. In extreme situations, where erosion has caused deep gullies, use of farm machinery is obstructed.
Subclass F: Low natural fertility
Subclass F is made up of soils having low fertility that is either correctable with careful management in the use of fertilizers and soil amendments or is difficult to correct in a feasible way. The limitation may be due to:
- a lack of available plant nutrients
- high acidity
- low exchange capacity
- presence of toxic compounds
Subclass I: Inundation by streams or lakes
In soils falling under Subclass I, periodic flooding by streams and lakes causes crop damage or restricts agricultural use.
Subclass M: Moisture deficiency
Soils in Subclass M have low moisture holding capacities and are prone to droughtiness.
Subclass P: Stoniness
Subclass P indicates soils sufficiently stony to hinder tillage, planting and harvesting operations.
Subclass R: Consolidated bedrock
In soils falling under Subclass R, the occurrence of consolidated bedrock within 100 centimetres of the surface restricts rooting depth and limits moisture holding capacity. Conversely, in poorly drained soils the presence of the bedrock may, depending on depth, make artificial drainage impossible. Where physical soil data is available, the water retention model
Subclass S: Adverse soil characteristics
Subclass S denotes a combination of limitations of equal severity. In Ontario, it is often used to denote a combination of F and M when these are present with a third limitation such as T, E or P.
Subclass T: Topography
Subclass T denotes limitations due to slope steepness and length. The steepness of the surface slope and the pattern or frequency of slopes in different directions are considered topographic limitations if they:
- hinder machinery use
- decrease the uniformity of crop growth and maturity
- increase the potential for tillage and water erosion potential
- increase the cost of farming the land over that of level or less sloping land
Subclass W: Excess water
Subclass W indicates the presence of excess soil moisture due to poor or very poor soil drainage. It is distinguished from Subclass I, which indicates risk of flooding from adjacent lakes or streams. Excess water may result from inadequate soil drainage, a high-water table, seepage or runoff from surrounding areas. This limitation only applies to soils classified as poorly or very poorly drained.
Information requirements
CLI classification of a soil individual requires the following data.
Soil drainage class
The soil drainage classes used in Ontario and Canada are:
- very rapid
- rapid
- well
- moderately well
- imperfect
- poor
- very poor
Thickness of unconsolidated soil material over bedrock
Depth to consolidated bedrock is required at sites where bedrock contact occurs at a depth of less than 1 metre.
Soil horizons
The type and thickness of significant soil horizons need to be identified. These include:
- depth of topsoil (Ap or Ah horizon)
- diagnostic and significant B horizons
- depth to and nature of C horizons (parent material)
Texture/particle size distribution
Textural class (mineral material <2 millimetres) for each significant horizon; gravelly modifiers to the textural class are needed where gravel content exceeds 20% by weight or 15% by volume.
Soil reaction
The depth at which free carbonates are detectable with 10% hydrochloric acid is needed in known alkaline soils. High acidity may be inferred in some soils if certain soil horizon characteristics are present such as evidence of podzolization. Soil pH testing, especially of parent materials, is also warranted if high acidity is suspected.
Slope
Slope class is based on steepness (%) and length (metres).
Surface stoniness
Surface stoniness is measured by the percentage of surface coverage of stones >15 centimetres diameter and boulders >60 centimetres diameter.
Crop heat units
The average annual CHUs for an area are determined from the general reference map for Ontario.
Location
Location means the geographic reference point of each soil profile and soil landscape inspection, as well as with respect to areas under risk of flooding by streams or lakes.
Determination of subclasses and capability ratings
Classifying a soil individual using CLI involves:
- Identifying all subgroup limitations and the severity of each limitation (this involves the interpretation of the soil profile and landscape data using the guidelines provided in Tables 1 to 13).
- Arriving at the final soil capability class on the basis of the most severe subgroup limitation (or limitations if 2 or more are present of equal severity).
When a soil has a single limitation, the subclass that represents that limitation is shown in the soil capability class (for example, an excess water limitation is represented by the subclass W). As a general rule, only the subclass that represents the most severe limitation is shown, since it is that limitation which has determined the capability class. In cases where 2 limitations of equal severity exist which have therefore equally determined the capability rating, both are shown in the map symbol. When a soil has more than 2 limitations of equal severity, all of the subclasses that apply to the soil are usually not shown in the class. These conventions are applied in order to simplify soil capability map units and their symbols.
Conventions in the assignment of subclasses and classes
The subclass or subclasses are denoted by capital letters placed after the class number (for example, 2P designates a Class 2 soil due to a moderate surface stoniness limitation).
A subclass is used in a classification notation only when the limitation it represents has been a factor in determining the final CLI class (for example, a soil individual or soil landscape with both a moderate stoniness limitation (equivalent to 2P) and a moderately severe topographic limitation (equivalent to 3T) would be denoted as 3T).
The subclass S is used in Ontario to represent a combination of 2 or more subclasses, when that combination is present with a third limitation of equal severity (for example, 3FMT may be denoted as 3ST).
The climatic limitation, subclass C, is applied to soil landscapes in areas which average less than 2300 CHUs. In such areas, only soils with no other limitations have the subclass C cited in their notation (for example, 2C, 3C) depending on the degree of CHU deficit less than the 2300 level. Soils of the same area but with other limitations present are first downgraded in accordance with those limitations and then further downgraded according to the degree of CHU deficit. However, the C subclass is not cited in their notation. For example, a pair of soil landscapes with no climatic limitation might classify as 1 and 2W. A pair of physically equivalent soil landscapes in an area of 1900 to 2300 CHUs would classify as 2C and 2W respectively.
When it is necessary to indicate two capability ratings because of a complex soil landscape, the relative proportion of each should be denoted in the map symbol. For example, 2P=3T, 2P>3T, or 2P7>3T3 where the superscript deciles indicate the relative proportion.
Soil texture class groupings
The soil texture classes have been aggregated into soil texture groups (Table 1) to enable easier definition of those subclass guidelines in which soil texture is relevant. Each soil texture group comprises an exclusive range of soil texture classes, including gravelly modifiers.
| Group name | Main particle size characteristics | Textures included in group |
|---|---|---|
| Very gravelly | Materials containing >35% gravel by volume or >50% gravel by weight. | Any texture with a "very gravelly" modifier but generally associated with textures dominated by medium to coarse sands. |
| Sandy | Total sand fraction >50% and dominated by fine to coarse sands; clay content <20%. | Coarse sand, loamy coarse sand, coarse sandy loam, sand, loamy sand, sandy loam, fine sand, loamy fine sand; includes "gravelly" modifiers where applicable. |
| Loamy | Materials containing <27% clay; remaining fractions dominated by high contents of very fine sand and/or silt. | Very fine sand, loamy very fine sand, very fine sandy loam, fine sandy loam, silt, silt loam, loam; includes "gravelly" modifiers if applicable. |
| Clayey | Materials containing 27 to 60% clay. | Sandy clay loam |
| Very fine clayey | Materials containing >60% clay. | Heavy clay. |
Soil reaction classes
The reaction classes have been assigned (Table 2) to enable easier definition of those subclass guidelines in which soil reaction is relevant. Each soil reaction class comprises an exclusive range of soil pH.
| Class | pH |
|---|---|
| Acid | <5.5 |
| Neutral | 5.5–7.4 |
| Alkaline | >7.4 |
Subclass and class criteria
Subclass C: Adverse climate
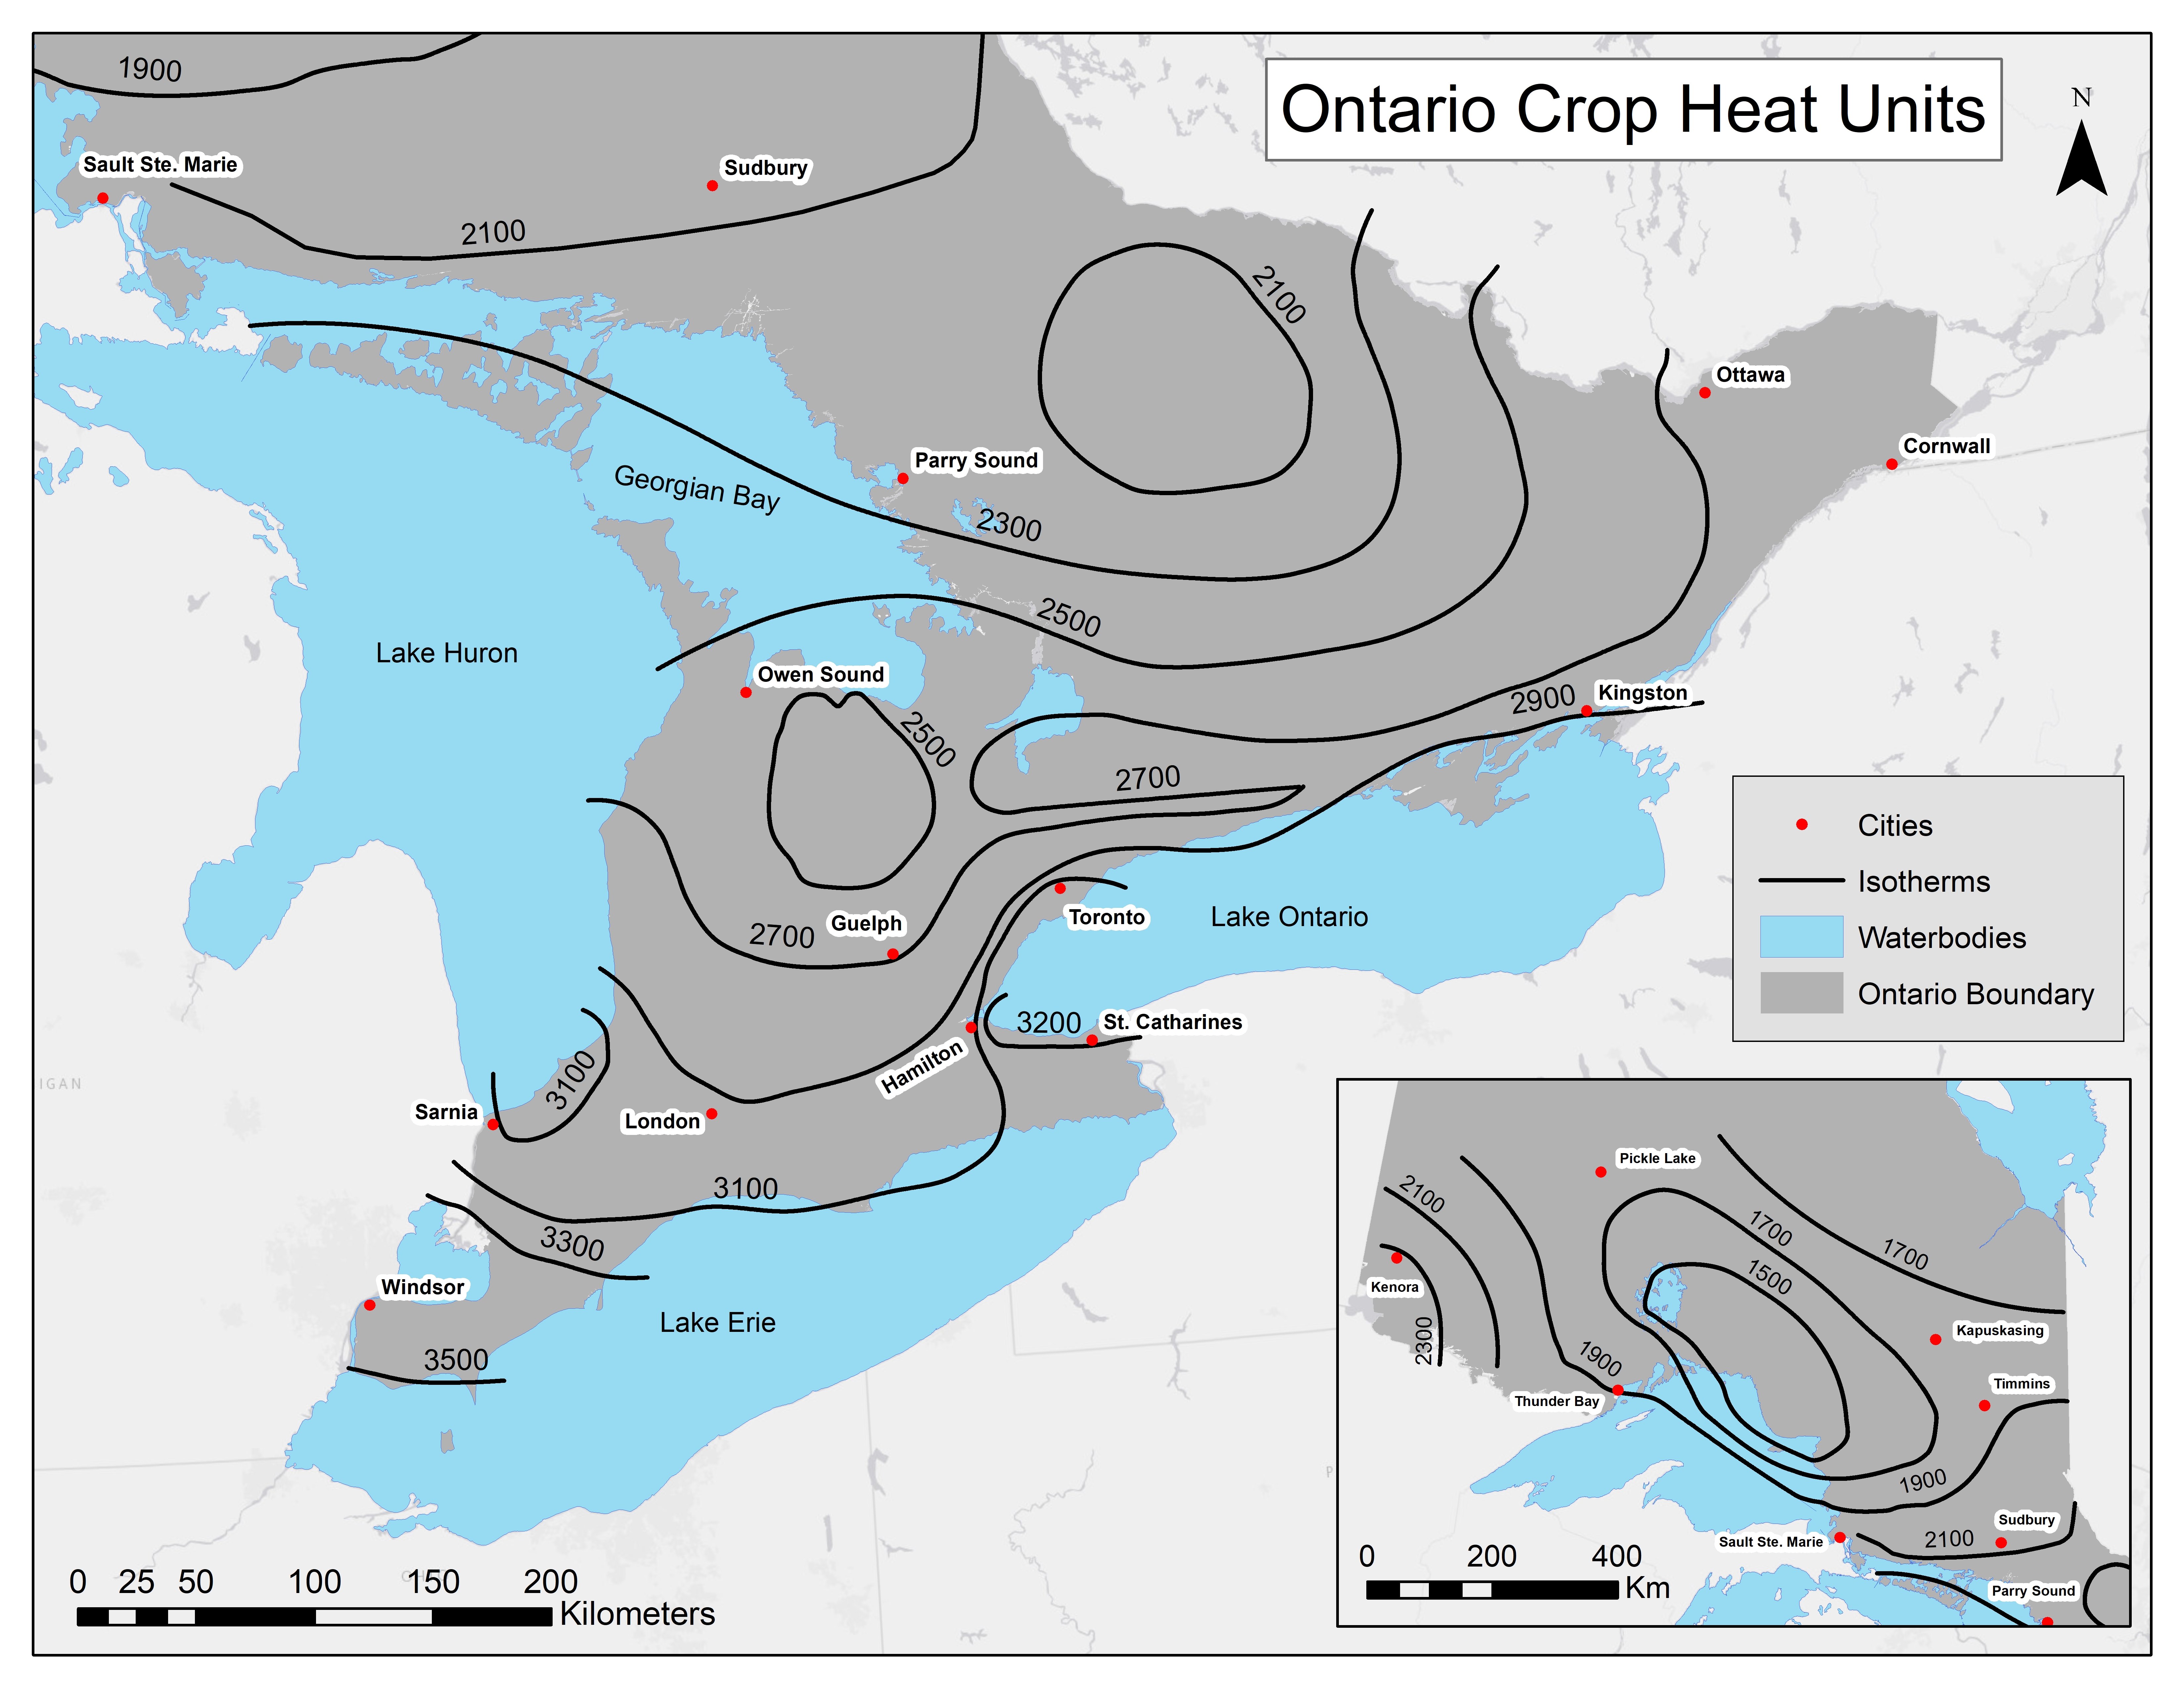
Climate is the most important factor in considering CLI classification for the Province of Ontario. For CLI evaluation in Ontario, climate is characterized by average annual precipitation and average annual heat energy during the growing season. Annual precipitation is considered non-limiting for the whole province while heat energy and growing season length become generally more limiting with latitude. Subclass C, the climatic limitation, does not usually apply in southwestern, south-central and southeastern Ontario. The climate subclass (Table 3) is based upon the average CHU value for the area of consideration. The average CHU value is given by the CHU map in Figure 1.
If the C limitation applies in a given area, it is only cited in the classification notation of those soils present which have no other capability limitations, soils that would be Class 1 if not limited by climate. Soils of the same area with other limitations are also downgraded by the same relative degree as the best soils but the C limitation is not cited in the classification notation. For example, a soil with a moderate wetness limitation (2W) is designated 2W (but not 2CW) if it occurs in an area of 1900 to 2300 CHUs.
| Class | Crop heat units |
|---|---|
| 1 | >2300 |
| 2C | 1900-2300 |
| 3C | 1700-1900 |
| 4C | <1700 |
Subclass D: Undesirable structure and/or low permeability
| Class | Description |
|---|---|
| 2D | The top of a clayey horizon >15 centimetres thick occurs within 40 centimetres of the soil surface. Clayey materials in this case must have >35% clay content. |
| 3D | The top of a very fine clayey (clay content >60%) horizon >15 centimetres thick occurs within 40 centimetres of the soil surface (for example, heavy clay). |
Subclass E: Erosion
| Class | Description |
|---|---|
| 2E | Loss of the original plough layer, incorporation of original B horizon material into the present plough layer, and general organic matter losses have resulted in moderate losses to soil productivity. |
| 3E | Loss of original solum (A and B horizons) has resulted in a plough layer consisting mostly of Loamy or Clayey parent material. Organic matter content of the cultivated surface is less than 2%. |
| 4E | Loss of original solum (A and B horizons) has resulted in a cultivated layer consisting mainly of Sandy parent material with an organic matter content of less than 2%; shallow gullies and occasionally deep gullies which cannot be crossed by machinery may also be present. |
| 5E | The original solum (A and B horizons) has been removed exposing very gravelly material and/or frequent deep gullies are present which cannot be crossed by machinery. |
| 6E | The original solum (A and B horizons) have been removed exposing sandy material and those materials are active (dunes, blowouts and overblown) |
Subclass F: Low natural fertility
| Class | Upper texture group (>40 and <100 centimetres from surface) | Lower texture group (remaining materials to 100 centimetres depth) | Drainage class | Additional soil characteristics |
|---|---|---|---|---|
| 2F | Sandy | Loamy or clayey | Any drainage class | Neutral or alkaline parent material |
| 2F | Sandy | Sandy or very gravelly | Rapid to imperfect | Neutral or alkaline parent material with a well-developed Bt |
| 3F | Sandy | Sandy or very gravelly | Any drainage class | Neutral or alkaline parent material with no well-developed Bt |
| 3F | Sandy | Loamy or clayey | Any drainage class | Acid parent material |
| 3F | Loamy or clayey | Any texture group | Any drainage class | Acid parent material |
| 4F | Sandy | Sandy or very gravelly | Any drainage class | Acid parent material |
| 4F | Very gravelly | Any texture | Rapid to imperfect | Neutral or alkaline parent material |
| 5F | Very gravelly | Any texture | All drainage classes | Acid parent material |
Subclass I: Inundation by streams or lakes
| Class | Description |
|---|---|
| 3I | Frequent inundation with some crop damage; estimated frequency of flooding is less than once every 5 years (floodplain); includes higher floodplain-terraces on which cultivated field crops can be grown. |
| 5I | Very frequent inundation with some crop damage; estimated frequency of flooding is at least once every 5 years (floodplain); includes active floodplain areas on which forage crops can be grown primarily for pasture. |
| 7I | Land is inundated for most of the growing season; often permanently flooded (marsh). |
Subclass M: Moisture deficiency
| Class | Soil texture groups (upper materials) | Soil texture groups (lower materials) | Drainage | Additional soil characteristics |
|---|---|---|---|---|
| 2M | 15 to 40 centimetres of loamy or finer materials | Sandy to very gravelly | Well | N/A |
| 2M | 40 to <100 centimetres of sandy to very gravelly material | Loamy to very fine clayey | Well | N/A |
| 2M | Sandy | Sandy | Rapid to well | Well-developed Bt |
| 3M | Sandy material to > 100 centimetres | Sandy material to > 100 centimetres | Rapid | Bt horizon absent within 100 centimetres of surface |
| 4M | Very gravelly to > 100 centimetres | Very gravelly to > 100 centimetres | Rapid | Bt horizon present within 100 centimetres of surface |
| 5M | Very gravelly to > 100 centimetres | Very gravelly to > 100 centimetres | Very rapid | Bt horizon absent within 100 centimetres |
Subclass P: Stoniness
| Class | Description |
|---|---|
| 2P | Surface stones cause some interference with tillage, planting and harvesting; stones are 15-60 centimetres in diameter and occur in a range of 1-20 metres apart and occupy <3% of the surface area. Some stone removal is required to bring the land into production (Stoniness Class 2 - Moderately stony). |
| 3P | Surface stones are a serious handicap to tillage, planting, and harvesting; stones are 15-60 centimetres in diameter, occur 0.5-1 metres apart (20-75 stones/100 square metres) and occupy 3-15% of the surface area. The occasional boulder >60 centimetres in diameter may also occur. Considerable stone removal is required to bring the land into production. Some annual removal is also required (Stoniness Class 3 - Very stony). |
| 4P | Surface stones and many boulders occupy 3-15% of the surface. Considerable stone and boulder removal is needed to bring the land into tillable production. Considerable annual removal is also required for tillage and planting to take place (Stoniness Class 3 - Very stony). |
| 5P | Surface stones 15-60 centimetres in diameter and/or boulders >60 centimetres in diameter occupy 15-50% of the surface area (>75 stones and/or boulders/100 square metres) (Stoniness Class 4 - Exceedingly stony). |
| 6P | Surface stones 15-60 centimetres in diameter and/or boulders >60 centimetres in diameter occupy >50% of the surface area (Stoniness Class 5 - Excessively stony). |
Subclass R: Shallowness to consolidated bedrock
| Class | Description |
|---|---|
| 3R | Consolidated bedrock occurs at a depth of 50-100 centimetres from the surface causing moderately severe restriction of moisture holding capacity and/or rooting depth. |
| 4R | Consolidated bedrock occurs at a depth of 20-50 centimetres from the surface causing severe restriction of moisture holding capacity and/or rooting depth. |
| 5R | Consolidated bedrock occurs at a depth of 10 to 20 centimetres from the surface causing very severe restrictions for tillage, rooting depth and moisture holding capacity. Improvements such as tree removal, shallow tillage, and the seeding down and fertilizing of perennial forages for hay and grazing may be feasible. |
| 6R | Consolidated bedrock occurs at a depth of 10 to 20 centimetres from the surface but improvements as in 5R are not feasible. Open meadows may support grazing. |
| 7R | Consolidated bedrock occurs at <10 centimetres from the surface. |
Subclass T: Topography
The surface texture of the soil being assessed should be used to assign this limitation using the texture class groupings outlined in Table 1.
| Slope % (class) | <2 (A-B) | <2 (A-B) | 2-5 (C) | 2-5 (C) | 5-9 (D) | 5-9 (D) | 9-15 (E) | 9-15 (E) | 15-30 (F) | 15-30 (F) | 30-70 (G-H) | 30-70 (G-H) | >70 (I-J) | >70 (I-J) |
|---|---|---|---|---|---|---|---|---|---|---|---|---|---|---|
| Slope type | S | C | S | C | S | C | S | C | S | C | S | C | S | C |
| Class | N/A | N/A | N/A | 2T | 2T | 3T | 3T | 4T | 5T | 5T | 6T | 6T | 7T | 7T |
| Slope % (class) | <2 (A-B) | <2 (A-B) | 2-5 (C) | 2-5 (C) | 5-9 (D) | 5-9 (D) | 9-15 (E) | 9-15 (E) | 15-30 (F) | 15-30 (F) | 30-70 (G-H) | 30-70 (G-H) | >70 (I-J) | >70 (I-J) |
|---|---|---|---|---|---|---|---|---|---|---|---|---|---|---|
| Slope type | S | C | S | C | S | C | S | C | S | C | S | C | S | C |
| Class | N/A | N/A | 2T | 2T | 3T | 3T | 4T | 4T | 5T | 5T | 6T | 6T | 7T | 7T |
Subclass W: Excess water
| Soil textures and depths | Depth to bedrock (centimetres) | Soil class (drainage in place or feasible) | Soil class (drainage not feasible) |
|---|---|---|---|
| Very gravelly, sandy or loamy extending >40 centimetres from the surface, or <40 centimetres of any other textures overlying very gravelly, sandy or loamy textures. | >100 | 2W | 4W, 5W |
| >40 centimetres depth of clayey or very fine clayey textures, or <40 centimetres of any other texture overlying clayey or very fine clayey textures. | >100 | 3W | 5W |
| <40 centimetres of peaty material overlying any texture. | >100 | 3W | 5W |
| All textures | 50-100 | 4W | 5W |
| All textures | 0-50 | N/A | 5W |
CLI data input and rating tables
Download a PDF worksheet for fillable versions of the CLI data input and rating tables.
CLI rating examples
Bennington soil series
| Location | Address |
|---|---|
| Name of individual completing the rating | John Smith |
| Date of rating (YYYY-MM-DD) | 2014-07-17 |
| Lot, concession, township | Lot 24 Conc 4 Zorra |
| Latitude, longitude | 43.21406 -80.94513 |
| Soil characteristic | Measurement |
|---|---|
| Crop heat units | 2700-2900 |
| Slope steepness (%) | 1 |
| Slope length (metres) | 100 |
| Surface stoniness (%) | 0 |
| Flooding duration and frequency | N/A |
| Depth to bedrock (metres) | >1 |
| Drainage class | Well |
| Erosion | None |
| Horizon | Depth (centimetres) | Texture | Gravel (%) | pH/reaction |
|---|---|---|---|---|
| Ap | 0-10 | Silt loam | 0 | 6.4/neutral |
| Ae1 | 10-28 | Silt loam | 0 | 5.0/acid |
| Ae2 | 28-51 | Silt loam | 0 | 5.0/acid |
| Bt | 51-81 | Clay loam | 0 | 5.7/neutral |
| IICk | 81-110 | Clay | 0 | 7.4/neutral |
CLI rating
| CLI Subclass limitation | Rating |
|---|---|
| Subclass C – Adverse climate | 1 |
| Subclass D – Undesirable structure/low permeability | 1 |
| Subclass E – Erosion | 1 |
| Subclass F – Low natural fertility | 1 |
| Subclass M – Moisture Deficiency | 1 |
| Subclass R – Consolidated bedrock | 1 |
| Subclass W – Excess water | 1 |
| Subclass I – Inundation by streams or lakes | 1 |
| Subclass P – Stoniness | 1 |
| Subclass T - Topography | 1 |
| Final CLI rating | 1 |
Brookston soil series
| Location | Address |
|---|---|
| Name of individual completing the rating | John Smith |
| Date of rating (YYYY-MM-DD) | 2008-09-15 |
| Lot, concession, township | Lot 20 Conc 11 Mersea |
| Latitude, longitude | 42.16270 -82.49844 |
| Soil characteristic | Measurement |
|---|---|
| Crop heat units | 3300-3500 |
| Slope steepness (%) | 2 |
| Slope length (metres) | 75 |
| Surface stoniness (%) | 0 |
| Flooding duration and frequency | N/A |
| Depth to bedrock (metres) | >1 |
| Drainage class | Poor |
| Erosion | None |
| Horizon | Depth (centimetres) | Texture | Gravel (%) | pH/reaction |
|---|---|---|---|---|
| Ap | 0-20 | Clay | 0 | 6.8/neutral |
| Bg1 | 20-46 | Clay | 0 | 7.0/neutral |
| Bg2 | 46-66 | Clay | 0 | 7.2/neutral |
| Cg | 66-120 | Clay | 0 | 7.8/alkaline |
CLI rating
| CLI subclass limitation | Rating |
|---|---|
| Subclass C – Adverse climate | 1 |
| Subclass D – Undesirable structure/low permeability | 2 |
| Subclass E – Erosion | 1 |
| Subclass F – Low natural fertility | 1 |
| Subclass M – Moisture Deficiency | 1 |
| Subclass R – Consolidated bedrock | 1 |
| Subclass W – Excess water | 3 |
| Subclass I – Inundation by streams or lakes | 1 |
| Subclass P – Stoniness | 1 |
| Subclass T – Topography | 1 |
| Final CLI Rating | 3W |
Otonabee soil series
| Location | Address |
|---|---|
| Name of individual completing the rating | John Smith |
| Date of rating (YYYY-MM-DD) | 2006-05-22 |
| Lot, concession, township | Lot 13 Conc 10 Otonabee |
| Latitude, longitude | 44.22932 -78.22702 |
| Soil characteristics | Measurement |
|---|---|
| Crop heat units | 2700-2900 |
| Slope steepness (%) | 14 |
| Slope length (metres) | 25 |
| Surface stoniness (%) | 2 |
| Flooding duration and frequency | N/A |
| Depth to bedrock (metres) | >1 |
| Drainage class | Well |
| Erosion | Some mixing of B horizon into the plow layer |
| Horizon | Depth (centimetres) | Texture | Gravel (%) | pH/reaction |
|---|---|---|---|---|
| Ap | 0-10 | Loam | 10 | 6.5/Neutral |
| Bm | 10-20 | Loam | 10 | 7.1/Neutral |
| BCk | 20-30 | Loam | 10 | 7.5/Alkaline |
| Ck | 20-100 | Loam | 10 | 8.1/Alkaline |
CLI rating
| CLI subclass limitation | Rating |
|---|---|
| Subclass C – Adverse climate | 1 |
| Subclass D – Undesirable structure/low permeability | 1 |
| Subclass E – Erosion | 2 |
| Subclass F – Low natural fertility | 1 |
| Subclass M – Moisture Deficiency | 1 |
| Subclass R – Consolidated bedrock | 1 |
| Subclass W – Excess water | 1 |
| Subclass I – Inundation by streams or lakes | 1 |
| Subclass P – Stoniness | 2 |
| Subclass T – Topography | 4 |
| Final CLI Rating | 4T |
Kars soil series
| Location | Address |
|---|---|
| Name of individual completing the rating | John Smith |
| Date of rating (YYYY-MM-DD) | 1998-10-10 |
| Lot, concession, township | Lot 21 Conc 3 Gloucester |
| Latitude, longitude | 45.29546 -75.62357 |
| Soil characteristic | Measurement |
|---|---|
| Crop heat units | 2700-2900 |
| Slope steepness (%) | 4 |
| Slope length (metres) | 40 |
| Surface stoniness (%) | 1 |
| Flooding duration and frequency | N/A |
| Depth to bedrock (metres) | >1 |
| Drainage class | Rapid |
| Erosion | None |
| Horizon | Depth (centimetres) | Texture | Gravel (%) | pH/reaction |
|---|---|---|---|---|
| Ap | 0-22 | Gravelly coarse sandy loam | 37 | 7.5/alkaline |
| Bt | 22-35 | Gravelly coarse sandy loam | 27 | 7.3/neutral |
| Bm | 35-57 | Gravelly loamy coarse sand | 40 | 7.3/neutral |
| Ck | 57-110 | Very gravelly coarse sand | 80 | 7.5/alkaline |
CLI rating
| CLI subclass limitation | Rating |
|---|---|
| Subclass C – Adverse climate | 1 |
| Subclass D – Undesirable structure/low permeability | 1 |
| Subclass E – Erosion | 1 |
| Subclass F – Low natural fertility | 4 |
| Subclass M – Moisture Deficiency | 4 |
| Subclass R – Consolidated bedrock | 1 |
| Subclass W – Excess water | 1 |
| Subclass I – Inundation by streams or lakes | 1 |
| Subclass P – Stoniness | 2 |
| Subclass T – Topography | 2 |
| Final CLI Rating | 4FM |
Fox series
| Location | Address |
|---|---|
| Name of individual completing the rating | John Smith |
| Date of rating (YYYY-MM-DD) | 2003-06-19 |
| Lot, concession, township | Lot 20 Conc 6 Nissouri |
| Latitude, longitude | 43.14232 -81.10776 |
| Soil characteristic | Measurement |
|---|---|
| Crop heat units | 2900-3100 |
| Slope steepness (%) | 6 |
| Slope length (metres) | 100 |
| Surface stoniness (%) | 0 |
| Flooding duration and frequency | N/A |
| Depth to bedrock (metres) | >1 |
| Drainage class | Rapid |
| Erosion | None |
| Horizon | Depth (centimetres) | Texture | Gravel (%) | pH/reaction |
|---|---|---|---|---|
| Ap | 0-23 | Loamy Sand | 3 | 7.0/neutral |
| Bm | 23-41 | Loamy Sand | 4 | 6.9/neutral |
| Bt | 41-62 | Sandy Loam | 8 | 6.6/neutral |
| Ck | 62-100 | Sand | 4 | 7.4/neutral |
CLI rating
| CLI subclass limitation | Rating |
|---|---|
| Subclass C – Adverse climate | 1 |
| Subclass D – Undesirable structure/low permeability | 1 |
| Subclass E – Erosion | 1 |
| Subclass F – Low natural fertility | 2 |
| Subclass M – Moisture Deficiency | 2 |
| Subclass R – Consolidated bedrock | 1 |
| Subclass W – Excess water | 1 |
| Subclass I – Inundation by streams or lakes | 1 |
| Subclass P – Stoniness | 1 |
| Subclass T – Topography | 2 |
| Final CLI Rating | 2ST |
Glossary
- Ap horizon
- The surface horizon of a mineral soil where organic matter has accumulated, and then been disturbed by clearing and cultivation (plough layer).
- B horizon
- A weathered soil horizon of a mineral soil beneath the A horizon and characterized by one or more of the following:
- enrichment in silicate clay, iron, aluminum or organic matter
- alteration by hydrolysis, oxidation or reduction to give a change in colour, structure or both from the horizons above or below
- Bt horizon
- B horizon characterized by enrichment of silicate clay as indicated by a higher clay content than the eluviated soil layer above it.
- Calcareous soil
- A soil containing sufficient calcium carbonate and magnesium carbonate to effervesce carbon dioxide when treated with 10% hydrochloric acid.
- Cation exchange capacity
- The total amount of exchangeable cations that a soil can absorb.
- Ck horizon
- C horizon comprising relatively unweathered parent material containing calcium carbonate and magnesium carbonate that is easily detectable with 10% hydrochloric acid.
- Coarse fragments
- Mineral particles which are greater than 2.0 millimetres in diameter. Includes gravel, cobbles and boulders.
- Crop heat units (CHUs)
- Values which provide an index of the average total climatic heat energy available for the growth and maturity of warm season crops.
- Eolian
- Sediments transported and deposited by wind.
- Erosion
- The wearing away of the land surface by running water, wind, ice or other geological agents, such as gravitational creep.
- Field capacity
- The amount of water remaining in a soil that has been saturated and then allowed to freely drain.
- Floodplain
- Nearly level land situated on either or both sides of a channel that is subject to overflow flooding; flood prone alluvial areas adjoining inland or coastal waters; floodprone areas of islands.
- Gully
- A channel which has been caused by erosion due to the convergent flow of heavy water runoff and which interferes with machinery operation.
- Igneous rock
- Rock formed by the cooling and solidification of magma. In the Canadian Shield, such rock is usually high in silica, resistant to weathering and acidity.
- Marsh
- Continuously inundated wetland areas supporting hydrophytic vegetation; can include shallow standing water (<0.5 metre depth).
- Metamorphic rock
- Rock derived from pre-existing rocks, but differing from them in physical, chemical and mineralogical properties as a result of natural geological processes, principally heat and pressure, originating within the earth.
- Mineral soil
- A soil consisting predominantly of, and having its properties determined predominantly by mineral matter (sand, silt, clay and coarse fragments). Horizons must contain <30% organic matter by dry weight, with the exception of the surface layer which may exceed 30%, if it is <40 centimetres thick and comprised of moderately to well (mesic or humic) decomposed peat, or <60 centimetres thick and comprised of fibric peat.
- Organic soil
- A soil composed primarily of decomposed or partly decomposed plant and animal materials. As such, it contains >30% organic matter by dry weight. The total depth of the organic material must exceed 40 centimetres if the soil is moderately to well decomposed (mesic or humic), or >60 centimetres if the material is poorly decomposed (fibric).
- Pedology
- The aspects of soil science dealing with the genesis, distribution, mapping, taxonomy and interpretation of soils.
- pH
- A measure of the acidity or hydrogen ion activity of a soil. It is used as an indicator of the acidity or alkalinity of soils. The pH of Ontario soils ranges from extremely acid to moderately alkaline (pH range 4.0 to 8.0).
- Porosity
- The percent volume of the total bulk soil that is not occupied by solid particles.
- Rill
- A small intermittent water course only a few centimetres wide. Rills do not interfere with tillage or other machinery.
- Sedimentary rock
- Rock formed by the lithification of mechanical, chemical or organic sediments. The principal sedimentary rocks are sandstones, shales, limestones and conglomerates.
- Soil classification
- The systematic arrangement of soils into categories on the basis of their characteristics. Broad groupings are made on the basis of general characteristics, and subdivisions on the basis of more detailed differences in specific properties.
- Soil drainage
- As a description of the natural condition of the soil, soil drainage refers to the frequency and duration of periods during which the soil is free of saturation. In a well-drained soil, excess water (gravitational water) is removed readily but not rapidly. By contrast, in a poorly drained soil, the root zone is saturated for long periods unless it is artificially drained. In a very rapidly drained soil, water is removed very rapidly in relation to supply and most crop plants suffer from lack of water.
- Soil fertility
- The status of a soil in the relation to the amount and availability to plants of elements necessary for plant growth.
- Soil horizon
- A distinct layer of soil, approximately parallel to the ground surface, within a soil profile. It differs from adjacent genetically related layers in properties such as:
- colour
- structure
- texture
- consistence
- chemical composition
- biological composition
- mineralogical composition
- Soil map unit
- A kind of soil, or a combination of kinds of soils that can be shown as a delineation or polygon on a soil map.
- Soil morphology
- The physical constitution of a soil exhibited by the kinds, thicknesses and arrangements of the soil horizons comprising the soil profile.
- Soil organic matter
- The organic fraction of the soil which includes plant and animal residues at various stages of decomposition. Expressed as a percentage of dry soil weight.
- Soil pedon
- The basic soil profile sampling, description and classification unit at a representative site in a soil landscape. A soil pedon can be classified by soil series plus any applicable phases.
- Soil permeability
- The ease with which gases or liquids penetrate or pass through the soil.
- Soil profile
- A vertical section of the soil through all its horizons and extending into the parent material.
- Soil reaction
- The degree of acidity or alkalinity of a soil usually expressed as a pH value.
- Soil structure
- The aggregation and arrangement of primary soil particles (sand, silt, clay, organic matter) into discrete soil peds or aggregates.
- Soil texture
- The relative proportions by weight of the various particle size fractions in the mineral fraction of the soil (sand, silt, clay), as described by the soil texture classes. The sand fraction is further subdivided into coarse sand, sand, fine sand and very fine sand, based on the proportions of various sand sizes within the sand fraction. Therefore, loamy sand textures can be more precisely described as loamy coarse sand, loamy sand, loamy fine sand and loamy very fine sand, as the case may be. Likewise, the sandy loam textures can be classified as coarse sandy loam, sandy loam, fine sandy loam, and very fine sandy loam. When the gravel percentage present is between 20 and 50% by weight (equates to approximately 15 to 35% gravel by volume) the texture class is gravelly for example, gravelly sandy loam, gravelly loam). When the gravel fraction exceeds 50% (>35% volume), a very gravelly descriptor is used (for example very gravelly sandy loam, very gravelly sand).
References
ARDA, 1965, Canada Land Inventory, Soil Capability Classification for Agriculture. Report No. 2. Dept. of Forestry and Rural Development.
ARDA, 1971 The Assessment of Soil Productivity for Agriculture. Canada Land Inventory Report No. 4.
ARDA, 1975, Acreages of Soil Capability Classes for Agriculture in Ontario. Canada Land Inventory Report No. 8.
Aspinall, J.D. and G.A. Kachinoski. 1993. Tillage 2000 Final Report. Ontario Ministry of Agriculture and Food, Ontario Soil and Crop Improvement Association and University of Guelph.
Battiston, L.A., M.H. Miller, I.J. Shelton. 1987. Soil erosion and corn yield in Ontario, Field Evaluation.Can. J. of Soil Sci. 67:731-745.
Barbour, M. G., J. H. Burk, W. D. Pitts, F. S. Gilliam and M. W. Schwartz. Terrestrial Plant Ecology. 3rdEdition. Addison Wesley Longman, Inc.
Brady, N. C., and R. R. Weil. The Nature and Properties of Soils. Twelfth Edition. Prentice-Hall.
Brown, D. M., and A. Bootsma, 1993 Crop Heat Units for Corn and Other Warm-Season Crops in Ontario, Ontario Ministry of Agriculture and Food AGDEX 111/31.
Brown, D. M., G. A. McKay, L. J. Chapman. 1968. The climate of southern Ontario. Climatological Studies No. 5, Meteorological Branch, Ontario Department of Transport.
Canada Department of Agriculture, Environment Canada, 1967-74, Soil Capability for Agriculture Map Series; Scale 1:250,000
Expert Committee on Soil Survey. 1981. A Soil Mapping System for Canada: Revised. Research Branch, Agriculture Canada.
Expert Committee on Soil Survey. 1983. The Canada Soil Information System (CanSIS) Manual for Describing Soils in the Field, J. H. Day Ed. Land Resource Research Institute, Agriculture Canada, Ottawa.
Lee, H. T., W. T. Bakowsky, J. Riley, J. Bowles, M. Puddister, P. Uhlig and S. McMurray. 1998. Ecological Land Classification for Southern Ontario First Approximation and Its Application. Ontario Ministry of Natural Resources, Science Development and Transfer Branch.
Hoffman, D. W. ,and C. J. Acton. 1974 The Soils of Northumberland County. Report No. 42, Ontario Soil Survey. Research Branch, Agriculture Canada and Ontario Agricultural College.
Hoffman, D. W. and Anderson. 1971. The assessment of productivity for agriculture. Canada Land Inventory Report No. 4.
Hohner, B. K., and E. W. Presant. 1985. Seasonal Fluctuations of Apparent Water Tables in the Regional Municipalities of Niagara and Haldimand-Norfolk 1978-1984, Publication No. 85-6. Ontario Institute of Pedology, Guelph.
Kingston, M. S. and E. W. Presant. 1989. The Soils of the Regional Municipality of Niagara, Vol. 1. Report No. 60. Ontario Institute of Pedology.
Leeson B. 1969. An Organic Soil Classification for Agriculture and a Study of the Organic Soils of Simcoe County. Dept. of Soil Science, University of Guelph.
Mathur, S. P., and M. P. Levesque. 1987. A Revised Capability Rating Scheme for Organic Soils in Canada. Centre for Land and Biological Resources Research, Research Branch, Agriculture Canada, Ottawa.
McBride, R. A. and E. E. Mackintosh. 1984. Soil survey interpretations from water retention data: I. Development and validation of a water retention model. Soil Sci. Soc. Am. J. 48:1338-1343.
McBride, R. A. and E. E. Mackintosh. 1984. Soil survey interpretations from water retention data: II. Assessment of soil capability ratings and crop performance indicies. Soil Sci. Soc. Am. J. 48:1343-1350.
Ontario Centre for Soil Resource Evaluation. 1993. Field Manual for Describing Soils in Ontario. 4thedition. Compiled by K. A. Denholm and L. W. Schut.
Ontario Ministry of Agriculture and Food. 1978. The Provincial Foodland Guidelines. Foodland Development Branch, OMAF.
Ontario Ministry of Agriculture, Food and Rural Affairs. 2002. Field Crop Recommendations. Publication No. 296.
Ontario Ministry of Agriculture, Food and Rural Affairs, The Fertilizer Institute of Ontario. 1998. Soil Fertility Handbook. Publication No. 611.
Ontario Ministry of Agriculture, Food and Rural Affairs, Drainage Guide for Ontario, Publication 29
Ontario Ministry of Agriculture, Food and Rural Affairs, Agriculture and Agri-Food Canada, 1991, Best Management Practices, Field Crops.
Ontario Ministry of Municipal Affairs and Housing. 1997 Provincial Policy Statement
Presant, E.W., M.A. Brokx, F.G. Burrows. 1989. Revised Site Determination of Soil Capability for General Field Crops in the Regional Municipalities of Haldimand-Norfolk and Niagara. Ontario Institute of Pedology.
Presant, E. W., and C. J. Acton. 1984. The Soils of the Regional Municipality of Haldimand-Norfolk.Report No. 57, Ontario Institute of Pedology.
Research Branch, Agriculture Canada.1976. Glossary of Terms in Soil Science. Publication 1459. Agriculture Canada, Ottawa.
Soil Classification Working Group, 1998, Canadian System of Soil Classification. Agriculture and Agri-Food Canada.
Soil Conservation Society of America. 1982. Resource Conservation Glossary. 3rd Edition.
Wall, G. J., J. W. Greuel and I. J. Shelton. 1984. Soil Interpretations for Water Erosion. In " Soils of the Regional Municipality of Haldimand-Norfolk." Report No. 57. Ontario Institute of Pedology.
Wischmeier, W. H., and D. D. Smith. 1978. Predicting rainfall erosion losses – a guide to conservation planning. Agriculture Handbook No. 537. USDA.
Footnotes
- footnote[1] Back to paragraph Agricultural and Rural Development Act, 1965, Canada Land Inventory, Soil Capability Classification for Agriculture. Report No. 2. Department of Forestry and Rural Development.
- footnote[2] Back to paragraph McBride, R.A. and E.E. Mackintosh. 1984. Soil survey interpretations from water retention data: I. Development and validation of a water retention model. Soil Sci. Soc. Am. J. 48: 1338-1343.
- footnote[3] Back to paragraph Clay content of sandy clay loam can be as low as 20%.
- footnote[4] Back to paragraph Recreated from Brown, D. M., and A. Bootsma, 1993 Crop Heat Units for Corn and Other Warm-Season Crops in Ontario, Ontario Ministry of Agriculture and Food AGDEX 111/31.
- footnote[5] Back to paragraph Bt horizon is fairly continuous with average thickness at least 10 centimetres.
- footnote[6] Back to paragraph Materials extending from surface to depth indicated.
- footnote[7] Back to paragraph Remaining materials within 100 centimetres of surface.
- footnote[8] Back to paragraph Bt horizon fairly continuous with average depth at least 10 centimetres.
- footnote[9] Back to paragraph S = simple slopes, generally >50 metres in length
- footnote[10] Back to paragraph C = complex slopes, generally <50 metres in length