Status of Tier 1 and Tier 2 chemicals in the Great Lakes basin under the Canada-Ontario Agreement
Find information on Tier 1 and 2 chemicals in the Great Lakes Basin related to their use, release and concentrations in ambient air, surface water, sediment, fish and Herring Gull eggs. A summary of current and past risk management actions, research, monitoring and surveillance activities for these chemicals is included.
Overview
The status of Tier 1 and Tier 2 chemicals in the Great Lakes Basin under the Canada-Ontario Agreement provides information on the current trends of the chemical in the Great Lakes Basin over time, related to its use, release and environmental concentrations in ambient air, surface water, sediment, fish and Herring Gull eggs. A summary of current and past risk management actions, research, monitoring and surveillance activities for these chemicals that the Ontario provincial government and the Canadian federal government have undertaken is also provided.
Abbreviations and acronyms in this report
- AOC
- Area of Concern
- ATSDR
- Agency for Toxic Substances and Disease Registry
- BC MOE
- British Columbia Ministry of the Environment
- BPAC
- Binational Public Advisory Council
- CCME
- Canadian Council of Ministers of the Environment
- CEC
- Commission for Environmental Cooperation
- CEQGs
- Canadian Environmental Quality Guidelines
- CIELAP
- Canadian Institute for Environmental Law and Policy
- COA
- Canada-Ontario Agreement on Great Lakes Water Quality and Ecosystem Health
- CWQG
- Canadian Water Quality Guidelines
- DDE
- A breakdown product of DDT
- DWSP
- Drinking Water Surveillance Program
- EC
- Environment Canada
- ECCC
- Environment and Climate Change Canada
- ECHA
- European Chemicals Agency
- FAO/UNEP
- Food and Agriculture Organization of the United Nations/United Nations Environment Program
- GC
- Government of Canada
- GC/EC/HC
- Government of Canada/Environment Canada/Health Canada
- GLBTS
- Great Lakes Binational Toxics Strategy
- GLWQA
- Great Lakes Water Quality Agreement
- IADN
- Integrated Atmospheric Deposition Network
- IARC
- International Agency for Research on Cancer
- IARC MWG
- International Agency for Research on Cancer Monograph Working Group
- ISQG
- Interim Sediment Quality Guidelines
- IJC
- International Joint Commission
- LAMP
- Lakewide Action and Management Plan
- LEL
- Lowest Effect Level
- MOE
- Ontario Ministry of the Environment
- MOEE
- Ontario Ministry of the Environment and Energy
- MOJ
- Minister of Justice
- NADP
- National Atmospheric Deposition Program
- NAPS
- National Air Pollution Surveillance Program/Network
- NASCAR
- National Association for Stock Car Automobile Racing
- NCBI
- National Center for Biotechnology Information
- NEI
- National Emissions Inventory
- NPRI
- National Pollutant Release Inventory
- OMOECC
- Ontario Ministry of the Environment and Climate Change
- OTS
- Ontario Tire Stewardship
- PEC
- Probable Effect Concentration
- PEL
- Probable Effect Level
- PMA
- Polyurethane Manufacturing Association
- PMRA
- Pest Management Regulatory Agency
- POPs
- Persistent Organic Pollutants
- PWQOs
- Provincial Water Quality Objectives
- RAP
- Remedial Action Plan
- SEL
- Severe Effect Level
- SIDS
- Screening Information Dataset
- SOLEC
- State of the Lakes Ecosystem Committee
- TEF
- Toxic Equivalency Factor
- TEQ
- Toxic Equivalencies
- UNECE
- United Nations Economic Commission for Europe
- UNEP
- United Nations Environment Programme
- U.S. EPA
- United States Environmental Protection Agency
- WHO
- World Health Organization
Words and terms
Words and terms: A–L
- Ambient Air
- Open air that is not enclosed within a building, chimney or other structure.
- Ambient Air Quality Criteria
- A desirable concentration of a contaminant in air, based on protection against adverse effects on health or the environment. The term “ambient” is used to reflect general air quality independent of location or source of a contaminant
- Annex
- Appendices that identify commitments for action set out by the Canada-Ontario Agreement that focus on environmental issues that will benefit from cooperative and coordinated actions between the governments of Canada and Ontario.
- Anthropogenic
- Resulting from human activity (e.g., anthropogenic sources of anthracene).
- Area of Concern
- An identified location within the Great Lakes where environmental quality has been degraded compared to other areas in the Great Lakes, and beneficial uses of the aquatic ecosystems are impaired.
- Basel Convention on the Control of Transboundary Movements of Hazardous Waste and their Disposal (the Basel Convention)
- An international agreement, with provisions, that focus on the reduction of hazardous waste generation and the promotion of environmentally sound management of hazardous wastes, regardless of the place of disposal.
- Beneficial Use Impairment
- A change in the chemical, physical or biological integrity of a Great Lakes system sufficient to cause any of the 14 use impairments identified in Annex 2 of the Great Lakes Water Quality Agreement. Examples include: restrictions on fish and wildlife consumption and fish tumours or other deformities.
- Benthic
- Relating to or occurring at the bottom of a body of water.
- Bioaccumulative
- A property of a substance describing the potential for that substance to build up (accumulate) in an organism to concentrations higher than in the surrounding environment.
- Canada-Ontario Agreement Respecting the Great Lakes Basin Ecosystem (COA)
- An agreement between the governments of Canada and Ontario to restore, protect and conserve the Great Lakes Basin Ecosystem in order to achieve the vision of a healthy, prosperous and sustainable Great Lakes Basin ecosystem for current and future generations. The first COA was signed in 1971, and there have since been several renewals and revisions (1976, 1982, 1985, 1991, 1994, 2002 and 2007). A new agreement came into force in 2014 (COA, 2014), which builds on the actions taken under previous COAs (COA, 2007).
- The Canadian Environmental Protection Act, 1999 (CEPA, 1999)
- Within the federal government, CEPA, 1999 is the primary element of the framework for preventing pollution and protecting the environment and human health. The goal of CEPA, 1999 is to contribute to sustainable development, which meets the needs of the present generation without compromising the ability of future generations to meet their own needs.
- Carcinogen
- A substance that can cause cancer.
- Chemicals Management Plan
- A Government of Canada initiative, launched in 2006, aimed at reducing the risks posed by chemicals to human health and the environment.
- Clean Air Act (CAA)
- A United States (U.S.) federal law with a focus on reducing air pollution.
- Commission for Environmental Cooperation (CEC)
- An organization formed by the Canadian, American and Mexican governments, after the North American Free Trade Agreement (NAFTA) came into force, to protect North America’s environment by addressing environmental issues of continental concern.
- Convention on Long-range Transboundary Air Pollution
- An international agreement under which its Parties endeavour to limit and, as far as possible, gradually reduce and prevent air pollution, including long-range transboundary air pollution.
- Critical Pollutants
- Substances, identified under one or more Lakewide Action and Management Plans (LAMPs), which persist, singly or in combination with other substances, at levels that impair beneficial uses of the Great Lakes.
- Discharge
- Release of a substance directly or indirectly into a water body.
- Deposition
- The ability of chemicals to bind to small particles in the air and be deposited on land.
- Emission
- Release of a substance directly or indirectly into air.
- Great Lakes Basin
- The five Great Lakes and the surrounding lands and waters that drain into the Great Lakes.
- Great Lakes Binational Toxics Strategy (GLBTS)
- A document signed in 1997 by Environment Canada and the United States Environmental Protection Agency (U.S. EPA) that established challenge goals for Canada and the United States for Level 1 persistent toxic substances (identical to Tier 1 chemicals under COA), and targeted a list of Level 2 substances (that includes all Tier 2 chemicals under COA) for pollution prevention measures.
- Great Lakes States
- The eight American states that surround the Great Lakes: New York, Pennsylvania, Ohio, Michigan, Indiana, Illinois, Wisconsin and Minnesota.
- Great Lakes Water Quality Agreement (GLWQA)
- First signed in 1972, and amended in 1983, 1987 and 2012, the GLWQA is an agreement between Canada and the United States that identifies mutual priorities and coordinating actions to restore and protect the chemical, physical and biological integrity of the Great Lakes.
- Harmful Pollutants
- Substances having a deleterious (adverse) impact on environmental or human health. Chemicals on the Tier 1 and Tier 2 lists, substances of emerging concern and Criteria Air Pollutants are examples of harmful pollutants.
- Incomplete Burning/Combustion
- The burning of organic material with inadequate amounts of oxygen, resulting in the release of harmful chemical substances.
- Integrated Atmospheric Deposition Network (IADN)
- A cooperative program between Canada and the U.S. to monitor the atmospheric deposition of harmful substances into the Great Lakes Basin.
- International Joint Commission (IJC)
- An independent body of government-appointed commissioners that prevents and resolves disputes between Canada and the U.S. under the 1909 Boundary Waters Treaty Act and pursues the common good of both countries as an independent and objective advisor to the two governments on issues related to boundary and transboundary waters, including the Great Lakes.
- Lake Superior Binational Program
- A cooperative program between Canada and the U.S. to restore and protect the Lake Superior Basin.
- Lakewide Action and Management Plan (LAMP)
- A cooperative action plan between Canada and the U.S. that focuses on restoring and protecting the ecosystem of a specific Great Lake.
- Long-range Transport
- Movement of air pollutants in the atmosphere over large distances.
Words and terms M–Z
- Mercury Deposition Network (MDN)
- The MDN is the only network providing a long-term record of total mercury (Hg) concentration and deposition in precipitation in the United States and Canada.
- Minamata Convention on Mercury
- A global treaty to protect human health and the environment from the adverse effects of mercury.
- Ministry
- Ontario Ministry of the Environment and Climate Change.
- National Air Pollution Surveillance Program/Network (NAPS)
- A joint program between federal and provincial governments in monitoring and assessing ambient air quality in urban areas within Canada.
- National Emissions Inventory (NEI)
- A U.S. EPA tool and database documenting estimates of air emissions of both Criteria Air Pollutants and Hazardous Air Pollutants from all air emission sources in the U.S.
- National Pollutant Release Inventory (NPRI)
- A database documenting estimates of pollutants released from facility sources into the air, water and land in Canada.
- Non-point Source
- Diffuse sources of pollution, including atmospheric deposition, and urban and rural runoff.
- Ontario Toxics Reduction Act, 2009
- A provincial law that aims to protect human health and the environment through the reduction of the use and creation of prescribed toxic substances.
- The Pest Control Products Act (PCPA)
- A Canadian law that stringently regulates pesticides to ensure they pose minimal risk to human health and the environment. Under the authority of the PCPA, Health Canada registers pesticides after a stringent, science-based evaluation that ensures any risks are acceptable; re-evaluates the pesticides currently on the market on a 15-year cycle to ensure the products meet current scientific standards; and promotes sustainable pest management.
- Persistent
- Substances that remain in the environment for a long period and do not easily break down.
- Persistent Organic Pollutants (POPs)
- Toxic substances that remain in the environment for long periods and can accumulate up the food chain. Some of these chemicals are subject to several international agreements and protocols (e.g., the Stockholm Convention).
- Phase out
- To discontinue the use of production of a harmful substance over time.
- The Rotterdam Convention on the Prior Informed Consent Procedure for Certain Hazardous Chemicals and Pesticides in International Trade (Rotterdam Convention)
- An international agreement with the objective of promoting shared responsibility and cooperative efforts among Parties in the international trade of certain hazardous chemicals in order to protect human health and the environment from potential harm.
- The Stockholm Convention on Persistent Organic Pollutants (the Stockholm Convention)
- A global treaty to protect human health and the environment from chemicals that remain intact in the environment for long periods, become widely distributed geographically, accumulate in humans and wildlife and have harmful impacts on human health and the environment. The Stockholm Convention requires its Parties to take measures to eliminate or reduce the release of persistent organic pollutants into the environment.
- Tier 1 Chemicals
-
Chemicals that are targeted for virtual elimination, which includes 12 critical pollutants identified by the International Joint Commission, the Niagara River and Lake Ontario Toxic Management Plans and the Lake Superior Binational Program. These chemicals are: aldrin/dieldrin,* alkyl-lead,* benzo(a)pyrene, chlordane,* Dichlorodiphenyltrichloroethane (DDT),* hexachlorobenzene (HCB), mercury, mirex,* octachlorostyrene, polychlorinated biphenyls (PCBs), PCDD (dioxins), PCDF (furans), and toxaphene.*
Note: asterisk (*) denotes chemicals that are no longer being used or released in Ontario.
- Tier 2 Chemicals
- Chemicals identified as having the potential for causing widespread impacts, or that have already caused local adverse impacts on the Great Lakes Basin Ecosystem. These chemicals are: anthracene, cadmium, 1,4-dichlorobenzene, 3,3’-dichlorobenzidine, tributyltin, dinitropyrene, hexachlorocyclohexane, 4,4’-methylenebis(2-chloraniline), pentachlorophenol, plus 17 polycyclic aromatic hydrocarbons (PAHs) as a group, including but not limited to: benzo(a)anthracene, benzo(b)fluoranthene, perylene, phenanthrene, benzo(g,h,i)perylene.
- Transboundary Movement
- The movement of hazardous chemicals from one country to another.
- Trophic Level
- The position a plant or animal occupies in a food chain.
- United States Environmental Protection Agency (U.S. EPA)
- A U.S. governmental body that aims to protect human health and the environment.
- Virtual Elimination
- No measurable release of a substance to the environment.
- Zero Discharge Demonstration Program
- A joint program between Canada and the U.S. with the goal of eliminating releases of nine toxic substances in the Lake Superior Basin. The nine chemicals are: mercury, PCBs, aldrin/dieldrin, DDT/DDE, toxaphene, dioxin, chlordane,hexachlorobenzene and octachlorostyrene.
Executive summary
Introduction
The Canada-Ontario Agreement on Great Lakes Water Quality and Ecosystem Health (COA), 2014
The Canada-Ontario Agreement on Great Lakes Water Quality and Ecosystem Health (COA), 2014 (previously the Canada-Ontario Agreement Respecting the Great Lakes Basin Ecosystem) is an agreement between the governments of Canada and Ontario to promote a healthy, prosperous and sustainable Great Lakes Basin ecosystem for current and future generations.
COA 1994 identified a group of chemicals in the Great Lakes Basin that were of concern and outlined actions to reduce and prevent releases. These chemicals were grouped into two categories: Tier 1 and Tier 2.
Tier 1 and Tier 2 chemicals
Tier 1 chemicals are:
- Persistent, bioaccumulative, toxic and of immediate environmental concern to the Great Lakes Basin
- Known to have a long history of concerns related to human and environmental health
- Included in many local, national and international risk management and monitoring programs
Tier 2 chemicals have:
- The potential to impair and cause widespread impacts in the Great Lakes Basin ecosystem
- Less information available about their persistence and toxicity in the environment and their impacts on human health
Under all subsequent COAs, the Canadian government and the Ontario government have worked collaboratively, and with other partners, to reduce the release and levels of Tier 1 and 2 chemicals in the Great Lakes Basin.
Tier 1 and Tier 2 chemical status review
As part of their collaborative work under COA, Environment and Climate Change Canada and the Ontario Ministry of the Environment and Climate Change have completed a review of the status of Tier 1 and Tier 2 chemicals. The purpose of the review was to report on past and current activities and achievements in reducing chemical concentration levels, as well as to determine present levels in the Great Lakes environment. This report presents the findings of that review.
Approach
In reviewing the status of the Tier 1 and Tier 2 chemicals, a variety of information sources were used. These included published scientific reports, and environmental monitoring and reporting data from both governments (Canadian National Pollutant Release Inventory (NPRI), the Ontario Toxic Reduction Program and the federal Chemicals Management Plan).
For each Tier 1 and Tier 2 chemical, Canadian environmental concentrations were compared to relevant existing environmental guidelines. These included:
- The Canadian Council of Ministers of the Environment (CCME) Canadian Environmental Quality Guidelines (water/sediment) (CEQGs)
- The Ontario Ministry of the Environment and Climate Change Provincial Water Quality Objectives (PWQOs)
- The fish consumption advisory benchmarks for protection of human health identified in the Ontario government’s Guide to Eating Ontario Fish.
Tier 1 and Tier 2 chemicals – What progress has been made?
For decades, Canada and Ontario have worked to reduce or eliminate the release of Tier 1 and 2 chemicals and improve the overall environmental quality of the Great Lakes. This includes activities, programs and specific initiatives delivered by partner organizations, including programs operated under the series of COAs, the Canada–United States Great Lakes Water Quality Agreement (GLWQA) and the Lakewide Action and Management Plans (LAMPs). In addition, there are international multilateral environmental agreements relevant to Tier 1 and 2 chemicals.
Municipalities, First Nations and Métis organizations, businesses, non-governmental entities and the public are also developing programs, technologies and other actions to better understand the Great Lakes ecosystem, and to restore and protect water quality and ecosystem health.
Actions and status of Tier 1 chemicals
Canada has regulated the use or production of many Tier 1 chemicals. For instance:
- Banning the pesticides aldrin/dieldrin, chlordane, DDT, mirex and toxaphene
- Banning the import, manufacture and sale of PCBs
- Regulating the storage of PCBs since 1985
- Banning the release of PCBs to the environment in 1988
- Banning the use of alkyl-lead for most uses in Canada, except for specific aircraft and race car fuels
Benzo(a)pyrene, hexachlorobenzene and dioxins/furans are not manufactured or used directly. They are released to the environment as by-products of manufacturing or other activities (e.g., incomplete burning).
Octachlorostyrene is not a commercial chemical in Canada. It most likely has entered the Great Lakes through emissions from incineration processes or industrial water effluents.
A wide range of regulatory and non-regulatory federal and provincial initiatives have led to a decrease in Canadian domestic mercury emissions by approximately 90 per cent since the 1970s. Currently, over 95 per cent of the mercury from human activity that gets deposited in Canada comes from foreign sources, notably China and the United States.
Status of Tier 1 chemical concentrations in the environment
Concentration levels of most Tier 1 chemicals have gone down over time across the Great Lakes, in water, sediment, fish and Herring Gull eggs.
- Only two chemicals have concentrations above water quality guideline levels (HCB and PCB).
- Four chemicals have concentrations in sediments that are above guideline levels: benzo(a)pyrene, chlordane (near urban areas), mercury and PCBs. Based on the environmental persistence of these chemicals, concentrations may continue to be elevated in the future.
- Fish consumption advisories still exist for select compounds in different Great Lake regions (chlordane, dioxins/furans, mercury, mirex, PCBs, and toxaphene). This is due to the persistence of these chemicals in the environment and their ability to build up in fish tissues (Table 1).
Action and status of Tier 2 chemicals
Similar to the Tier 1 chemicals, Canada has regulated the use of many Tier 2 chemicals. For instance:
- Canada banned the use of tributyltin as an anti-fouling paint for ships in 2003.
- The use of pentachlorophenol is restricted to heavy-duty wood preservation applications.
- The only non-restricted use of lindane in Canada is as a second-line treatment for head lice or scabies, and there is limited use of 4,4’-methylenebis (2-chloroaniline) (or MBOCA) in Ontario.
- Dinitropyrene is not produced for a specific purpose or use in Canada; it is a product of diesel and gasoline consumption.
Other Tier 2 chemicals continue to have commercial and industrial uses and/or releases:
- Cadmium continues to be released into the Canadian environment from metals production (particularly base-metal smelting and refining); stationary fuel combustion (power generation and heating); transportation; and solid waste disposal and sewage biosolid applications.
- 1,4-Dichlorobenzene is released to the environment from its widespread use as an industrial deodorant.
- Certain PAHs continue to be released to the environment from incomplete combustion from different manufacturing processes.
Status of Tier 2 chemical concentrations in the environment
There is limited information available on the concentrations of most Tier 2 chemicals in water, sediment or fish. Monitoring efforts completed to date tell us that concentration levels for select PAHs are above the water and sediment guidelines at locations associated with industrial emissions and, in some locations, concentration levels of cadmium are above water and sediment guidelines (Table 1).
| Chemical - Tier 1 | concentrations exceeding guidelines Water | concentrations exceeding guidelines - Sediment | concentrations exceeding guidelines - Fish |
|---|---|---|---|
| Aldrin/Dieldrin | No/No | ND/ND | No/ND |
| Alkyl-lead | ND | ND | ND |
| Benzo(a)pyrene | No | Yes | ND |
| Chlordane | No | Yes | Yes |
| DDT | No | ND | No |
| Hexachlorobenzene | Yes | ND | ND |
| Mercury | No | Yes | Yes |
| Mirex | No | ND | Yes |
| Octachlorostyrene | NG | NG | No |
| PCBs | Yes | Yes | Yes |
| Dioxins and Furans | ND | No | Yes |
| Toxaphene | ND | ND | Yes |
| Chemical - Tier 2 | concentrations exceeding guidelines Water | concentrations exceeding guidelines - Sediment | concentrations exceeding guidelines - Fish |
|---|---|---|---|
| Anthracene | Yes | Yes | ND |
| Cadmium | Yes | Yes | No |
| 1,4-Dichlorobenzene | ND | ND | ND |
| 3,3'-Dichlorobenzidine | ND | ND | ND |
| Tributyltin | ND | ND | ND |
| Dinitropyrene | No | ND | ND |
| Hexachlorocyclohexane | No | ND | NG |
| 4,4'-Methylenebis(2-chloroaniline) | ND | ND | ND |
| Pentachlorophenol | ND | ND | ND |
| PAHs | Yes | Yes | ND |
Legend:
Yes – Concentrations exceed guidelines
No – Concentrations do not exceed guidelines
NG – No guideline
ND – No Data (no available comprehensive data set)
Conclusion
The Canadian federal government and the Ontario government, with their partners, have implemented risk management, research, monitoring and surveillance programs. These have been critical to reducing concentrations of Tier 1 and 2 chemicals in the Great Lakes.
Under the 2014 COA agreement and the GLWQA, 2012, these cooperative and coordinated actions are continuing – aimed at reducing or eliminating releases of harmful pollutants, including chemicals of concern and chemicals of mutual concern, into the Great Lakes Basin.
1. Introduction
The Canada-Ontario Agreement on Great Lakes Water Quality and Ecosystem Health (COA) is an agreement between the governments of Canada and Ontario to promote a healthy, prosperous and sustainable Great Lakes Basin ecosystem for current and future generations. Since 1971, the COA has also contributed to improvements in the environmental quality of the Basin and to meeting Canada’s commitments under the Canada–United States Great Lakes Water Quality Agreement (GLWQA). The GLWQA identifies shared priorities and coordinates actions to restore and protect the chemical, physical and biological integrity of the waters of the Great Lakes.
As a part of the COA, the governments of Canada and Ontario agreed to implement Annexes that focus on issues that are a priority and would benefit from cooperative and coordinated action. This report focuses on the Harmful Pollutants Annex (Annex 2). This Annex addresses both past and ongoing sources of harmful pollutants in the Great Lakes Basin, based on the principles of pollution prevention and reduction.
What is in this report
This report summarizes the status of chemicals that were identified as being of concern (Tier 1) or of potential concern (Tier 2) in the Great Lakes Basin under previous COAs. There is a chapter for each substance. Each chapter describes the current trends of the substance in the Great Lakes Basin over time, related to its use, release and environmental concentrations in ambient air, surface water, sediment, fish and Herring Gull eggs:
- Concentrations of Tier 1 and 2 chemicals were reviewed in the Great Lakes and compared to available guidelines and/or standards. Table 2 summarizes the guidelines for water and sediment.
- Concentrations in surface water were compared to the Canadian Council of Ministers of the Environment (CCME) Canadian Environmental Quality Guidelines (CWQG) or, if not available, the Ontario Ministry of the Environment and Climate Change (OMOECC) Provincial Water Quality Objectives (PWQOs) (CCME, 1999a; MOEE, 1994).
- Concentrations in sediment were compared to the CCME Canadian Interim Sediment Quality Guidelines (ISQG) and Probable Effect Level (PEL) or, if not available, the MOE Provincial Sediment Quality Guidelines Lowest Effect Level (LEL) and Severe Effect Level (SEL) (CCME, 1999a; MOE, 2008).
| Chemical | Water - CCME CWQG | Water - MOE PWQO | Sediment - CCME ISQG/PEL | Sediment - MOE LEL/SEL |
|---|---|---|---|---|
| Aldrin/Dieldrin | 0.001 | 2.85/6.67 | ||
| Alkyl-lead | ||||
| Benzo(a)pyrene | 0.015 | |||
| Chlordane | 0.06 | 4.5/8.87 | ||
| Dioxins and Furans* | 0.00085/0.0215 | |||
| DDT | 0.003 | 1.19/4.77 | ||
| Hexachlorobenzene | 0.0065 | 20/240 | ||
| Mercury | 0.026 | 170/486 | ||
| Mirex | 0.001 | 7/1300 | ||
| Octachlorostyrene | ||||
| PCBs | 0.001 | 34.1/277 | ||
| Toxaphene | 0.008 | |||
| Anthracene | 0.012 | 46.9/245 | ||
| Cadmium | 0.09 | 600/3500 | ||
| 1,4-Dichlorobenzene | 26 | |||
| 3,3’-Dichlorobenzidine | 0.6 | |||
| Tributyltin | 0.008 | |||
| Dinitropyrene | ||||
| Hexachlorocyclohexane | 0.01 (total for all isomers) | 0.94/1.38 | ||
| 4,4’-Methylenebis (2-chloroaniline) | ||||
| Pentachlorophenol | 0.5 | |||
| PAHs | ||||
| Benzo(a)anthracene | 0.018 | 31.7/385 | ||
| Benzo(a)phenanthrene | ||||
| Benzo(b)fluoranthene | ||||
| Benzo(e)pyrene | ||||
| Benzo(g,h,i)perylene | 0.00002 | |||
| Benzo(j)fluoranthene | ||||
| Benzo(k)fluoranthene | 0.0002 | |||
| Dibenz(a,j)acridine | ||||
| Dibenzo(a,h)anthracene | 0.002 | 6.22/135 | ||
| Dibenzo(a,i)pyrene | ||||
| 7H-Dibenzo(c,g)-carbazole | ||||
| Fluoranthene | 0.04 | 111/2355 | ||
| Indeno(1,2,3-c,d)pyrene | 200/2300 | |||
| Perylene | 0.00007 | |||
| Phenanthrene | 0.4 | 41.9/515 |
All water concentrations are µg/L; all sediment concentrations are µg/kg.
* Expressed on a toxic equivalencies (TEQ) basis using toxic equivalency factors (TEFs) for fish.
SEL assumes 1 per cent organic carbon.
The review compared concentrations in fish to guidelines in the Ontario Ministry of the Environment’s Guide to Eating Ontario Fish, 2013–2014 (MOE, 2013) (Table 3).
| Chemical | No Restriction | Lowest Restriction Level | Complete Restriction for Sensitive Populations | Complete Restriction for General Population |
|---|---|---|---|---|
| Aldrin/Dieldrin | NA | NA | NA | NA |
| Alkyl-lead | NA | NA | NA | NA |
| Anthracene | NA | NA | NA | NA |
| Benzo(a)pyrene | NA | NA | NA | NA |
| Chlordane | <0.059 | ≥0.0027 | >0.117 | 0.469 |
| Dioxins/Furans TEQ | <0.0027 | ≥0.0027 | >0.0054 | >0.0216 |
| DDT | NA | NA | NA | NA |
| Hexachlorobenzene | >0.317 | ≥0.082 | >0.634 | >2.534 |
| Mercury | <0.26 | ≥0.26 | >0.52 | >1.84 |
| Mirex | <0.082 | ≥0.082 | >0.164 | >0.657 |
| Octachlorostyrene | <0.364 | ≥0.364 | >0.727 | >2.91 |
| PCBs | <0.105 | ≥0.105 | >0.211 | >0.844 |
| Toxaphene | <0.235 | ≥0.235 | >0.469 | >1.877 |
| Cadmium | <0.35 | ≥0.35 | >0.7 | >2.8 |
| 1,4-Dichlorobenzene | NA | NA | NA | NA |
| 3,3’-Dichloro-benzidine | NA | NA | NA | NA |
| Tributyltin | NA | NA | NA | NA |
| Dinitropyrene | NA | NA | NA | NA |
| Hexachloro-cyclohexane | NA | NA | NA | NA |
| 4,4’-Methylenebis (2-chloroaniline) | NA | NA | NA | NA |
| Pentachlorophenol | NA | NA | NA | NA |
| PAHs | NA | NA | NA | NA |
Legend:
- All concentrations are mg/kg except dioxins/furans TEQ, which are in µg/kg.
- NA indicates no guideline is available, or the substance is not found at levels in fish in Ontario that require consumption restrictions.
This report also includes a summary of current and past risk management actions, research, monitoring and surveillance activities for these chemicals that the Ontario provincial government and the Canadian federal government have undertaken. Science activities provide an understanding of sources, releases and trends in environmental concentrations. Risk management actions help reduce or remove inputs of the chemicals into the environment.
- A large amount of monitoring and surveillance data has been collected and analyzed over the years. This report has graphs and maps to interpret and represent much of these data. There is technical information and terms specific to environmental quality management that may not be familiar to all readers. The Words and Terms section of this report explains them.
2. History of the Canada-Ontario Agreement and Tier 1 And 2 chemicals
The Canada-Ontario Agreement on Great Lakes Water Quality and Ecosystem Health, 2014 (COA) is an agreement between the governments of Canada and Ontario. The first COA was signed in 1971. Since then, there have since been several renewals and revisions (1976, 1982, 1985, 1991, 1994, 2002 and 2007). The most recent Canada-Ontario Agreement on the Great Lakes Water Quality and Ecosystem Health (COA, 2014) was signed on December 18, 2014. It builds on the actions taken under the previous COAs.
For over 40 years, COAs have served as the primary mechanism for ensuring the coordinated and cooperative efforts of the governments of Canada and Ontario in addressing issues of environmental restoration, protection and conservation in the Great Lakes.
Identifying Tier 1 and Tier 2 chemicals
The 1994 COA identified certain chemicals as either Tier 1 or Tier 2 (Table 4):
- Tier 1 includes the 11 critical pollutants that the International Joint Commission identified, plus critical pollutants in the Niagara River and Lake Ontario Toxic Management Plans and the Lake Superior Binational Program. Tier 1 substances impair beneficial uses of the Great Lakes. These include healthy fish and wildlife, fish that are safe to eat, and water that is safe for human recreational uses.
- Tier 2 includes chemicals identified as having the potential for causing widespread impacts or those that have already caused local adverse impacts on the Great Lakes Basin ecosystem (COA, 2007).
Tier 1 and Tier 2 chemicals
Tier 1 chemicals are:
- Persistent, bioaccumulative, toxic and of immediate environmental concern to the Great Lakes Basin
- Known to have a long history of concerns related to human and environmental health
- Included in many local, national and international risk management and monitoring programs
Tier 2 chemicals:
- Have the potential to impair and cause widespread impacts in the Great Lakes Basin ecosystem
- Have less information available about their persistence and toxicity in the environment and their impacts on human health
Under all subsequent COAs, the Canadian government and the Ontario government have worked collaboratively, and with other partners, to reduce the release and levels of Tier 1 and 2 chemicals in the Great Lakes Basin.
| Tier 1 chemicals | Tier 2 chemicals |
|---|---|
| Aldrin/Dieldrin | Anthracene |
| Alkyl-lead | Cadmium |
| Benzo(a)pyrene | 1,4-Dichlorobenzene |
| Chlordane | 3,3'-Dichlorobenzidine |
| Dichlorodiphenyltrichloroethane (DDT) | Tributyltin |
| Hexachlorobenzene | Dinitropyrene |
| Mercury | Hexachlorocyclohexane |
| Mirex | 4,4'-Methylenebis(2-chloroaniline) |
| Octachlorostyrene | Pentachlorophenol |
| Polychlorinated Biphenyls (PCBs) | Polycyclic Aromatic Hydrocarbons (PAHs) as a group (17), including Benzo(a)anthracene, Benzo(b)fluoranthene, Benzo(g,h.i)perylene, Perylene and Phenanthrene |
| Polychlorinated dibenzo-para-dioxins (Dioxins) and Polychlorinated dibenzofurans (Furans) | |
| Toxaphene |
COAs have significantly contributed to Canada meeting its commitments under the Canada–United States Great Lakes Water Quality Agreement (GLWQA), most recently amended by protocol in 2012 (Environment Canada, 2013a):
- Since 1972, the GLWQA has encouraged coordinated binational actions to restore and protect the chemical, physical and biological integrity of the Great Lakes.
In 1997, Environment Canada (EC) and the United States Environmental Protection Agency (U.S. EPA) signed the former Great Lakes Binational Toxics Strategy (GLBTS, 2004a):
- The GLBTS intent was to advance Article II (a) of the 1987 GLWQA. It established a collaborative process for EC and the U.S. EPA, in consultation with other federal departments and agencies, Great Lakes States, Ontario and Tribes and First Nations, working together in cooperation with their public and private partners (e.g., non-governmental organizations and industry).
- The goal was virtual elimination from the Great Lakes of persistent and bioaccumulative toxic substances resulting from human activity.
The GLBTS established chemical-specific challenge goals for Canada and the U.S. to reduce or eliminate the use and release of the specific persistent toxic substances to the Great Lakes ecosystem. The strategy defined these as Level I and II:
- The Level I substances corresponded to the COA Tier 1 chemicals.
- The Level II substances included all of the Tier 2 chemicals and several others (endrin; heptachlor, heptachlor epoxide; hexachlorobutadiene and hexachloro-1,3-butadiene; pentachlorobenzene; and tetrachlorobenzene [1,2,3,4- and 1,2,4,5-]).
Moving forward under a new 2014 COA agreement (COA, 2014), the purpose of Annex 2 – Harmful Pollutants is to guide cooperative and coordinated actions to reduce or eliminate releases of harmful pollutants, including chemicals of concern, into the Great Lakes Basin.
3. Banned pesticides
Five Tier 1 chemicals (aldrin/dieldrin, chlordane, DDT, mirex and toxaphene) are pesticides (insecticides) banned in the U.S. and Canada for over 20 years (Table 5).
| Pesticide | Year Banned - Canada | Year Banned - U.S. |
|---|---|---|
| Aldrin/Dieldrin | 1990 | 1989 |
| Chlordane | 1991 | 1988 |
| DDT | 1990 | 1989 |
| Mirex | Never registered for use | Late 1970s |
| Never registered for use | Mid-1980s | 1990 |
- Currently, there are no known releases of aldrin/dieldrin, mirex or toxaphene in Canada.
- DDT (Dichlorodiphenyltrichloroethane) is an impurity in dicofol, a pesticide that was widely used in the U.S. and Canada until recently (LAMP, 2000; UNECE, 2010a). Its sale and use was stopped in Canada at the end of 2011. Any existing stocks should be used by 2016. Currently, it is not manufactured or imported into Canada (UNECE, 2010a).
Pesticide trends, monitoring and levels in the Great Lakes Basin
Pesticide levels
Air and precipitation
- In general, concentrations of banned or restricted pesticides measured by the Integrated Atmospheric Deposition Network (IADN) are decreasing over time in air and precipitation.
- Higher concentrations of dieldrin, chlordane and DDT are found in urban areas than at remote stations (SOLEC, 2011).
Water
- The Canadian Council of Ministers of the Environment (CCME) has withdrawn the water quality guidelines for several compounds, including aldrin, dieldrin, chlordane, DDT, and toxaphene, since these chemicals are no longer used in Canada and are rarely detected. For aquatic organisms, sediment or diet are the primary sources of exposure to these compounds (SOLEC, 2011).
- The Ontario Ministry of the Environment and Climate Change Drinking Water Surveillance Program (DWSP) has collected and analyzed hundreds or thousands of raw water samples from the intake of drinking water treatment plants on the Great Lakes. DWSP has not detected any of the banned pesticides in any samples (communications with OMOECC staff, 2014).
Sediment
- An analysis of Environment and Climate Change Canada sediment data showed no evident point sources of dieldrin for Lakes Superior, Huron and St. Clair. This suggests atmospheric deposition and agricultural runoff as likely sources of dieldrin in these lakes (Kluke, 2011). While dieldrin may still be detected, concentrations are low and do not exceed guidelines in the majority of the Great Lakes.
- Chlordane has been detected in sediment above the Probable Effect Concentration (PEC) of 17.6 µg/kg near all major urban areas in Lake Erie (LAMP, 2004). Concentrations in sediment have decreased by between 42 per cent (Lake Erie) and 93 per cent (Lake Huron) from 1970 to 2010. The concentrations are generally below guidelines (SOLEC, 2011).
- Certain areas within the Basin continue to be affected by historical point source contamination from DDT. The Ontario Ministry of the Environment and Climate Change has initiated a track down effort to determine the source of DDT in the Niagara River.
- In 1998, a Lake Ontario sediment survey found frequent detection of mirex, with a lakewide average concentration of 6.6 ng/g. This represents an 80 per cent reduction from the average measured in 1981 (Marvin et al., 2003). The average concentration exceeds the Ontario sediment guidelines (PEL = 1.3 ng/g assuming 1 per cent organic carbon in sediment).
Fish
Concentrations of pesticide levels in fish are decreasing across the Great Lakes Basin by 2 to 18 per cent each year (SOLEC, 2011):
- The State of the Lakes Ecosystem Committee (SOLEC) will no longer report on the concentrations of aldrin and dieldrin in whole fish. The reason is that the Lakes Water Quality Agreement (GLWQA) does not identify target concentrations for the protection of fish-eating wildlife (SOLEC, 2011).
- Concentrations of aldrin in fish were detected in only four of over 20,000 samples.
- There was no analysis of fish for dieldrin (Ontario Ministry of the Environment and Climate Change data).
- There are no target concentrations for aldrin and dieldrin for the protection of fish-eating wildlife in the GLWQA (SOLEC, 2011).
- There’s been a consistent decrease in concentrations of chlordane in whole Lake Trout and Walleye since banning of the chemical. Concentrations in fish show a steady state, with no increases or decreases in recent years. SOLEC will no longer report on the concentrations of chlordane in whole fish. There are no target concentrations for chlordane for the protection of fish-eating wildlife in the GLWQA (SOLEC, 2011).
Across the Great Lakes Basin, concentrations of DDT in top predator fish are below the target of 1.0 mg/kg (wet weight) identified in the previous GLWQA (SOLEC, 2011). There are no fish consumption advisories for DDT in any of the Great Lakes (SOLEC, 2011; MOE, 2013).
There are still mirex fish advisories for Lake Ontario. However, they are generally associated with historical releases near the Niagara River. There have been few exceedances in Canadian waters in recent years.
Toxaphene concentrations in fish have declined from 1977 to 2009. Currently, the only fish consumption advisory is for Lake Superior (SOLEC, 2011). The assumption is that concentrations of toxaphene in top predator fish are atmospherically driven (GLBTS, 2009).
Herring Gull eggs
- There has been monitoring of dieldrin, DDE (a breakdown product of DDT), chlordane and mirex concentrations in Herring Gull eggs since 1974 for Lake Superior, Lake Huron, Lake Erie and Lake Ontario, and for Lake Michigan since 1977 (Weseloh et al., 2010).
- Between 1974 and 2007, concentrations of dieldrin decreased in Lakes Superior, Michigan, Huron, Ontario and Erie from 94 to 99 per cent.
- Between 1974 and 2007, concentrations of DDE decreased up to 99 per cent.
- Between 1974/1977 and 2007, concentrations of mirex decreased up to 99 per cent.
- Between 1971 and 2013, on average, the concentration of chlordane has decreased up to 73 per cent (de Solla et al., submitted).
Tools and tactics for reducing banned pesticides in the environment
A number of regulatory and non-regulatory initiatives have been undertaken to reduce concentration levels of banned pesticides in the Great Lakes.
Legislation and regulations
- In Canada, the use, manufacture, sale and offer for sale of aldrin, dieldrin, chlordane, DDT, mirex and toxaphene are prohibited under the Pest Control Products Act, which is administered by the Pest Management Regulatory Agency of Health Canada (PMRA, 1999).
- DDT and mirex are on the Toxic Substances List – Schedule 1, of the Canadian Environmental Protection Act, 1999. They are subject to the Act’s Prohibition of Certain Toxic Substances Regulations, 2012.
Programs
- Ontario has a waste/obsolete pesticide collection program operated by CleanFARMS. It provides Ontario farmers with the opportunity to dispose of unwanted and obsolete pesticides and food animal medications in a safe and environmentally responsible manner, at no charge (CleanFARMS, 2014).
Agreements
Internationally, Canada is party to several multilateral environmental agreements that aim to reduce the levels of persistent toxic substances, such as the banned pesticides, in the environment. These agreements include the:
- Stockholm Convention and the Convention on Long-range Transboundary Air Pollution (UNECE, 1998; UNEP, 2009)
- Basel Convention (UNEP, 2011a)
- Rotterdam Convention (FAO/UNEP, 2013)
By supporting these conventions, Canada is helping to reduce out-of-basin sources and long range atmospheric transport and deposition of toxic substances into the Great Lakes Basin.
Summary
Following the ban of the Tier 1 pesticides, concentrations continue to decrease in all environmental compartments. However, some concerns (fish consumption and sediment guidelines exceedances) still exist in the Great Lakes, due to their persistence, cycling in the environment and long-range transport.
Tier 1 chemicals
Chapters 4 to 10 discuss Tier 1 chemicals.
4. Alkyl-lead
Alkyl-lead compounds are a group of man-made lead-based chemicals that were commonly added to vehicle fuels (U.S. EPA, 2011a). Following the combustion of alkyl-lead compounds in fuels, inorganic lead compounds are emitted in the exhaust. Inorganic lead compounds in the air are a concern for human health, since their ingestion or inhalation can potentially result in lead poisoning (U.S. EPA, 2011a).
How does alkyl-lead get into the environment?
In the Great Lakes Basin, most alkyl-lead gets into the environment through the air.
- Canada and the United States (U.S.) banned the use of alkyl-lead additives in automotive gasoline in 1990 and 1996, respectively (CCME, 1999b; ATSDR, 2007).
- Aircraft and race cars still use lead additives. Alkyl-leaded gasoline is also still commercially available in some developing countries (ATSDR, 2007).
- As a result of their small size, all lead-based chemicals emitted from in-flight aircraft can disperse widely into the environment, travelling large distances before depositing onto soil, water, vegetation, or other environmental media (U.S. EPA, 2010).
- Alkyl-lead compounds may bind to sediments, and accumulate in plants and animals, but they do not accumulate up the food chain. However, alkyl-lead in air degrades rapidly to other forms of lead (UNEP, 2008).
Emission levels specific to alkyl-lead compounds are not available from the National Pollutant Release Inventory.
Alkyl-lead trends, monitoring and levels in the Great Lakes Basin
Alkyl-lead levels
Neither Environment and Climate Change Canada nor the Ontario Ministry of the Environment and Climate Change analyze concentrations of alkyl-lead.
Tools and tactics for reducing alkyl-lead concentrations in the environment
A number of regulatory and non-regulatory initiatives have been taken to reduce alkyl-lead concentrations in the Great Lakes.
Legislation and regulations
Under the Canadian Environmental Protection Act, 1999 (CEPA, 1999), the Gasoline Regulation limits the amount of lead-additive allowed in gasoline (GC, 2010; MOJ, 2014a):
- Recent amendments to the regulation specify a maximum concentration of 5 mg/L in gasoline produced, imported or sold.
- The regulations do not apply to the gasoline for use in aircraft (MOJ, 2014a).
- Regulations on leaded gasoline have contributed to a considerable decrease in airborne lead concentrations.
Programs
The racing industry is integrated between Canada and the United States:
- There has been progress in transitioning to non-leaded fuels in the racing industry, as reflected in the partnership between the U.S. EPA and the National Association for Stock Car Automobile Racing (NASCAR) (U.S. EPA, 2002). Now, large racing associations such as NASCAR, Indy and Formula One do not use leaded gasoline.
- The International Hot Rod Association, the National Hot Rod Association, DIRTCar and the International Motor Sports Association still sanction the use of leaded gasoline (GC, 2010).
Agreements
Internationally, Canada is party to several multilateral environmental agreements that aim to reduce the levels of metals, including alkyl-lead, in the environment. These include the:
- Convention on Long-range Transboundary Air Pollution (UNECE, 1998)
- Basel Convention (UNEP, 2011a)
- Rotterdam Convention (FAO/UNEP, 2013)
By supporting these conventions, Canada is helping to reduce out-of-basin sources and long range atmospheric transport and deposition of toxic substances into the Great Lakes Basin.
Summary
Canada and the United States (U.S.) banned the use of alkyl-lead additives in automotive gasoline in 1990 and 1996, respectively. At this time there is no monitoring of alkyl-lead concentrations by either Environment and Climate Change Canada or the Ontario Ministry of the Environment and Climate Change.
5. Benzo(a)pyrene (B[a]P)
Benzo(a)pyrene (B(a)P) is a polycyclic aromatic hydrocarbon (PAH). It is a by-product of the burning of gasoline, wood and other organic materials (U.S. EPA, 2012a). In the aquatic environment, B(a)P is generally found in sediments, where it may remain for many years. However, it does not accumulate in the food chain.
B(a)P can affect human health. It may cause cancer and have other health effects in people, fish and other wildlife (GC/EC/HC, 1994).
How does benzo(a)pyrene get into the environment?
B(a)P is found in fossil fuels, crude oils, shale oils, and coal tars (NCBI, 2012a). It is not widely commercially used or produced, but it is commonly detected in the environment because it is formed from the incomplete combustion of organic materials (U.S. EPA, 2012a):
- In the early 2000s, the iron and steel industry accounted for the majority of total emissions. However, in more recent years, emissions from this industry have decreased significantly.
- Non-industrial sources of B(a)P accounted for approximately 80 per cent of the 3,900 kg emitted to air in 2011.
- Residential wood burning is the most significant non-industrial source, accounting for 3,115.6 kg of the 3,116 kg of B(a)P emitted.
B(a)P also may be released to the environment by other processes that the Environment Canada emission data does not reflect. For example, B(a)P may be released from:
- Wood treated with preservatives, such as railway ties (GLBTS, 2009) and
- Scrap tires (GLBTS, 2009)
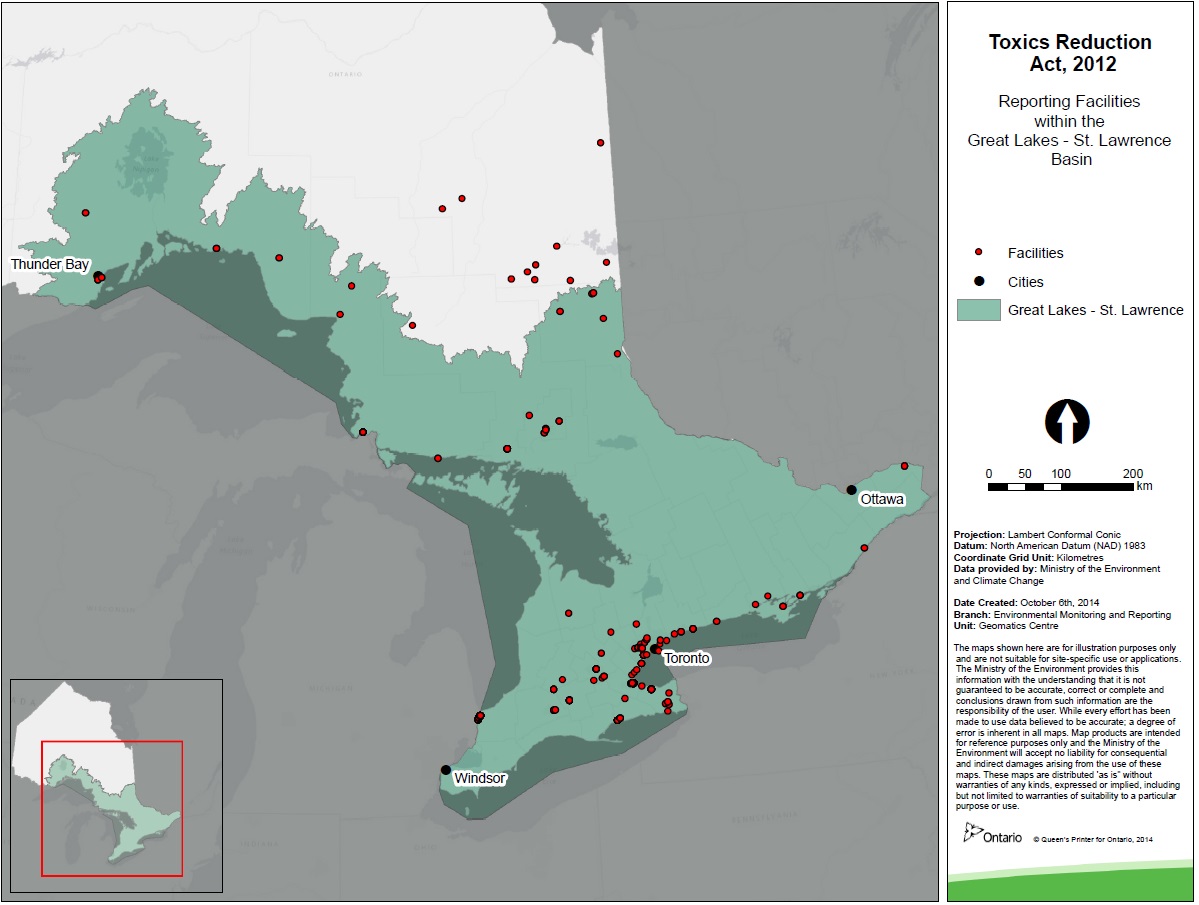
According to the reporting requirements of Ontario’s Toxics Reduction Act, in 2012 manufacturing and mineral processing facilities:
- Used approximately 1,600 tonnes of B(a)P
- Created approximately 1,513 tonnes of B(a)P
- Made products containing approximately 3,516 tonnes of B(a)P
All reporting facilities were within the Great Lakes Basin watershed (communications with OMOECC staff, 2014) (Appendix A).
B(a)P trends, monitoring and levels in the Great Lakes Basin
B(a)P levels have been decreasing. B(a)P enters the Great Lakes Basin through air, water and land:
- In 2013, the majority of emissions of B(a)P to the environment were to air (approximately 99 per cent); less than approximately 2 per cent were to water, and < 0.1 per cent to land (Environment Canada, 2013d).
- In Ontario, overall releases of B(a)P to the Great Lakes Basin have been reduced by approximately 53 per cent from 1988 to 2007 (GLBTS, 2009).
- B(a)P facility emissions in Ontario have declined by 92 per cent from 2000 to 2011 (Environment Canada, 2013d).
B(a)P levels
Air
- Concentrations of PAHs in air have been decreasing slowly (IADN, 2008; SOLEC, 2011).
- B(a)P concentrations in urban areas are significantly higher (0.05 to >0.5 ng/m3) than concentrations in rural areas (<0.005 to 0.05 ng/m3), which are near the detection limit (GLBTS, 2009).
Water
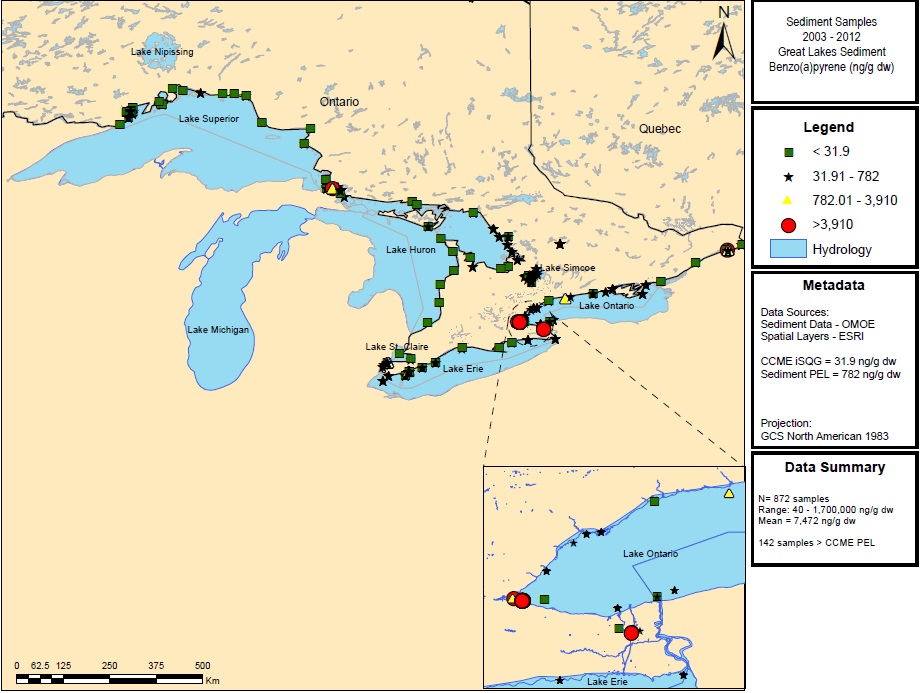
- Less than 10 per cent of the concentrations of B(a)P in bulk surface water samples (not filtered) collected between 1996 and 2006 exceeded the Canadian Council of Ministers of the Environment (CCME) Canadian Water Quality Guidelines (CWQG) of 15 ng/L (Figure 1).
- Samples exceeding the Guidelines were detected in the St. Clair River area, a noted Area of Concern under COA.
- B(a)P was detected in less than 1 per cent of raw water samples collected and analyzed under the Ontario Ministry of the Environment and Climate Change Drinking Water Surveillance Program (DWSP) from 2001 onwards (communications with OMOECC staff, 2014).
Sediment
Concentrations of B(a)P in sediment reported in the early years of COA have decreased. Figure 1 shows the most recent data (2003–2012) from the Ontario Ministry of the Environment and Climate Change:
- Most concentrations are below the Canadian Sediment Quality Guidelines Probable Effect Level (CCME, 1999a) of 782 µg/kg.
- Approximately 16 per cent of samples still have concentrations above the PEL. The exceedances are primarily associated with manufacturing (St. Clair River and Hamilton Harbour).
Figure 1: Concentrations of Benzo(a)pyrene in sediments (2003–2012). Source: Ontario Ministry of the Environment and Climate Change
Fish
- B(a)P has not been shown to accumulate in fish and, therefore, has not been measured.
Herring Gull eggs
- B(a)P has not been shown to accumulate in Herring Gull eggs and, therefore, has not been measured.
Tools and tactics for reducing benzo(a)pyrene in the environment A number of regulatory and non-regulatory initiatives have been taken to reduce benzo(a)pyrene concentration levels in the Great Lakes.
B(a)P emissions have declined in recent years in Ontario due to risk management of relevant industrial sectors (e.g., iron and steel) and the closing of several large facilities.
Legislation and regulations
Benzo(a)pyrene and other PAHs are on the Toxic Substances List – Schedule 1 of the Canadian Environmental Protection Act, 1999. Under the Act, a number of national risk management tools have been developed and implemented to reduce anthropogenic PAH releases, including:
- Environmental performance agreements
- Environmental codes of practice
- Design guidelines
Ontario’s Toxics Reduction Act, 2009 and its regulation require Ontario manufacturing and mineral processing facilities that meet defined thresholds to:
- Undertake yearly toxic substance accounting and reporting.
- Look for opportunities to reduce the use and creation of prescribed toxic substances by developing reduction plans.
- Make summaries of their reduction plans available to the public.
Implementation of reduction plans is voluntary.
B(a)P is on the list of prescribed toxic substances.
Programs
- Residential wood burning accounts for 29 per cent of releases in Ontario and over 30 per cent of B(a)P emissions from the eight U.S. Great Lakes States. Both the U.S. and Canada made it a priority to address the issue of pollution resulting from wood burning by implementing residential wood combustion outreach and education programs (e.g., the “Burn It Smart!” campaign). International agreements also support this priority (UNECE, 2009a).
- Launched in 2009, the Ontario Tire Stewardship (OTS) Program eliminated the disposal fee that consumers paid to dispose of their old tires and encouraged people to drop off their old tires for recycling (GLBTS, 2009). As of April 2014, 60 million tires have been recycled under this program (OTS, 2014).
Remedial action plans
Point sources of B(a)P and other PAHs in the Great Lakes environment, specifically PAH contaminated sediments, also are being managed through site-specific remediation activities. Remedial Action Plans for Areas of Concern (AOCs) and Lakewide Action and Management Plans (LAMPs) include activities to address PAH contamination in each of the Great Lakes. These are summarized in Chapter 20 of this report, which discusses PAHs.
Summary
From a baseline set in 1988, Canada has reduced B(a)P emissions to the Great Lakes Basin by approximately 53 per cent as of 2007 (the latest year for which data were available) (GLBTS, 2009). Based on a review of updated monitoring data, B(a)P is found predominantly in sediments of the Great Lakes. Elevated concentrations primarily relate to iron and steel manufacturing locations, and inputs from air due to residential wood burning.
6. Polychlorinated dibenzo-p-Dioxins and dibenzo-p-Furans
Polychlorinated dibenzo-p-dioxins (dioxins) and dibenzo-p-furans (furans) are a group of chemicals with a similar structure containing varying amounts of chlorine. Once they are released into the aquatic environment, they do not break down easily. Consequently, they can persist for several years and be transported long distances. Dioxins and furans are known to accumulate in sediment and living organisms, particularly fish (ATSDR, 1998a). These chemicals are of concern because they may cause cancer and other health effects in people, fish and wildlife (ATSDR, 1998a; U.S. EPA, 2011b).
There are many kinds of dioxins and furans with varying hazard levels. Therefore, their emissions are measured on the basis of their “toxic equivalency” (TEQ) (U.S. EPA, 2014). The toxicity of each dioxin or furan is related to that of 2,3,7,8-tetrachlorodibenzo-p-dioxin by using a toxic equivalency factor (TEF). In this way, it’s possible to combine all of the measured dioxins and furans into a single measurement for comparison to the guidelines: the dioxin and furan TEQ.
How do dioxins and furans get into the environment?
Dioxin and furans are released through natural (e.g., forest fires, volcanoes) and man-made (e.g., incinerator emissions, pulp and paper mill effluents) sources (GC, 1990; ATSDR, 1998a). They are not commercially used or produced, but form as by-products from industrial activities (ATSDR, 1998). According to the reporting requirements of Ontario’s Toxics Reduction Act, in 2012, manufacturing and mineral processing facilities:
- Used approximately 17 grams of dioxins and furans
- Created approximately 20 grams of dioxins and furans
- Made products containing 13 grams of dioxins and furans
All reporting facilities were within the Great Lakes Basin watershed (communications with OMOECC staff, 2014) (Appendix A).
Dioxin and furan trends, monitoring and levels in the Great Lakes Basin
- The majority of dioxin and furan emissions were to air (99 per cent).
- Less than 0.1 per cent were to water.
- <0.1 per cent were to land (Environment Canada, 2013d).
In Ontario, approximately 90 per cent of emissions have been reduced since 1988, achieving the 2011 reduction target (COA, 2011).
Dioxin and furan levels
Air
In 1969, the federal, provincial and territorial governments established the National Air Pollution Surveillance (NAPS) program to assess the quality of ambient air. This monitoring program included dioxins and furans from 1996 to 2010; however, the program has since interrupted its monitoring of these compounds.
Environment and Climate Change Canada monitors dioxin and furan concentrations in the air. The department noted that:
- Concentrations have decreased over time (SOLEC, 2011), with the largest declines (up to 75 per cent) at urban sites, where concentrations were the highest (GLBTS, 2009).
- Ambient air concentrations are well below the Ontario Ambient Air Quality Criteria (GLBTS, 2009).
- About half of the dioxin and furan air emissions are from the open burning of waste (i.e., open sources). Other sources include iron and steel manufacturing (Environment Canada, 2013d).
Water
- In general, dioxins and furans released to the aquatic environment are not detected in water. Therefore, there is infrequent water monitoring.
Sediment
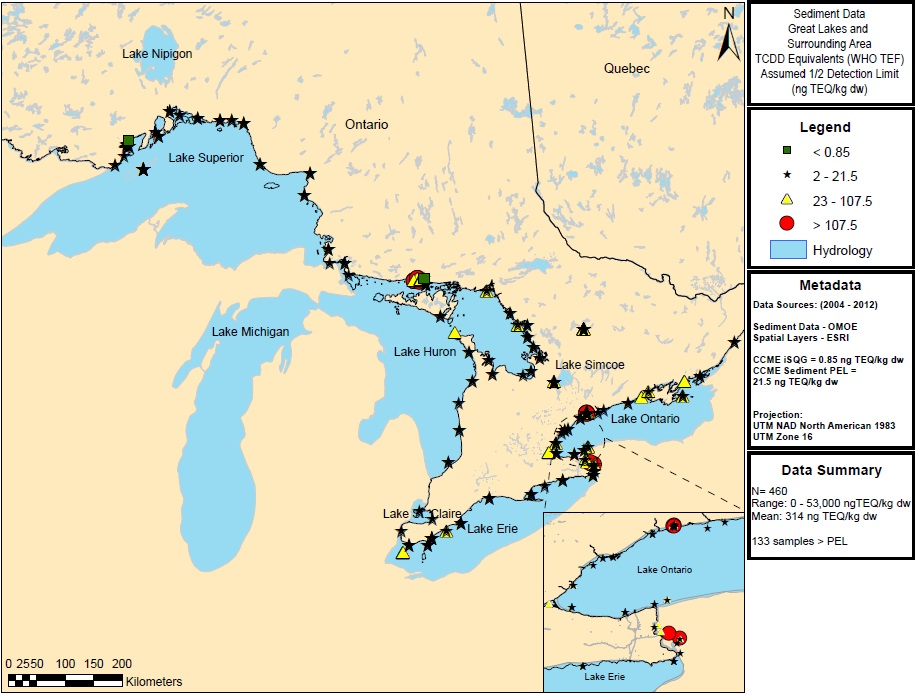
Most concentrations of dioxins and furans in sediment from the Canadian Great Lakes are found in depositional areas. Specifically:
- Concentrations in Lake Ontario have declined 70 per cent from 1970 to 2010 (SOLEC, 2011).
- Approximately 30 per cent of Great Lakes samples still exceed the CCME Probable Effects Level (PEL) of 21.5 ng/kg (Figure 2).
- Remediation of sediments within Areas of Concern has occurred, but may not be reflected in the data shown in Figure 2.
Figure 2: Concentrations of dioxins and furans TEQ in sediment (2004–2012). Source: Ontario Ministry of the Environment and Climate Change
Fish
- Dioxins and furans are persistent in the environment and are known to bioaccumulate; therefore, there continue to be fish consumption advisories for dioxins and furans at locations within the Great Lakes (SOLEC, 2011).
- Concentrations of dioxins and furans in fish have decreased from 2005 to 2012.
- Concentrations of dioxins and furans were measured in Lake Trout and Lake Whitefish collected between 1989 and 2003 in the Canadian Great Lakes (Bhavsar et al., 2008). The highest concentrations were found in Lake Ontario Lake Trout (22–54 pg/g). The concentrations for Lake Whitefish in Lake Ontario and all fish from the other Canadian Great Lakes were 60 to 95 per cent lower.
Herring Gull eggs
- Concentrations of dioxins and furans measured in Herring Gull eggs from the Canadian Great Lakes have decreased approximately 89 per cent from 1981 to 2013 (de Solla et al., submitted).
Tools and tactics for reducing dioxins and furans in the environment
A number of regulatory and non-regulatory initiatives have been taken to reduce concentrations of dioxins and furans in the Great Lakes.
Legislation and regulations
There are four listings for dioxins and furans on the Toxic Substances List – Schedule 1 of the Canadian Environmental Protection Act, 1999 – dibenzo-para-dioxin; dibenzofuran; polychlorinated dibenzo-para-dioxins; and polychlorinated dibenzofurans:
- In Canada, pulp and paper effluent regulations and regulations to phase out medicinal waste incinerators have resulted in significant reductions in dioxin and furan emissions (CIELAP, 2007; GLBTS, 2011).
- Combustion source management programs such as the “Burn It Smart!” campaign, the Canadian Code of Practice for Residential Wood Burning Appliances (CCME, 2012) and diesel retrofit programs help reduce dioxin and furan emissions.
The Ontario government passed the Ontario Toxics Reduction Act, 2009:
- The Act requires owners and operators of regulated facilities to develop plans for reducing the amount of prescribed toxic substances used and created.
- Dioxins and furans are on the list of prescribed toxic substances under the Act’s regulation (O. Reg. 455/09).
Environment and Climate Change Canada and the Ontario Ministry of the Environment and Climate Change continue to improve on dioxin and furan inventories within Ontario and Canada as a whole (COA, 2011).
Remedial action plans
- For dioxins and furans that are already in the aquatic environment of the Great Lakes, there are ongoing programs to assess and remove dioxin-contaminated sediments from the remaining designated Area of Concern under Remedial Action Plans – Thunder Bay Harbour on Lake Superior.
Agreements
Canada is a participant in several international agreements that aim to phase out a number of persistent toxic substances, including dioxins and furans. These include the:
- Commission for Environmental Cooperation (CEC, 2011)
- Convention on Long-range Transboundary Air Pollution, which has provided guidance on control options and Best Available Techniques for reducing emissions of Persistent Organic Pollutants (POPs) from major point sources (UNECE, 2009a)
- Stockholm Convention, (UNEP, 2009)
By supporting these conventions, Canada is helping to reduce out-of-basin sources and, long range atmospheric transport and deposition of toxic substances into the Great Lakes Basin.
Summary
Industries and open burning of waste continue to emit dioxins and furans to air. In the Great Lakes, dioxins and furans are generally found in sediment and fish. Most concentrations in sediment are below Probable Effect Levels (PELs). However, fish consumption advisories remain for locations in all of the Great Lakes due to the persistence of these chemicals in the environment and their ability to bioaccumulate in organisms.
7. Hexachlorobenzene (HCB)
Hexachlorobenzene (HCB) is a man-made chlorinated chemical. It does not occur naturally in the environment (ATSDR, 2013). Starting in the 1940s, HCB was commonly used as a pesticide. It was also used to preserve wood and in the production of other chemicals (GC, 1993; NCBI, 2012b).
HCB is considered to be one of the most persistent environmental pollutants. It is known to accumulate in the environment, animals and humans. It has also been shown to have significant toxic effects that can affect the liver and kidney and lead to cancer in people (ATSDR, 2013). As a result, the commercial production of HCB was prohibited in the 1970s in Canada and the United States (U.S.) (GC, 1993; ATSDR, 2013).
How does hexachlorobenzene get into the environment?
Although the use of HCB itself has been banned for over 40 years, it continues to be produced and subsequently released into the environment as a by-product in the manufacturing of other chemicals and as a contaminant found in some current pesticides (GC, 1993; ATSDR, 2013). Other sources of HCB to the environment include:
- On-site residential waste burning (burn barrels)
- Leaching of pentachlorophenol (with HCB as an impurity) from treated wood (utility poles) (LAMP, 2012a)
According to the reporting requirements of Ontario’s Toxics Reduction Act, in 2012, manufacturing and mineral processing facilities:
- Used approximately 183 grams of HCB
- Created 4,242 grams of HCB
- Made products containing 125 grams of HCB
All reporting facilities were within the Great Lakes Basin watershed (communications with OMOECC staff, 2014) (Appendix A).
HCB trends, monitoring and levels in the Great Lakes Basin
HCB releases are going down. In Ontario:
- There has been a reduction of approximately 70 per cent in HCB releases to the Great Lakes Basin as of 2007 (GLBTS, 2009).
- The majority of HCB emissions are to air (98.5 per cent).
- Less than 0.1 per cent of emissions are to water.
- Less than 1.5 per cent of emissions are to land (Environment Canada, 2013d).
Open and industrial sources contributed almost equally to HCB emitted to air. Of the industrial sources, 73 per cent of emissions were from iron and steel and non-ferrous metal production and processing.
HCB levels
Air
- There’s been a decrease in HCB concentrations in Ontario since the 1990s (GLBTS, 2009).
- The National Air Pollution Surveillance Program (1996–2010) detected ambient air concentrations of HCB at less than 1 ng/m3.
Water
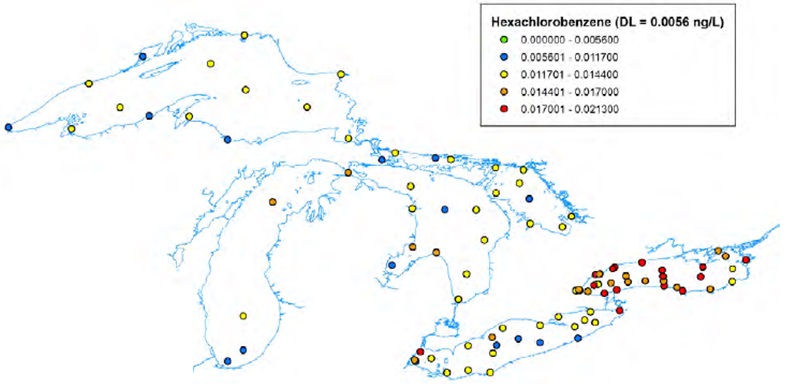
- Most HCB concentrations are below the Ontario Provincial Water Quality Objective (PWQO) of 0.0065 µg/L (6.5 ng/L). However, HCB was detected in open water from 2004 to 2007 in Lakes Erie and Ontario, most likely due to the historical industry and agriculture (Figure 3) (SOLEC, 2011).
- HCB has never been detected in the more than 2,300 raw water samples collected and analyzed under the Ontario Ministry of the Environment and Climate Change Drinking Water Surveillance Program (DWSP), from 1986 onwards (communications with OMOECC staff, 2014).
Figure 3: Concentrations of HCB in water of the Great Lakes (2004–2007). Source: SOLEC, 2011
Sediment
From 1970 to 2010 concentrations of HCB in sediment of Lake Ontario and Lake Erie decreased by 38 per cent and 72 per cent, respectively (Burniston et al., 2012):
- In 2004, surface sediments were collected from 108 locations in the St. Clair River, Lake St. Clair and the Detroit River (Szalinska et al., 2011).
- Only the concentration in the St. Clair River (Canada) exceeded Ontario provincial sediment quality guidelines (LEL only) (Szalinska et al., 2011).
Fish
Over the last 10 years, 92 per cent of whole Lake Trout or Walleye that Environment and Climate Change Canada collected in Canadian waters in the Great Lakes had no detectable levels of HCB:
- HCB has been monitored since the 1970s in several species of fish from the St. Clair River, Lake St. Clair and southern Lake Huron (Gewurtz et al., 2010). In Lake St. Clair, fish tissue concentrations decreased consistently from the 1970s and 1980s to the early 1990s. Subsequently, the concentration levels declined more slowly or stabilized. This was observed in many species of fish, regardless of their trophic position or diet. This suggests atmospheric sources could be contributing to the concentrations.
- The data also may suggest that non-atmospheric inputs of HCB, likely from sediment, remain in the St. Clair River (Gewurtz et al., 2010).
Since 2005, there have been no fish consumption advisories for HCB in fish across the Great Lakes.
Herring Gull eggs
- Between 1974 and 2007, concentrations of HCB in Herring Gull eggs for Lake Superior, Lake Huron, Lake Erie and Lake Ontario declined by 95 to 98 per cent (Weseloh, 2010).
Tools and tactics for reducing HCB in the environment
A number of regulatory and non-regulatory initiatives have been taken to reduce HCB in the Great Lakes.
Legislation and regulations
In Canada, the use, manufacture, sale and offer for sale of HCB as a pesticide is prohibited under the Pest Control Products Act:
- The Pest Management Regulatory Agency of Health Canada (PMRA, 1999) administers the Act.
- HCB is listed on the Toxic Substances List – Schedule 1 of the Canadian Environmental Protection Act, 1999, and is subject to the Act’s Prohibition of Certain Toxic Substances Regulations, 2012.
Programs
Reductions in HCB releases to the Great Lakes Basin are due to:
- Implementation of a Canada-Wide Standard for Solid Waste Incinerators (GLBTS, 2009)
- Reductions reported by the iron and steel sector
- Process changes within Ontario’s chlorinated chemical manufacturing sector
Ontario’s Toxics Reduction Act, 2009 and its regulation require provincial manufacturing and mineral processing facilities that meet thresholds to:
- Undertake yearly toxic substance accounting and reporting.
- Look for opportunities to reduce the use and creation of prescribed toxic substances by developing reduction plans.
- Make summaries of the reduction plans available to the public.
Implementation of plans is voluntary.
HCB is on the list of prescribed toxic substances.
Remedial action plans
- Under the St. Clair River Remedial Action Plan (RAP), actions are ongoing to address impacted sediment in this Area of Concern.
Agreements
Internationally, Canada is party to several multilateral environmental agreements that aim to reduce the levels of persistent toxic substances, such as HCB, in the environment. They include the:
- Commission for Environmental Cooperation (CEC, 2011)
- Stockholm Convention (UNEP, 2009)
- Convention on Long-range Transboundary Air Pollution (UNECE, 1998; UNEP, 2009)
- Rotterdam and Basel Conventions (FAO/UNEP, 2013; UNEP, 2011a)
By supporting these conventions, Canada is helping to reduce national and international out-of-basin sources and, therefore, atmospheric deposition of toxic substances into the Great Lakes Basin.
Summary
HCB continues to be produced and subsequently released into the environment as a by-product in the manufacturing of other chemicals, from industrial emissions, from burning of waste and as a contaminant found in some pesticides.
Concentrations in water, sediment, fish and Herring Gull eggs have decreased over time from the 1970s.
8. Mercury
Mercury is a naturally occurring element. It exists in elemental, inorganic and organic forms in the environment. Once mercury enters water, micro-organisms typically convert it to methyl mercury. This form of mercury is highly toxic. It can build up in fish, shellfish and other animals that are higher up the food chain. Wind and precipitation can carry mercury over long distances (referred to as long-range transport). Once it gets into the environment, it is persistent, so it remains in the environment for a long time.
Mercury can affect human health. It can cause damage to the nervous system and kidneys, and may also cause cancer (ATSDR. 1990).
How does mercury get into the environment?
Since mercury is a natural element, it can be released into the environment through natural (e.g., rock weathering, forest fires) or man-made (e.g., metal smelting, power plants, incinerators) sources. In the past, people used mercury as a fungicide on seeds and turf. However, there has been a drop in these and other uses of mercury since the 1970s, due to environmental and health concerns.
In the Great Lakes Basin, most mercury gets into the environment through the air. The iron and steel industries and incineration are the major sources of airborne mercury emissions. Minor amounts of mercury emissions enter land and water in the Basin. Often, winds and precipitation carry mercury emissions over long distances and into the Basin, from locations outside the U.S. and Canada – especially Asia.
Mercury trends, monitoring and levels for the Great Lakes Basin
Mercury levels are going down. Between 1998 and 2006, there was a 90 per cent drop in releases of mercury into Ontario. The most notable decrease was in the electric power generation sector, where facility emissions went down by 64 per cent between 2000 and 2011.
According to the reporting requirements of the Ontario Toxics Reduction Act, 2009:
- Manufacturing and mineral processing facilities in Ontario used 10,031 kg of mercury and mercury-containing compounds, with 8,137 kg contained in products.
- In reviewing specific data from 2012 in the Great Lakes Basin watershed, facilities reported the use of approximately 8,500 kg and 7,200 kg of mercury and mercury-containing compounds respectively in products (communications with OMOECC staff, 2014).
No mercury emissions were reported.
Mercury levels
Air
- Cross-border flows of mercury emissions currently account for over 95 per cent of the man-made mercury deposited in Canada. China and the U.S. are the primary sources of these deposits.
- With the elimination or control of legacy sources of mercury in Canada, mercury concentrations in the air are consistently decreasing. The Mercury Deposition Network provides a long-term record of total mercury concentration in precipitation in Canada and the United States. In 2012, it found concentrations around the Great Lakes were in the 7 to 13 ng/L range.
Water
- The western basin of Lake Erie has the highest mercury concentrations in water of any of the Great Lakes. Even so, the levels do not exceed the Canadian Council of Ministers of the Environment (CCME) Canadian Water Quality Guidelines.
- Over the past eight years, the Ministry of the Environment and Climate Change’s Drinking Water Surveillance Program detected mercury in less than 2 per cent of the raw water samples it collected and analyzed.
Sediment
- From 1970 to 2010, Lake Erie had a 37 per cent decrease in mercury in sediment. During the same period, mercury levels dropped in ranges from 73 to 89 per cent in Lakes Ontario, Huron and St. Clair. However, mercury concentrations are still a concern in Lakes Ontario and Erie (Figure 4).
- Monitoring of surface sediments during 2001–2002 found that mercury concentrations seldom were above the CCME Interim Sediment Quality Guidelines in Lake Superior and Georgian Bay.
- In 1998, a Lake Ontario sediment survey often found mercury, with 60 per cent of samples exceeding the PEL. Some of this sediment contamination may have been due to historical mercury cell chlor-alkali production along the Niagara, lower Detroit and upper St. Clair rivers.
Figure 4: Concentrations of mercury in surface sediment. Source: SOLEC (2011)
Fish
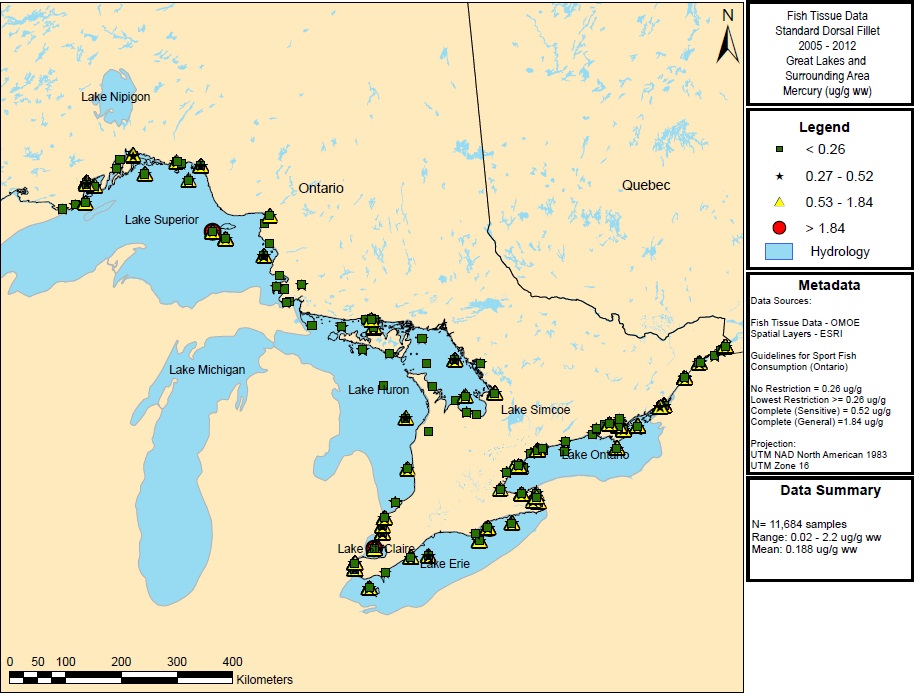
- Since the 1970s, Canada and Ontario have monitored mercury in several species of fish in the Great Lakes Basin. The levels of mercury in Great Lakes fish have gone down over the last four decades. However, mercury continues to be present in fish (Figure 5) (MOE, 2013).
- In Lake St. Clair, fish-tissue concentrations consistently went down from the 1970s to the 1990s. Concentrations in the lake have not been declining as rapidly in the last few years and, at times, have remained stable in many species of fish. A review of the data suggests atmospheric sources could be contributing to the concentrations.
- Data suggest that there are also non-atmospheric inputs of mercury in the St. Clair River. These are likely from elevated sediment levels in the lake.
- In 2009, the concentration levels of mercury in top predator fish from Lakes Ontario, Erie and Huron were all below 0.5 mg/kg. This met the target level set by the 1987 Great Lakes Water Quality Agreement.
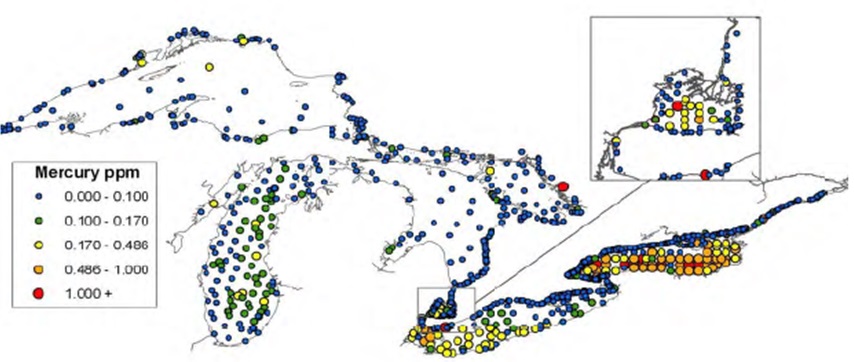
Figure 5: Concentrations of mercury in sport fish (2005–2012). Source: Ontario Ministry of the Environment and Climate Change
Herring Gull eggs
- Over the last three decades, concentrations of mercury in Herring Gull eggs have gone down by 94 per cent in the Great Lakes Basin, except in Lake Erie. Data from 1994 to 2009 has shown little change in levels of mercury in Lake Erie. This could be because, as is observed in fish, mercury is very persistent and can continue to circulate in the environment.
Tools and tactics for reducing mercury in the environment
A number of regulatory and non-regulatory initiatives have been taken to reduce mercury concentration levels in the Great Lakes.
Legislation and regulations
- Mercury is on the Toxic Substances List – Schedule 1 of the Canadian Environmental Protection Act, 1999. Health Canada developed a Risk Management Strategy for Mercury in 2010. It outlines past, current and anticipated federal mercury-management activities. They include regulations; emissions guidelines; codes of practice; pollution prevention planning for industrial sectors; and Canada-wide standards.
- The Government of Canada’s Products Containing Mercury Regulations entered into force in November 2015. The regulations prohibit the manufacture and import of products containing mercury or any of its compounds. There are some exemptions for essential products that do not have technically or economically viable alternatives (e.g., certain medical and research applications). The regulations include limits on the amount of mercury contained in fluorescent and other types of lamps.
Ontario’s Toxics Reduction Act, 2009 and its regulation require Ontario manufacturing and mineral processing facilities that meet certain thresholds to undertake yearly toxic substance accounting and reporting. They must:
- Look for opportunities to reduce the use and creation of prescribed toxic substances.
- Develop reduction plans.
- Make summaries of the plans available to the public.
Implementing the plans is voluntary.
Mercury and mercury-containing compounds are on the list of prescribed toxic substances.
Programs
Non-government programs to reduce mercury emissions include:
- “Switch Out” is a national program that Canada’s steel and automotive industries fund and support. It is designed to remove, collect and manage mercury-containing convenience lighting switches (e.g., in vehicle trunks, interiors) and anti-lock braking system (ABS) sensor modules in end-of-life vehicles before they are flattened, shredded and recycled into new steel.
- “Switch the ‘Stat’” is a thermostat replacement and collection program. Its delivery is in partnership with heating and cooling contractors/wholesalers in nearly every province across Canada. The program’s goal is to encourage the uptake of more energy-efficient, programmable thermostats and to provide a safe and responsible disposal option for older mercury-containing thermostats.
- The Recycling Council of Ontario manages the “Take Back the Light Program.” It’s a full-service fluorescent lamp recycling program for businesses and institutions in Ontario. HID (high-intensity discharge lamps), metal halide, mercury vapour, and high and low pressure sodium lamps also qualify for the program.
Recently, Ontario shut down the Thunder Bay Generating Station – its last active coal-fired power plant.
Remedial action plans
- For mercury already in the aquatic environment of the Great Lakes, there are ongoing programs to assess and manage mercury-contaminated sediments from designated Areas of Concern under Remedial Action Plans (RAPs). They include programs at Peninsula Harbour and Thunder Bay Harbour in Lake Superior, and on the St. Clair River.
Agreements
Canada is a participant in several international agreements that aim to reduce emissions and the use of harmful metals, including mercury. They include the:
- Commission for Environmental Cooperation (CEC, 2013a)
- Convention on Long-range Transboundary Air Pollution (UNEP 2011a)
- Basel Convention − which aims to control the transboundary movement of hazardous wastes (UNECE 2013)
By supporting these conventions, Canada is helping to reduce out-of-basin sources and long range atmospheric transport and deposition of toxic substances into the Great Lakes Basin.
The Government of Canada signed the Minamata Convention on Mercury in October 2013. The Minamata Convention on Mercury is a global treaty to protect human health and the environment from the adverse effects of mercury, through measures on trade, production, emission and release, and waste management.
Summary
The major sources of mercury in the Great Lakes Basin are coal-fired power plants in the U.S.; incinerators; iron and steel manufacturing; and mercury emissions that wind and precipitation carry over long distances from North American and international locations. With the recent removal of all coal-fired power plants in Ontario and ongoing international actions to reduce deposition from foreign sources, concentrations of mercury should continue to decrease.
Mercury continues to be present at concentrations of concern in the sediment of Lakes Erie and Ontario and in the air, mostly from foreign sources. Even though levels of mercury are below CCME guidelines in water, fish consumption advisories are in place for all of the Great Lakes.
9. Octachlorostyrene (OCS)
Octachlorostyrene (OCS) is a man-made chemical. It isn’t found naturally in the environment – it’s a by-product of industrial processes that combine carbon and chlorine at high temperatures (U.S. EPA, 2000b).
OCS is of concern because of its possible toxicity, its persistence in the environment and its ability to accumulate in wildlife (U.S. EPA, 2000b).
How does octachlorostyrene get into the environment?
Octachlorostyrene enters the environment through emissions from incineration processes or industrial wastewater effluents (U.S. EPA, 2000b). OCS in Lake Ontario sediments likely originated primarily from the waste product of electrolytic chlorine production, as the Niagara River formerly had four major chlorine manufacturers along its shores (Kaminsky and Hites, 1984).
Data from the 1980s indicated OCS releases from industrial sources in the Sarnia area along the St. Clair River, on the Niagara River and in Lake Erie at the mouth of the Ashtabula River (U.S. EPA, 2000b). Although there are no known current release sources, octachlorostyrene can still cycle within the environment due to its persistence (U.S. EPA, 2000b).
Octachlorostyrene trends, monitoring and levels in the Great Lakes Basin
- There’s been a general declining trend of octachlorostyrene concentrations in the Great Lakes. However, there is only a limited amount of available data (GLBTS, 2009; U.S. EPA, 2000b).
- Neither the Canadian National Pollutant Release Inventory nor the U.S. National Emissions Inventory reported OCS emissions (Environment Canada, 2013d).
Octachlorostyrene levels
Air
- The National Air Pollutant Surveillance Program monitored OCS in ambient outdoor air at several monitoring stations from 1996 to 2010. OCS concentrations significantly decreased from detection of maximum levels at 0.005 ng/m3 in the Hamilton area in 1997, to no detections above the limit at the majority of sites.
Water
- There has never been any detection of otachlorostyrene in any of the 2,300 raw water samples that the Ontario Ministry of the Environment and Climate Change Drinking Water Surveillance Program (DWSP) collected and analyzed over a 27-year period. A reason for this may be that, once in the aquatic environment, octachlorostyrene tends to move to sediments (communications with OMOECC staff, 2014).
- Currently, there are no water guidelines for octachlorostyrene.
Sediment
- There are no sediment guidelines for octachlorostyrene.
- Limited data from past monitoring in Lake Ontario found significant decreases in sediment contamination on or near the surface since the late 1960s and early 1970s (Marvin et al., 2003).
Fish
- There are infrequent detections of concentrations of octachlorostyrene in fish. The maximum measured concentrations in fish have not resulted in any fish consumption advisories (communications with OMOECC staff, 2014).
- Octachlorostyrene has been monitored since the early 1980s in several species of fish from the St. Clair River, Lake St. Clair and southern Lake Huron (Gewurtz et al., 2010).
- In Lake St. Clair, fish tissue concentrations decreased consistently from the early 1980s to the early 1990s. Subsequently, concentration levels declined more slowly or the concentration stabilized. This was observed in many species of fish, regardless of their trophic position or diet, suggesting atmospheric sources could be contributing to the concentrations.
- Data suggest that non-atmospheric inputs of octachlorostyrene, likely from sediment, remain in the St. Clair River (Gewurtz et al., 2010).
Herring Gull eggs
- Concentrations of octachlorostyrene in Herring Gull eggs have decreased up to 89 per cent in the Great Lakes Basin between 1987 and 2007 (Weseloh et al., 2010).
Tools and tactics for reducing octachlorostyrene in the environment
A number of initiatives have been undertaken to reduce octachlorostyrene concentration levels in the Great Lakes.
Programs
- Established in 1969 by the federal, provincial and territorial governments, Canada’s National Air Pollution Surveillance (NAPS) program assesses the quality of ambient air. NAPS included OCS in its monitoring program from 1996 to 2010. However, NAPS stopped its monitoring of OCS, due to the low frequency of its detection.
Remedial action plans
- Under the St. Clair River Remedial Action Plan (RAP), actions are ongoing to address impacted sediment in this Area of Concern.
Summary
There has been a general declining trend of octachlorostyrene concentrations in the Great Lakes in all environmental media – air, water and sediments – and there have been no fish advisories as of 2012.
10. Polychlorinated biphenyls (PCBs)
Polychlorinated biphenyls (PCBs) are a mixture of man-made chemicals that do not occur naturally in the environment (ATSDR, 2000; CCME, 2009). They have been used in Canada and the United States (U.S.) since 1929, but are tightly regulated because they remain in the environment for a long time (persistent).
They can cause cancer in people and also have other health and ecological impacts (ATSDR, 2000).
How do PCBs get into the environment?
PCBs get into the Great Lakes Basin from the air – especially the burning of pressure-treated wood and waste. PCBs had a variety of industrial and commercial uses, because they are stable, good insulators and do not burn easily (ATSDR, 2000). Until the late 1970s, they were used as coolants and lubricants in electrical equipment – for example, as transformers and capacitors, and in the manufacture of heat exchangers, hydraulic systems and in other specialized applications (ATSDR, 2000).
PCBs were never manufactured in Canada:
- In 1977, Canada banned the import, manufacture and sale (for re-use) of PCBs, followed by the banning of the release of PCBs into the Canadian environment in 1985 (CCME, 2009).
- Canadian legislation has allowed owners of equipment containing PCBs to continue using the equipment until the end of its service life.
- Since 1988, Canada has regulated the storage of PCBs and continues to do so.
- PCB handling, transport and destruction are regulated in Canada, primarily under provincial regulations.
Under the PCB Regulations, Canada continues to update its PCB inventory. As of 2010, approximately 555 tonnes remained in use in Canada and 12 tonnes were reported in storage (Environment Canada, 2014e).
Despite significant reductions in Canadian PCB inventories since the implementation of regulatory controls:
- Canadian releases of PCBs through spills and open burning of wastes can still occur.
- PCBs can enter the aquatic environment due to other localized sources, such as runoff from contaminated sites and leaching from unsecured landfills, as well as from long-range atmospheric transport and deposition (CCME, 2009).
- Once released into the aquatic environment, PCBs remain for many years, because they do not easily break down (persistent). They can be transported long distances (long-range transport), and they accumulate in sediment and living organisms, especially in larger, fattier fish, such as trout and salmon (CCME, 2009; MOE, 2013).
PCB trends, monitoring and levels in the Great Lakes Basin
Under the PCB Regulations, there is reporting on the annual quantity of PCBs in use, in storage and destroyed. No PCB releases to air or water are reported under the Canadian National Pollutant Release Inventory (Environment Canada, 2013d).
PCB levels
Air
- Since 1990, concentrations of PCBs have continued to decline. They are now at about half the 1990 level (IJC, 2013).
- Data from the Integrated Atmospheric Deposition Network (IADN) suggests that large urban centres, such as Chicago and Toronto, are significant sources of PCBs to the Great Lakes (IADN, 2008). Recent analysis found that atmospheric deposition was the greatest source of PCBs from Toronto to Lake Ontario (Melymuk et al., 2014).
- As global background levels of PCBs in air decrease, urban centres will become more important as source areas (IADN, 2008).
- Concentrations of PCBs detected at rural locations are considered to represent atmospheric background levels of PCBs in the Great Lakes Basin (IADN, 2008).
- Concentrations in precipitation are close to being undetectable. Therefore, monitoring these samples stopped after 2005 (SOLEC, 2011).
Water
- In general, PCBs released to the aquatic environment are not detected in water, as they usually bind to sediment or are taken up by aquatic organisms.
- There is no federal guideline for PCBs in water. However, the Ontario Provincial Water Quality Objective (PWQO) is 1 ng/L. Provincial data up to 2005 indicate that concentrations exceeded the PWQO in several locations, largely associated with Areas of Concern. Some of these areas have since been remediated and delisted (e.g., Wheatley Harbour on Lake Erie).
- PCBs were detected in less than 1 per cent of 2,200 raw water samples collected and analyzed under the Ontario Ministry of the Environment and Climate Change Drinking Water Surveillance Program over the past 12 years (communications with OMOECC staff, 2014).
Sediment
- There were decreases in sediment concentrations in the Great Lakes Basin from 1996 to 2009. Most concentrations are now below the Canadian Sediment Quality Guidelines Probable Effect Level (PEL) (CCME, 2009) of 277 µg/kg.
- As noted above, some Areas of Concern containing PCBs have been remediated and delisted as Areas of Concern (e.g., Wheatley Harbour on Lake Erie).
- Surface sediments in Lake Superior, Lake Huron and Georgian Bay were monitored in 2001/02 (Gewurtz et al., 2008). No sediment samples exceeded the PEL. There were elevated PCB concentrations in deposition zones (Gewurtz et al., 2008).
- The data suggest that Lakes Superior and Huron and Georgian Bay receive inputs through atmospheric deposition rather than point sources (Gewurtz et al., 2008).
Fish
- Concentrations of PCBs have declined over the past 30+ years of government monitoring of fish (SOLEC, 2011). However, the rate of decline is difficult to determine due to the variability in concentrations measured from year to year (Bhavsar et al., 2007).
- PCBs have been monitored since the 1970s in several species of fish from the St. Clair River, Lake St. Clair and southern Lake Huron (Gewurtz et al., 2010). In Lake St. Clair, fish tissue concentrations decreased consistently from the 1970s to the early 1990s. Subsequently, concentration levels declined more slowly or stabilized. This was observed in many species of fish, regardless of their trophic position or diet. The data suggest that non-atmospheric inputs of PCBs, likely from sediment, remain in the St. Clair River (Gewurtz et al., 2010).
- Fish consumption advisories for PCBs (211 ng/g) remain for all Canadian Great Lakes (Figure 6).
Figure 6: Concentrations of PCBs in fish (2010–2012). Source: Ontario Ministry of the Environment and Climate Change

Herring Gull eggs
- Concentrations of PCBs in Herring Gull eggs decreased up to 96 per cent in the Great Lakes Basin between 1974 and 2007 (Weseloh, 2010).
Tools and tactics for reducing PCBs in the environment
A number of regulatory and non-regulatory initiatives have been taken to reduce PCB concentration levels in the Great Lakes.
The provincial and federal governments and their Great Lakes partners have initiated programs and actions, leading to a decline in PCB concentrations in the Great Lakes (i.e., sediment and fish).
Legislation and regulations
- PCBs are on the Toxic Substances List – Schedule 1 of the Canadian Environmental Protection Act, 1999.
- In 2008, Canada published the PCB Regulations. The regulations were amended in 2010. The PCB Regulations set specific dates for the destruction of all remaining PCBs in service and storage in Canada (MOJ, 2014b).
Programs
- Successful initiatives for decreasing concentrations of PCBs in the Great Lakes, include the collection of old pesticides, paints and PCB transformers, and public education campaigns to stop the open burning of garbage (LAMP, 2012a, 2013b).
- For PCBs that are already in the environment, ongoing programs assess and remove PCB-contaminated sediments from designated Areas of Concern in the Great Lakes under Remedial Action Management Plans (LAMP, 2004, 2008, 2013b; Environment Canada and Ontario MOE, 2011; Environment Canada, 2014c, g, h). These Areas of Concern include Peninsula Harbour in Lake Superior, Hamilton Harbour in Lake Ontario, and the Detroit River.
Agreements
Previous Canada-Ontario Agreements (COAs) established a goal to virtually eliminate PCBs (COA, 2011). The COA agencies set and achieved their COA 2007 targets to:
- Destroy 90 per cent of stored high-level PCBs in Ontario.
- Eliminate 70 per cent of PCB uses in Ontario (COA, 2011).
Canada is also a participant in several international agreements on the phase-out of a number of persistent toxic substances, including PCBs, such as the:
- Stockholm Convention (UNEP, 2011c)
- Basel Convention (UNEP, 2011a)
- Rotterdam Convention (UNEP, 2011d)
By supporting these conventions, Canada is helping to reduce out-of-basin sources and long range atmospheric transport and deposition of toxic substances into the Great Lakes Basin.
Summary
The most significant input of PCBs to the Great Lakes is from air, particularly pressure-treated wood and waste burning. Once they are in the aquatic environment, PCBs remain for many years. Elevated localized concentrations of PCBs in sediment can still be detected in the Great Lakes Basin, particularly in Areas of Concern. Due to the persistence of PCBs in the environment, fish consumption advisories still exist in the Great Lakes.
Tier 2 chemicals
Chapters 11 to 20 discuss the Tier 2 chemicals.
11. Anthracene
Anthracene is a commercially used polycyclic aromatic hydrocarbon (PAH). It is also a by-product of the burning of gasoline, wood and other organic materials (ATSDR, 1995). In the aquatic environment, anthracene is generally found in sediments, where it may remain for many years (persistent). It also may accumulate in aquatic organisms (ECHA, 2008). As with other PAHs, ultraviolet light enhances the toxicity of anthracene to aquatic organisms (Bowling et al., 1983; ECHA, 2008; Lampi et al., 2006).
How does anthracene get into the environment?
Industrial sources and transportation are considered the major sources of PAH emissions (including anthracene) to the environment – primarily via washoff of hard surfaces, including roads and parking lots (Melymuk et al., 2014).
Anthracene:
- Is commercially used in large quantities to produce dyes, plastics, pesticides and medicines (ATSDR, 1995; U.S. EPA, 2012d; Environment Canada, 2013i)
- Can be released into the environment naturally from volcanoes and forest fires; and from anthropogenic sources including residential wood burning, automobile exhaust and facility emissions (ATSDR, 1995; U.S. EPA, 2012d)
Anthracene trends, monitoring and levels in the Great Lakes Basin
According to the reporting requirements of the Ontario Toxics Reduction Act, in 2012, manufacturing and mineral processing facilities:
- Used approximately 5,380 tonnes of anthracene
- Created 2,920 tonnes of anthracene
- Made products with 6,100 tonnes of anthracene
All reporting facilities were within the Great Lakes Basin watershed (communications with OMOECC staff, 2014) (Appendix A).
Anthracene levels
Since it is a PAH, any management activities to reduce PAH releases, emissions or concentrations apply to anthracene. Please see Chapter 20 on PAHs for details.
Air
- Concentrations of PAHs in air have been decreasing over time, with higher concentrations found near larger population centres (IADN, 2008; SOLEC, 2011).
- In Ontario, there’s been a decline in emissions of anthracene by 82 per cent since 2000, to 850 kg in 2011 (Figure 7; Environment Canada, 2013d).
- As Figure 7 show, environmental concentrations have been slightly increasing once again since 2007.
Figure 7: Annual anthracene facility emissions to land, water and air in Ontario (2000–2011). Source: Environment Canada, 2013d
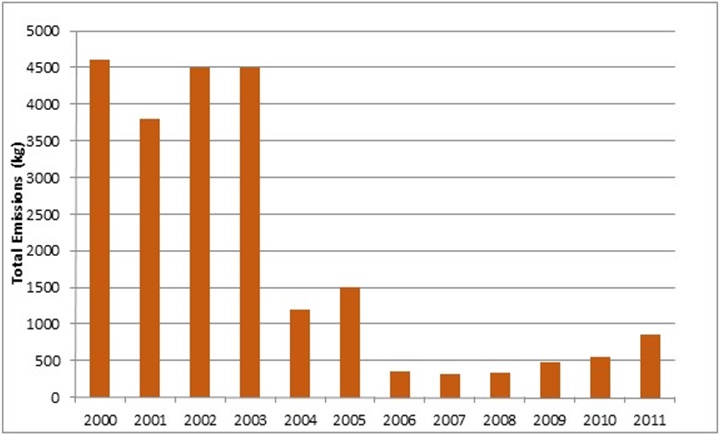
Water
- From 1998 to 2007, only 20 of the 1,153 open-water samples taken by the Ministry of the Environment and Climate Change exceeded the Canadian Council of Ministers of the Environment (CCME) Canadian Water Quality Guidelines (CWQG) of 12 ng/L, with a single measurement exceeding 10 times the CWQG.
- Detected levels of anthracene are associated with known PAH sources (e.g., iron and steel industrial operations at Hamilton Harbour and petroleum refineries at Sarnia).
- From 1987 onwards, anthracene was detected in less than 1 per cent of 1,000 raw water samples collected and analyzed under the Ministry of the Environment and Climate Change Drinking Water Surveillance Program.
- Anthracene has not been detected in any water samples since 1992 (communications with OMOECC, 2014).
Sediment
- Surface sediments in Lake Superior, Lake Huron and Georgian Bay were monitored in 2001 and 2002 (Gewurtz et al., 2008). All concentrations of anthracene were below CCME Interim Sediment Quality Guidelines (ISQG) in each lake (Gewurtz et al., 2008).
- Figures 8 and 9 show the sediment concentrations in the early years of the Canada-Ontario Agreement Respecting the Great Lakes Basin Ecosystem (COA) (1996–2001) and more recently (2002–2011). Numerous samples from both time periods exceeded the Canadian Sediment Quality Guidelines Probable Effect Level (CCME, 1999c) of 1,225 µg/kg:
- The samples with higher concentrations are associated with known PAH sources (e.g., iron and steel industrial operations at Hamilton Harbour and Sault Ste. Marie, and petroleum refineries at Sarnia).
- The increase in exceedances in the later years could be due to increased sampling in these areas or less sampling in areas with historically low concentrations, rather than an increase in the number of sources or the magnitude of releases of anthracene.
Figure 8: Concentrations of anthracene in sediments (1996–2001). Source: Ontario Ministry of the Environment and Climate Change
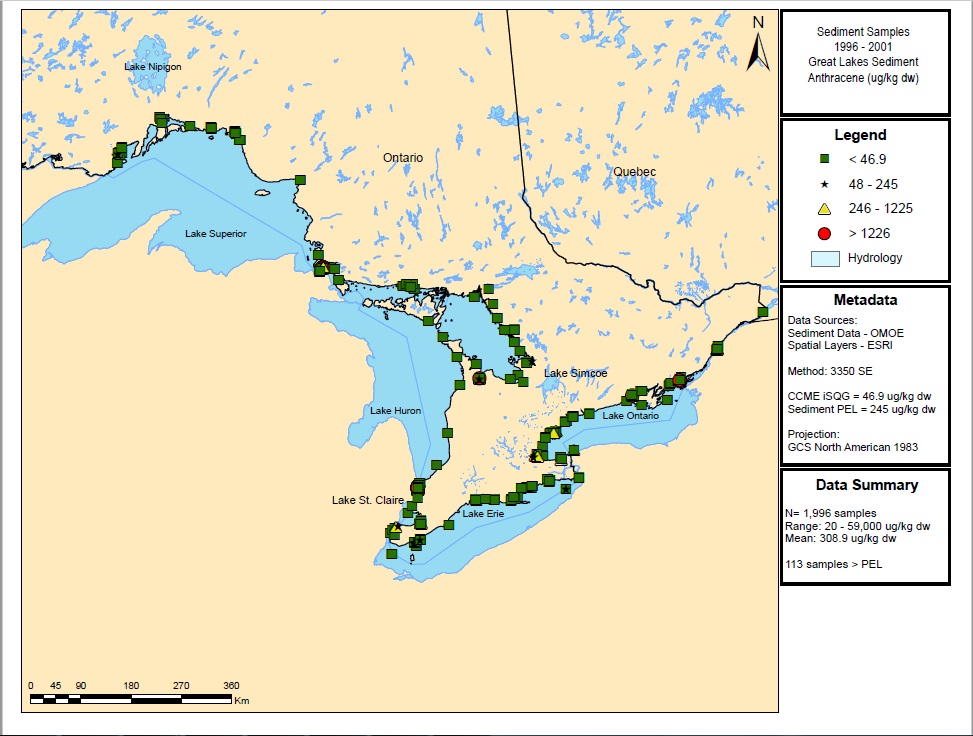
Figure 9: Concentrations of anthracene in sediments (2002–2011). Source: Ontario Ministry of the Environment and Climate Change
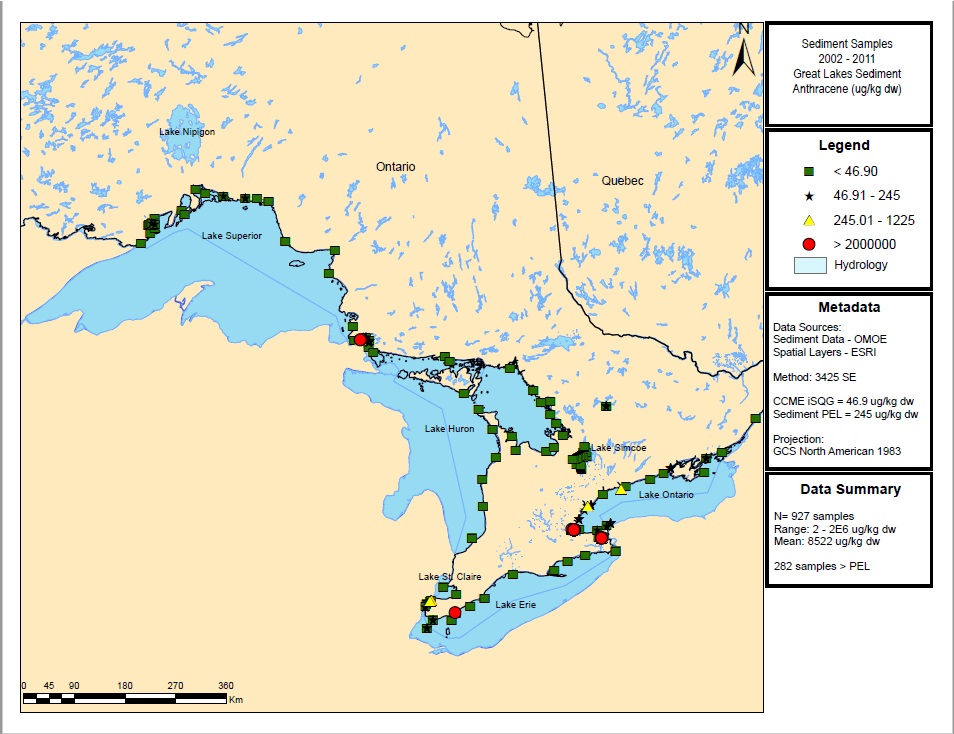
Fish
- Anthracene has not been monitored in fish.
Herring Gull eggs
- Anthracene has not been monitored in Herring Gull eggs.
Tools and tactics for reducing anthracene in the environment
Since it is a PAH, any tools and tactics to reduce PAH releases, emissions or concentrations apply to anthracene. Chapter 20, which discusses PAHs, has more details.
Summary
Anthracene concentrations in water and sediment exceed current guidelines, primarily in areas associated with known PAH sources (e.g., iron and steel industrial operations at Hamilton Harbour and Sault Ste. Marie and petroleum refineries at Sarnia). As noted above, please see Chapter 20 for more discussion on PAHs.
12. Cadmium
Cadmium is a naturally-occurring element commonly found in rock. It is often associated with zinc, lead and copper ores (ATSDR, 2012; CCME, 2014). Because it is natural, it can be present in water, air and soil (ATSDR, 2012). Cadmium can also accumulate in aquatic organisms (ATSDR, 2012; CCME, 2014).
Evidence suggests cadmium can cause cancer when inhaled (IARC, 2012), and it can cause other health effects in humans, fish and wildlife, including kidney damage (ATSDR, 2012).
How does cadmium get into the environment?
Cadmium can be released into the environment from various sources. It is used primarily in batteries, but it can also be found in pigments, coatings, stabilizers for plastics and other synthetic products (ATSDR, 2012; CCME, 2014). Other sources include zinc, lead or copper refining facilities (ATSDR, 2012), fuel combustion (power generation and heating), transportation, solid waste disposal and biosolid application (Environment Canada, 2013j).
Cadmium trends, monitoring and levels in the Great Lakes Basin
In Ontario, there has been a decline in industrial cadmium emissions of 53 per cent since 1998 (Environment Canada, 2013d). Of the total facility emissions of cadmium in 2011 (3,623 kg):
- 73 per cent (2,640 kg) was to air
- 26 per cent (947 kg) was to water
- 1 per cent (36 kg) was to land (Environment Canada, 2013d)
Emissions were from both industrial and non-industrial sources (Figure 10):
- Industrial sources accounted for 86 per cent of total air emissions (2011) in Ontario, with 71 per cent of the industrial emissions coming from the non-ferrous smelting and refining industry.
- Non-industrial sources accounted for 362 kg (12 per cent) of total emissions to air in Ontario with residential fuel combustion accounting for 50 per cent of emissions; commercial fuel combustion accounting for 34 per cent of emissions; and power generation accounting for 15 per cent of emissions.
Under Ontario’s Toxics Reduction Act, in 2012, manufacturing and mineral processing facilities:
- Used approximately 635,033 kg of cadmium and cadmium compounds
- Made products containing 520,603 kg of cadmium
A review of specific data from the Great Lakes Basin found:
- Approximately 102,000 kg of cadmium and cadmium-containing products used in the Great Lakes Basin watershed
- Products containing 73,200 kg of the chemical
Figure 10: Cadmium-based emissions to air in Ontario by sector. 2011. Source: Environment Canada, 2013b
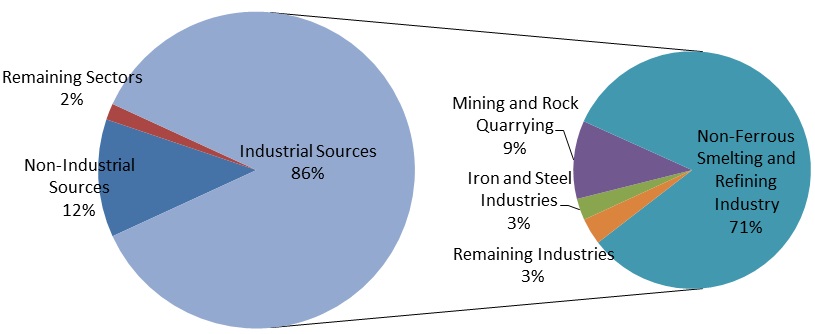
Cadmium levels
Air
- For concentrations across Ontario (Toronto, Windsor, Wallaceburg and Simcoe) (GLBTS, 2009), the median concentrations in 2008 were all well below the Ontario Ambient Air Quality Criterion of 5 ng/m3 for cadmium and cadmium compounds.
Water
- Concentrations of cadmium have decreased in the Great Lakes since the mid-1990s (IADN 2008), with the maximum concentration decreasing from 19.9 µg/L to 2.39 µg/L, and the mean decreasing from 0.107 µg/L to 0.093 µg/L.
- Lakes Ontario and Huron have had some of the highest measured concentrations of cadmium in water of the Great Lakes Basin (Figure 11), with approximately 20 per cent of concentrations still exceeding Canadian Council of Ministers of the Environment (CCME) Canadian Water Quality Guidelines (CWQG) (Figure 11).
- Cadmium was detected in approximately 14 per cent of 3,200 raw water samples collected and analyzed under the Ministry of the Environment and Climate Change Drinking Water Surveillance Program from 1985 onwards (communications with OMOECC staff, 2014).
Figure 11: Concentrations of cadmium in water of the Great Lakes (2003–2008). Source: Ontario Ministry of the Environment and Climate Change
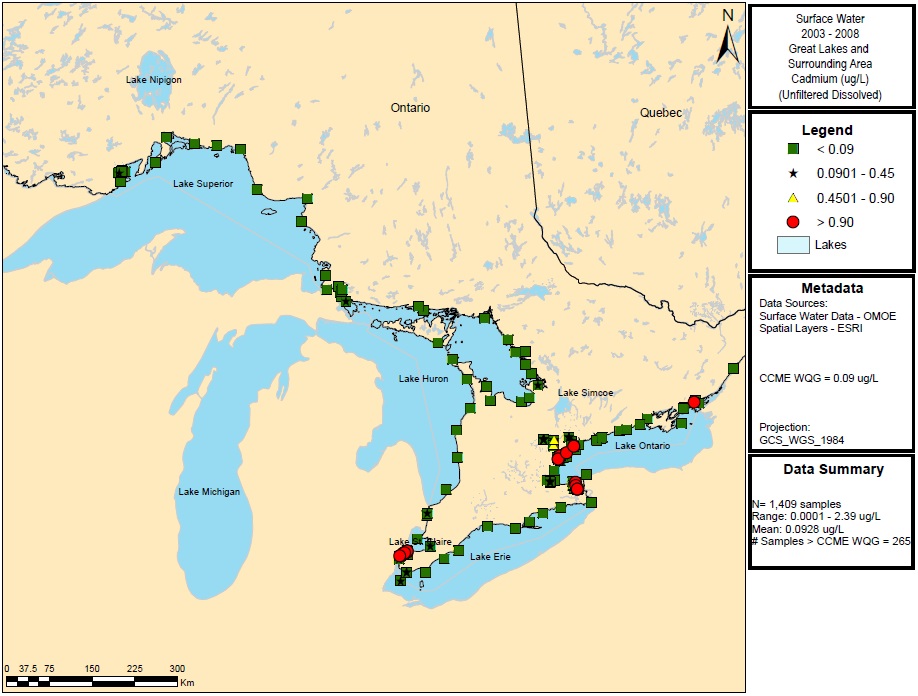
Sediment
- Monitoring data from the Ontario Ministry of the Environment and Climate Change show concentrations in sediments above the CCME Interim Sediment Quality Guidelines (ISQG) in each of the Great Lakes, with approximately 6 per cent of samples exceeding the Probable Effect Level (PEL).
- The average concentrations from 1996 to 2008 are below the PEL.
- Many of the samples exceeding the guidelines are located within Areas of Concern.
Fish
- All concentrations measured in fish are below consumption guidelines.
Herring Gull eggs
- Cadmium has not been monitored in Herring Gull eggs.
Tools and tactics for reducing cadmium in the environment
A number of regulatory and non-regulatory initiatives have been taken to reduce cadmium concentration levels in the Great Lakes.
Legislation and regulations
Inorganic cadmium compounds are on the Toxic Substances List – Schedule 1 of the Canadian Environmental Protection Act, 1999:
- Significant reductions in emissions have been made by implementing various management tools. They include new Source Emission Guidelines for Thermal Electricity Generation, an Environmental Code of Practices for Integrated and Non-Integrated Steel Mills and Pollution Prevention Planning Notices – Base Metals Smelters and Refineries and Zinc Plants (Environment Canada, 2013j).
- Several cadmium-containing substances will be risk-assessed as part of the cobalt and selenium substances groupings, under the National Chemicals Management Plan and, therefore, may be subject to subsequent federal risk management activities.
The Ontario Toxics Reduction Act, 2009 and its regulation require Ontario manufacturing and mineral processing facilities that meet thresholds to:
- Undertake yearly toxic substance accounting and reporting.
- Look for opportunities to reduce the use and creation of prescribed toxic substances by developing reduction plans.
- Make summaries of the plans available to the public.
Implementation of their reduction plans is voluntary.
Cadmium and cadmium-containing compounds are on the list of prescribed toxic substances.
Remedial action plans
- Point sources of cadmium in the Great Lakes environment, specifically cadmium-contaminated sediments, are being managed through site-specific remediation activities.
- Remedial Action Plans for Areas of Concern and Lakewide Action and Management Plans (LAMPs) include activities to address cadmium contamination in each of the Great Lakes (e.g., Wheatley Harbour in Lake Erie, the St. Clair River and Hamilton Harbour in Lake Ontario) (Environment Canada 2014g, h).
Agreements
Canada is a participant in several international agreements that aim to reduce emissions and use of harmful metals, including cadmium. For instance, Canada has agreed to comply with the:
- Convention on Long-range Transboundary Air Pollution that provided guidance on control options and Best Available Techniques for reducing emissions of heavy metals from major point sources (UNECE, 2013)
- Basel Convention, which aims to control the transboundary movement of hazardous wastes containing substances such as cadmium (UNEP, 2011a)
By supporting these conventions, Canada is helping to reduce out-of-basin sources and long range atmospheric transport and deposition of toxic substances into the Great Lakes Basin.
Summary
Cadmium is released into the environment from a variety of industrial, transportation, combustion and other sources. Loadings from the atmosphere, precipitation and tributaries to the Great Lakes may be significant. Cadmium concentrations in water and sediment of the Great Lakes continue to exceed guidelines in select regions. However, concentrations in fish do not exceed consumption limits.
13. 1,4-Dichlorobenzene
1,4-dichlorobenzene is a man-made chemical. It does not occur naturally in the environment (ATSDR, 2006; Environment Canada, 2003). It is not normally detected in water samples, as it generally associates with sediments, soils and air samples.
The federal government did a risk assessment on 1,4-dichlorobenzene. It concluded that it was not toxic to the environment or human health under the Canadian Environmental Protection Act, 1999 (CEPA, 1999) (Environment Canada, 2003).
How does 1,4-dichlorobenzene get into the environment?
1,4-dichlorobenzene is used:
- To produce deodorant blocks for restrooms and disposal bins, air fresheners and moth balls
- As a key ingredient in making resin (CCME, 1999d; ATSDR, 2006)
In addition, in the United States, it has been used as an insecticide on fruits and a fungicide on tobacco seeds, leather and fabrics (ATSDR, 2006). Because of its uses, it also can enter aquatic environments via effluents from industrial and sewage treatment plants, and from effluents from pulp and paper mills (Environment Canada, 2003).
1,4-dichlorobenzene trends, monitoring and levels in the Great Lakes Basin
Ontario had no reported industrial releases of 1,4-dichlorobenzene from facilities to air, land or water in 1994–2000, 2006, or 2008–2011 under the National Pollutant Release Inventory (NPRI). In addition, there were no reports of use of this substance in 2012 under the Ontario Toxics Use Reduction Act (communications with OMOECC staff, 2014).
1,4-dichlorobenzene levels
1,4-dichlorobenzene is not monitored in air, sediment or fish by the Ontario Ministry of the Environment and Climate Change.
Air
- 1,4-Dichlorobenzene concentrations may be higher in indoor air than in outdoor air because of its use in consumer products such as air fresheners (GC/EC/HC, 1993a).
Water
- From 1986 and onwards 1,4-dichlorobenzene was detected in less than 1 per cent of 3,200 raw water samples collected and analyzed under the Ministry of the Environment and Climate Change Drinking Water Surveillance Program (communications with OMOECC staff, 2014).
Sediment
Concentrations of 1,4-dichlorobenzene were measured in 1994 in sediments of the St. Clair River near Sarnia (Environment Canada, 2003):
- The median sediment concentration (normalized to organic carbon) was 37 mg/kg (range of 2 to 522 mg/kg) near an industrial facility, and 2 mg/kg (range of 0.4 to 7.5 mg/kg) near a sewage treatment plant (Environment Canada, 2003).
- Although there are no sediment guidelines for 1,4-dichlorobenzene, Environment Canada used an estimated no-effect value of 100 mg/kg (normalized to organic carbon) to evaluate potential toxicity. Therefore, in 1994, there were some locations in the St. Clair River near Sarnia industrial operations that exceeded the no-effect value, which could have resulted in toxicity to sediment organisms (Environment Canada, 2003).
More recent data on the occurrence of 1,4-dichlorobenzene in sediment is not available.
- 1,4-dichlorobenzene does not accumulate significantly in aquatic organisms. It has not been monitored in fish.
Herring Gull eggs
- 1,4-dichlorobenzene has not been monitored in Herring Gull eggs.
Tools and tactics to reduce 1,4-dichlorobenzene in the environment
A number of regulatory and non-regulatory initiatives have been taken to reduce 1,4-dichlorobenzene concentration levels in the Great Lakes.
Legislation and regulations
Ontario’s Toxics Reduction Act, 2009 and its regulation require Ontario manufacturing and mineral-processing facilities that meet thresholds to:
- Undertake yearly toxic substance accounting and reporting.
- Look for opportunities to reduce the use and creation of prescribed toxic substances by developing reduction plans.
- Make summaries of their reduction plans available to the public.
Implementation of plans is voluntary.
1,4-Dichlorobenzene is on the list of prescribed toxic substances.
Agreements
While 1,4-dichlorobenzene was assessed and concluded to be not toxic under CEPA, 1999, Canada is party to several multilateral environmental agreements that aim to reduce the levels of harmful substances, including 1,4-dichlorobenzene, in the environment. For instance:
- Canada agreed to the Basel Convention to control transboundary movement and disposal of hazardous wastes, including those containing 1,4-dichlorobenzene (UNEP, 2011a).
By supporting this convention, Canada is helping to reduce out-of-basin sources and long range atmospheric transport and deposition of toxic substances into the Great Lakes Basin.
Summary
1,4-Dichlorobenzene is not monitored routinely in air, sediment, fish or Herring Gull eggs. There have been no reportable releases of 1,4-dichlorobenzene in Ontario since 2008. Although 1,4-dichlorobenzene does persistent in sediments, it does not accumulate significantly in aquatic organisms and is not considered toxic by Environment Canada under CEPA, 1999.
14. 3,3’-Dichlorobenzidine
3,3’-Dichlorobenzidine is a man-made chemical. It is used in the production of pigments (ATSDR, 1998b). It is known to rapidly break down when exposed to sunlight and is not expected to be persistent in the environment.
However, it is of concern, as it can accumulate in aquatic organisms (GC/EC/HC, 1993b). It also may cause cancer and/or other adverse health effects in people, fish and wildlife (IARC, 1987; GC/EC/HC, 1993b).
How does 3,3’-dichlorobenzidine get into the environment?
3,3’-Dichlorobenzidine is used in the production of pigments for printing inks, textiles, plastics, enamels, paints, crayons, leather and rubber (GC/EC/HC, 1993b; ATSDR, 1998b).
While it’s not produced in Canada, approximately 100 tonnes are imported for use (GC/EC/HC, 1993b; Environment Canada, 2013k). Therefore, 3,3’-dichlorobenzidine can still enter into the environment through transport, use or emissions from the manufacturing plants that use it (GC/EC/HC, 1993b).
3,3’-dichlorobenzidine trends, monitoring levels in the Great Lakes Basin
According to the Canadian National Pollutant Release Inventory, there were no industrial emissions of 3,3’-dichlorobenzidine to air, water or land reported in Ontario from 1994 to 2011 (Environment Canada, 2013d).
3,3’-dichlorobenzidine levels
- Neither Environment and Climate Change Canada nor the Ontario Ministry of the Environment and Climate Change currently monitor 3,3’-dichlorobenzidine in air, water, sediment or fish.
- No concentrations in air, surface water, biota or sediment were reported in the Priority Substances List Assessment Report for 3,3’-dichlorobenzidine (GC/EC/HC, 1993b).
- No concentrations were measured in the aquatic environment. Therefore, models were used to estimate a concentration that might be found in surface water. The predicted concentration in surface water was much lower than a concentration that studies have shown could cause adverse effects in sensitive aquatic organisms (GC/EC/HC, 1993b).
Tools and tactics for reducing 3,3’-dichlorobenzidine in the environment
A number of regulatory and non-regulatory initiatives have been taken to reduce 3,3’-dichlorobenzidine concentration levels in the Great Lakes.
Legislation and regulations
3,3’-Dichlorobenzidine is on the Toxic Substances List – Schedule 1 of the Canadian Environmental Protection Act, 1999 (CEPA, 1999):
- Management tools are described in Strategic Options for the Management of Toxic Substances: Benzidine and 3,3’-Dichlorobenzidine (Environment Canada, 2003).
- The Priority Substances List Assessment Report for 3,3’-dichlorobenzidine (GC/EC/HC, 1993b) identified data gaps; however, the government considered further research to have low priority, due to the negligible exposures of biota and of the general population of Canada to it.
- 3,3’-Dichlorobenzidine may degrade in soil to form benzidine – a toxic compound (ATSDR, 1998b; GC, 2012).
Programs
- Best Management Practices (BMPs) for 3,3’-dichlorobenzidine were developed for the Ontario Ministry of the Environment and Climate Change (XCG, 2007). The BMPs recommended substituting or reformulating products that use 3,3’-dichlorobenzidine-based pigments.
Agreements
Internationally, Canada is party to several multilateral environmental agreements that aim to reduce the levels of toxic substances in the environment. For instance:
- Canada has agreed to the Basel Convention to control transboundary movements of hazardous wastes containing 3,3’-dichlorobenzidine produced from the manufacturing or use of inks, dyes, pigments, paints, lacquers and varnish (UNEP, 2011a).
By supporting this convention, Canada is helping to reduce out-of-basin sources and long range atmospheric transport and deposition of toxic substances into the Great Lakes Basin.
Summary
More research into 3,3’-dichlorobenzidine is considered to be a low priority, since biota and the general population in Canada have negligible exposure to it.
15. Tributyltin (TBT)
Tributyltin (TBT) is a man-made organic compound. It does not occur naturally in the environment (CCME, 1999e; ATSDR, 2005a). TBT may remain in the aquatic environment for a long time (persistent) as it tends to bind to sediments (CCME, 1999e; ATSDR, 2005a; GC, 2009).
TBT may cause adverse effects in people, particularly on their immune and endocrine systems (ATSDR, 2005a).
How does tributyltin get into the environment?
Tributyltin (TBT) has been used in both industrial and agricultural applications, including as a chemical stabilizer, catalyst, biocide and wood preserving and anti-fouling agent (CCME, 1999e; ATSDR, 2005a; GC, 2009). In Canada:
- Organotin (e.g., tributyltin) compounds are primarily used as heat stabilizers for polyvinyl chloride products.
- Historical widespread use of tributyltin as an anti-fouling paint on boat hulls, lobster traps and fishing nets resulted in elevated levels in aquatic environments (CCME, 1999e). As a result, the use and registration of organic tin-based anti-fouling paints stopped in 2003 (Transport Canada, 2010a).
- In 2010, Health Canada’s Pest Management Regulatory Agency began to phase out the use of tributyltin as a fungicide in textiles, leather, paper and wood due to its persistence and accumulation in the environment and toxicity to aquatic organisms (Health Canada, 2010a).
There are no known direct releases of tributyltin to the environment from manufacturing, or use, but tributyltin still remains in the environment due to its historical use as a pesticide and its persistence (ATSDR, 2005a):
- TBT may be present in other organotin products (mono- and di-butyltins containing less than 1 per cent TBT, and tetrabutyltin containing up to 30 per cent TBT) (Environment Canada, 2013l).
- Tetrabutyltin is not persistent in the environment but will degrade to TBT (GC, 2009). It is, therefore, a potential source of TBT to the environment.
TBT trends, monitoring and levels in the Great Lakes Basin
- No industrial emissions sources were reported under the National Pollutant Release Inventory (Environment Canada, 2013d).
Levels of TBT
- TBT is not monitored in air, water, sediment or fish by the Ontario Ministry of the Environment and Climate Change or Environment and Climate Change Canada.
- No monitoring data for organotin compounds in air were found (ATSDR, 2005a).
Air
- Organotins generally do not partition to air. Therefore, there is limited potential for long-range atmospheric transport of TBT (GC, 2009).
Water
Before the ban on TBT, in Ontario there was monitoring of water at marinas in Toronto, Mississauga, Oakville, Hamilton and Fifty Point (Hamilton), from April to December (Maguire and Batchelor, 2005):
- Concentrations in harbour water generally decreased from earlier monitoring from 1982 through 1999 (Maguire and Batchelor, 2005). Some of these measured concentrations of TBT in water were at or above the Canadian Council of Ministers of the Environment (CCME) Canadian Water Quality Guidelines (CWQG) of 8 ng/L at the time of monitoring.
- TBT has been shown to degrade to di- and mono-butyltin, as well as inorganic tin in water (GC, 2009). Therefore, concentrations of TBT in marinas most likely have been reduced since the ban.
Sediment
The most likely detection of TBT occurs in sediments of harbours, marinas and ports (ATSDR, 2005a; Maguire, 1984; Maguire and Batchelor, 2005):
- Data was available for only one sediment sample (measured at Kingston) from a study conducted by Maguire and Batchelor (2005).
- The sample had a TBT concentration greater than the lowest chronic value for a benthic invertebrate (600 µg/kg). At this concentration, there is little concern about impacts to the benthic (sediment) community.
Tools and tactics for reducing TBTs in the environment
A number of regulatory and non-regulatory initiatives have been taken to reduce TBT concentration levels in the Great Lakes.
Legislation and regulations
Tools and tactics for reducing TBTs in the environment are on the Toxic Substances List – Schedule 1 of the Canadian Environmental Protection Act, 1999 (CEPA, 1999). These tools and tactics also meet the criteria set out in the Persistence and Bioaccumulation Regulations under the Act:
- TBTs were added to the Prohibition of Certain Toxic Substances Regulations, 2012, developed pursuant to the Act.
- Environmental Performance Agreements and Codes of Practice are currently in place or being developed to manage any release of substances where TBTs may be present.
Agreements
Internationally, Canada is party to several multilateral environmental agreements that aim to reduce the levels of toxic substances, including tributyltin, in the environment. The agreements include the:
- International Maritime Organization International Convention on the Control of Harmful Anti-fouling Systems on Ships (GC, 2009)
- Rotterdam Convention under which no tributyltin compounds were to be imported or used in Canada after 2014 (FAO/UNEP, 2013)
By supporting these conventions, Canada is helping to reduce out-of-basin sources and long range atmospheric transport and deposition of toxic substances into the Great Lakes Basin.
Summary
Although TBT continues to be used in some manufacturing processes and may be present in other butyltin formulations, the main use of TBT in Canada as an anti-fouling paint on boat hulls is no longer permitted. Therefore, TBT concentrations in water are likely no longer of concern.
16. Dinitropyrene
Dinitropyrene is a chemical that does not naturally occur in the environment but is produced during the combustion of diesel fuel and gasoline (IARC, 2013).
It is of concern in the environment, as it can potentially cause gene mutations and cancer (IARC, 2013).
How does dinitropyrene get into the environment?
Dinitropyrene is not commercially produced or used for any purposes (IARC, 2013). Consequently, there are no reportable industrial emissions (Environment Canada, 2013d; U.S. EPA, 2011c):
- There may be small amounts of dinitropyrenes released from kerosene heaters or petroleum gas burners used in home heating and cooking (IARC, 2013).
- In the 1990s and 2000s, progressively tighter standards for on-road vehicles resulted in advances in diesel technology and, consequently, lower emissions (IARC MWG, 2012).
- Standards for non-road diesel and gasoline emissions, particularly in developing countries, are absent or less strict, resulting in air-borne releases of these chemicals. These can be transported via long range-transport on air particles to Canada (IARC MWG, 2012).
Dinitropyrene trends, monitoring and levels in the Great Lakes Basin
Dinitropyrene levels
Dinitropyrene is not monitored in air, water, sediment or fish by either the Ontario Ministry of the Environment and Climate Change or Environment and Climate Change Canada. There was no available data on concentrations of dinitropyrene in air or water in the U.S. (IARC, 2013) or Canada.
Tools and tactics to reduce dinitropyrene in the environment
A number of regulatory and non-regulatory initiatives have been taken to reduce dinitropyrene concentration levels in the Great Lakes.
Legislation and regulations
The Canadian Environmental Protection Act, 1999 (CEPA, 1999) includes requirements for vehicle, engine and equipment emissions and other aspects that are related to environment pollution. Although the Act does not list dinitropyrene as one of its toxic air pollutants, levels of dinitropyrene may be reduced by controls on the combustion of diesel fuel and gasoline.
Programs
Programs aimed at reducing diesel fuel and gasoline combustion emissions are:
- The Canadian Council of Ministers of the Environment (CCME) Environmental Code of Practice for On-Road Heavy-Duty Vehicle Emission Inspection and Maintenance Programs (CCME, 2003b)
- Diesel retrofit programs
- The development of filters to remove the particulates that may contain dinitropyrene from diesel engine exhausts (IARC, 2013)
Summary
Dinitropyrene is not commercially produced or used for any purposes, and there have been no reported industrial releases. In Canada, the Canadian Environmental Protection Act, 1999 (CEPA, 1999) includes requirements for vehicle, engine and equipment emissions and other aspects that are related to environment pollution.
Dinitropyrene is not expected to be released to the environment at levels of concern.
17. Hexachlorocyclohexane (HCH) (Lindane)
Hexachlorocyclohexane (HCH) is a man-made chemical. It occurs in eight different forms. Each has a unique name based on differences in chemical structure (ATSDR, 2005b). Technical-grade HCH was used as an insecticide, although the majority of the insecticidal properties were due to the presence of lindane (γ-HCH or gamma-HCH) (ATSDR, 2005b).
HCH is of concern because it is persistent (remains in the environment for long periods of time). It accumulates in sediments and wildlife and is toxic to aquatic organisms (CCME, 1999f; ATSDR, 2005b).
In addition, all forms of HCH may cause cancer, although there is stronger evidence for this for its alpha and beta forms (ATSDR, 2005b).
How does hexachlorocyclohexane get into the environment?
Canada discontinued registration of both alpha- and beta-HCH as pesticides in the early 1970s (Environment Canada, 2013m). In Canada:
- Lindane was never produced in Canada but was imported for use to control a variety of insect pests in moth sprays, seed treatments and for domestic insects (CCME, 1999f).
- The federal government stopped the registration of lindane as a pest-control product in 2005, making its use illegal.
- Lindane is still used in several prescription medications to treat head lice and scabies (ATSDR, 2005b; Health Canada, 2010b; SOLEC, 2011; Environment Canada, 2013m).
HCH continues to be found in the environment as a result of its widespread use in the past and its environmental persistence (CCME, 1999f; U.S. EPA, 2006a). Although Canada and the U.S. stopped using HCH for pest control, its continued use in foreign countries can potentially result in long-range transport into the Great Lakes Basin (U.S. EPA, 2006a).
HCH trends, monitoring and levels in the Great Lakes Basin
HCH levels
- No industrial sources of HCH emissions to air, water or land were reported in the Canadian National Pollutant Release Inventory (Environment Canada, 2013d).
Air
- HCH concentrations in the air have decreased since the early 1990s (Figure 12). It’s expected that decreases will continue with use restrictions (GLBTS, 2009). Although banned in Canada in 2004, HCH is still being deposited into the Great Lakes from the atmosphere through long-range transport from other countries (SOLEC, 2011).
Figure 12: Annual average air concentration of lindane (1992–2007). Source: GLBTS (2009)
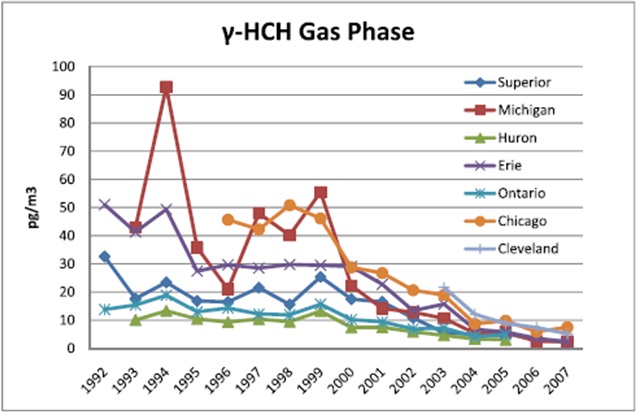
Water
Alpha-HCH and lindane are found at higher concentrations in Lake Superior than the lower Great Lakes, although there are no exceedances of water quality guidelines in any lake (SOLEC, 2011). These higher concentrations may be due to atmospheric deposits over the large surface area of Lake Superior, as well as the slower volatilization and breakdown at the lower water temperatures found in Lake Superior (Marvin et al., 2004; SOLEC, 2011):
- Lindane concentrations are declining over time in all lakes. This is likely due to the success of use restrictions (SOLEC, 2011).
- The Ontario Ministry of the Environment and Climate Change (OMOECC) monitors HCH in open water. Of the 1,451 samples the ministry collected, only one sample (taken in 2003) exceeded the Canadian Council of Ministers of the Environment (CCME) Water Quality Guidelines.
- OMOECC’s Drinking Water Surveillance Program has collected and analyzed over 1,850 raw water samples over 22 years for β-HCH and 27 years for α- and γ-HCH (ending in 2012) from the intake of drinking water treatment plants on the Great Lakes. The results show:
- detections of HCH in less than 38 per cent, 1 per cent and 5 per cent (for α-, β- and γ-HCH, respectively) of all the analyzed samples
- no detected HCH concentrations since 2004 (communications with OMOECC staff, 2014).
Sediment
- Lindane degrades slowly in sediment, resulting in a gradual decrease in concentrations over time (CCME, 1999f).
- In a 2002 study, only 1 of 147 samples taken from the mouth of 131 tributaries in Lake Ontario exceeded the CCME Probable Effect Level (PEL) of 1.38 µg/kg (Dove et al., 2003).
- The Ontario Ministry of the Environment and Climate Change does not monitor HCH in sediment.
Fish
- HCH is detected very infrequently in fish: ≤1 per cent of more than 20,000 samples (Ontario Ministry of the Environment and Climate Change data).
Herring Gull eggs
- HCH has not been monitored in Herring Gull eggs.
Tools and tactics for reducing HCH in the environment
A number of regulatory and non-regulatory initiatives have been taken to reduce HCH in the Great Lakes.
Legislation and regulations
- On January 1, 2005, lindane was deregistered for agricultural pest control uses in Canada, under the Pest Control Products Act. The Act prohibits the manufacture, possession, handling, storage, transport, import, distribution and use of lindane as a pest control product (Environment Canada, 2013m).
- The last date in the U.S. for the use of lindane pest control products was October 1, 2009 (U.S. EPA, 2006a).
- The only current allowable use of lindane in Canada or the United States is for control of head lice and scabies in human health pharmaceuticals. Alternative products are available.
Agreements
Internationally, Canada is party to several multilateral environmental agreements that aim to reduce the levels of persistent toxic substances, including lindane, in the environment. The agreements include the:
- Commission for Environmental Cooperation (CEC, 2013b)
- Stockholm Convention (UNEP, 2009)
- Convention on Long-range Transboundary Air Pollution to eliminate the use of lindane (UNEP, 2009; UNECE, 2010b)
- Rotterdam and Basel Conventions (FAO/UNEP, 2013; UNEP, 2011a)
By supporting these conventions, Canada is helping to reduce out-of-basin sources and long range atmospheric transport and deposition of toxic substances into the Great Lakes Basin.
Summary
Generally, HCH is detected in water, sediment or fish of the Great Lakes at concentrations below those of concern. There is no use of HCH for pest control in Canada. There is long-range atmospheric transport of lindane to the Great Lakes from international sources.
18. 4,4’-Methylenebis(2-chloroaniline) (MBOCA)
4,4’-Methylenebis(2-chloroaniline), or MBOCA, is a man-made chemical. It is not found naturally in the environment (ATSDR, 1994). MBOCA breaks down in the environment (it is not persistent) and does not accumulate in plants or wildlife (ATSDR, 1994).
There is limited information about the human health effects of MBOCA, although it may cause cancer (ATSDR, 1994).
How does 4,4’-methylenebis(2-chloroaniline) get into the environment?
The release of MBOCA to the environment is not a widespread issue.
MBOCA:
- Is widely used as a curing agent to produce castable polyurethane parts for use in a variety of commercial and military products, including shoe soles, pulleys for elevators and escalators, jet engine turbine blades and radar systems (ATSDR, 1994; U.S. EPA, 2000c)
- Can be released into the air during manufacturing processes (ATSDR, 1994). However, potential releases to the environment are not considered high
- Has limited releases to the atmosphere
- Has negligible releases to soil and water (SIDS, 2013)
In 2000, there were no manufacturers of MBOCA in Canada (Health Canada, 2005).
MBOCA trends, monitoring and levels in the Great Lakes Basin
Under the Ontario Toxics Reduction Act, in 2011 two companies in Ontario reported using approximately 84,000 kg of MBOCA. In 2012, only one facility reported using MBOCA (approximately 70,000 kg), releasing 2.6 kg to air (Environment Canada, 2013d).
MBOCA levels
- MBOCA is not monitored in air, water, sediment or fish by the Ontario Ministry of the Environment and Climate Change or Environment and Climate Change Canada.
- Measured concentrations in Canadian environmental media are not available (Health Canada, 2005).
- MBOCA is expected to be found only in areas near manufacturing plants.
Tools and tactics for reducing 4,4’-methylenebis(2-chloroaniline) in the environment
A number of regulatory and non-regulatory initiatives have been taken to reduce 4,4’- methylenebis (2-chloroaniline) concentration levels in the Great Lakes.
Legislation and regulations
Ontario’s Toxics Reduction Act, 2009 and its regulation require the province’s manufacturing and mineral-processing facilities that meet thresholds to undertake yearly toxic substance accounting and reporting. They must:
- Look for opportunities to reduce the use and creation of prescribed toxic substances.
- Develop reduction plans.
- Make summaries of the reduction plans available to the public.
Implementation of plans is voluntary.
MBOCA is on the list of prescribed toxic substances.
Programs
The Polyurethane Manufacturing Association (PMA) prepared a MBOCA Safe Use Guidance document for the Castable Polyurethane Industry in 2010. It outlines workplace safety practices and describes environmental compliance issues (PMA, 2010).
Summary
The release of MBOCA to the environment is not a widespread issue. MBOCA is unlikely to be found far beyond areas where it is used in manufacturing processes. It also does not persist in the environment or accumulate in plants or wildlife.
19. Pentachlorophenol (PCP)
Pentachlorophenol (PCP) is a man-made chemical. It was once widely used as a wood preservative, herbicide and pesticide in Canada and the United States (U.S.) (CCME, 1997; ATSDR, 2001).
PCP is of concern because it has been shown to adversely affect reproductive health in wildlife and may cause cancer in humans (IARC, 1999; ATSDR, 2001). It is not considered toxic to the environment as risk assessed under the Canadian Environmental Protection Act, 1999.
How does pentachlorophenol get released into the environment?
PCP was used to inhibit algal and fungal growth in industrial cooling towers. This use was restricted in the early 1980s (ATSDR, 2001).
Currently, the use of PCP is restricted to the heavy-duty wood preservation of utility poles, railway ties, wharf pilings and some non-residential outdoor construction materials (CCME, 1997; ATSDR, 2001; Health Canada, 2013a). PCP is released to the environment from these treated wood surfaces and from industrial effluents and factory waste disposal (ATSDR, 2001):
- PCP is not produced in Canada (Health Canada, 2013a). Therefore, no sources of PCP emissions to air or water were reported in the Canadian National Pollutant Release Inventory (Environment Canada, 2013d).
- Canada imports PCP from the U.S. and uses approximately 147 tonnes annually (Van der Zande, 2010).
- There are no residential uses of PCP (Van der Zande, 2010).
PCP trends, monitoring and levels in the Great Lakes Basin
PCP is infrequently detected in the Great Lakes Basin.
PCP levels
Air
- PCP concentrations in air at sites in Ontario have declined slowly between 1997 and 2008, with concentrations generally below 0.5 ng/m3 since 2006 (GLBTS, 2009).
- The last reported concentrations of PCP under the National Air Pollutants Surveillance program reported levels at all monitoring sites in Ontario at less than 0.1 ng/m3. This value is significantly lower than the Ontario Ambient Air Quality Criteria for PCP of 20 µg/m3 (20,000 ng/m3).
Water
- PCP has not been detected in raw water samples since 1997 (communications with OMOECC staff, 2014).
Sediment
- PCP is not monitored in sediment of the Canadian Great Lakes.
Fish
- PCP has not been shown to accumulate in fish and, therefore, has not been measured.
Herring Gull eggs
- PCP has not been shown to accumulate in Herring Gull eggs and, therefore, has not been measured.
Tools and tactics to reduce pentachlorophenol in the environment
A number of regulatory and non-regulatory initiatives have been taken to reduce PCPs in the Great Lakes.
Legislation and regulations
- A Canadian Environmental Protection Act, 1999 (CEPA, 1999) screening assessment report concluded that PCP does not meet the definition of “toxic” in section 64 of CEPA, 1999.
- Health Canada’s Pest Management Regulatory Agency (PMRA) re-evaluated PCP in 2011 and granted continued registration of PCP for sale and use in Canada (Health Canada, 2011). The decision was based, in part, on a low level of concern for impacts to aquatic organisms. However, all wood-treatment facilities are required to follow the Recommendations for the Design and Operation of Wood Preservation Facilities (Technical Recommendations Document) (2013 TRD).
- The PMRA developed a risk management plan for heavy-duty wood preservatives (Health Canada, 2013b).
Programs
- For PCP already in the aquatic environment of the Great Lakes, ongoing programs assess and remove PCP-contaminated sediments from designated Areas of Concern (AOCs) under Remedial Action Plans. This includes Thunder Bay Harbour on Lake Superior (Environment Canada, 2014a).
Agreements
Internationally, Canada is party to several multilateral environmental agreements that aim to reduce the levels of toxic substances in the environment. The agreements include the:
- Stockholm Convention (UNEP, 2011e)
- Rotterdam Convention (FAO/UNEP, 2013)
- Basel Convention (UNEP, 2011a)
By supporting these conventions, Canada is helping to reduce out-of-basin sources and long range atmospheric transport and deposition of toxic substances into the Great Lakes Basin.
Summary
PCP levels in the environment (air and water) are well below levels of concern and are infrequently detected. Current use of the chemical is restricted and has been risk assessed as being not toxic to the environment.
20. Polycyclic Aromatic Hydrocarbons (PAHS)
Polycyclic aromatic hydrocarbons (PAHs) are a group of chemicals that are produced as by-products. PAHs can be found in the air, water and soil and can be transported over long distances. In the aquatic environment, PAHs are generally found in sediments, where they may remain for many years. However, they do not accumulate in the food chain and are insoluble in water.
Some PAHs may cause cancer and have other health effects in people, fish and wildlife.
There are 17 polycyclic aromatic hydrocarbons (PAHs) on the COA Tier 2 list (Table 6):
- These 17 PAHs were added to the National Pollutant Release Inventory in 2000 as an alternate reporting threshold. They also were selected based on their classification as persistent, bioaccumulative and toxic substances by Environment Canada’s Accelerated Reduction/Elimination of Toxics (ARET group A).
- Two PAHs on the ARET group A list of 19 PAHs (1,6- and 1,8-dinitropyrene) were excluded from the list, as there was no information on releases in Canada and Environment Canada found no emission factors (Environment Canada, 2013n).
Chapter 5 of this report has information specific to benzo(a)pyrene.
| Chemical abstract service number | chemical |
|---|---|
| 56-55-3 | Benzo(a)anthracene* |
| 218-01-9 | Benzo(a)phenanthrene (Chrysene) |
| 50-32-8 | Benzo(a)pyrene |
| 205-99-2 | Benzo(b)fluoranthene* |
| 192-97-2 | Benzo(e)pyrene |
| 191-24-2 | Benzo(g,h,i)perylene |
| 205-82-3 | Benzo(j)fluoranthene |
| 207-08-9 | Benzo(k)fluoranthene* |
| 224-42-0 | Dibenz(a,j)acridine |
| 53-70-3 | Dibenzo(a,h)anthracene |
| 189-55-9 | Dibenzo(a,i)pyrene |
| 194-59-2 | 7H-Dibenzo(c,g)carbazole |
| 206-44-0 | Fluoranthene |
| 193-39-5 | Indeno(1,2,3-c,d)pyrene* |
| 198-55-0 | Perylene |
| 85-01-8 | Phenanthrene |
| 129-00-0 | Pyrene |
* PAHs listed under the UNECE (2010) POPs Protocol
How do PAHs get into the environment?
PAHs can enter the environment in many different ways. They are:
- Associated with fossil fuels (oil and coal)
- In tar-based products (asphalt, crude oil, coal tar pitch, creosote and roofing tar)
- Able to enter the environment as by-products of burning gasoline and residential wood and other organic materials, from natural sources such as volcanoes and forest fires, and in automobile exhaust and facility emissions
PAH levels
The levels of PAHs reported to air, water and land have decreased since 2000:
- Overall, the PAH facility emissions in Ontario have declined by 86 per cent from 2000 to 2011 (Figure 13).
- Most of the emissions are to air.
- Less than 4 per cent of emissions are from releases to water or land.
- From 2000 through 2011, facilities emitted more phenanthrene than any other PAH.
- Residential fuel wood combustion accounts for most (99.9 per cent) of the non-industrial source emissions.
According to the reporting requirements of the Ontario Toxics Reduction Act, 16 of the 17 PAHs were reported (not 7H-Dibenzo(c,g)carbazole):
- In 2012, manufacturing and mineral-processing facilities used approximately, 41,831 of PAHs, created approximately 30,867 tonnes of PAHs and their products contained approximately 87,550 of PAHs.
- All reporting facilities were within the Great Lakes Basin watershed (communications with OMOECC staff, 2014) (Appendix A).
Figure 13: Annual PAH facility emissions to water, land and air in Ontario (2000–2011)
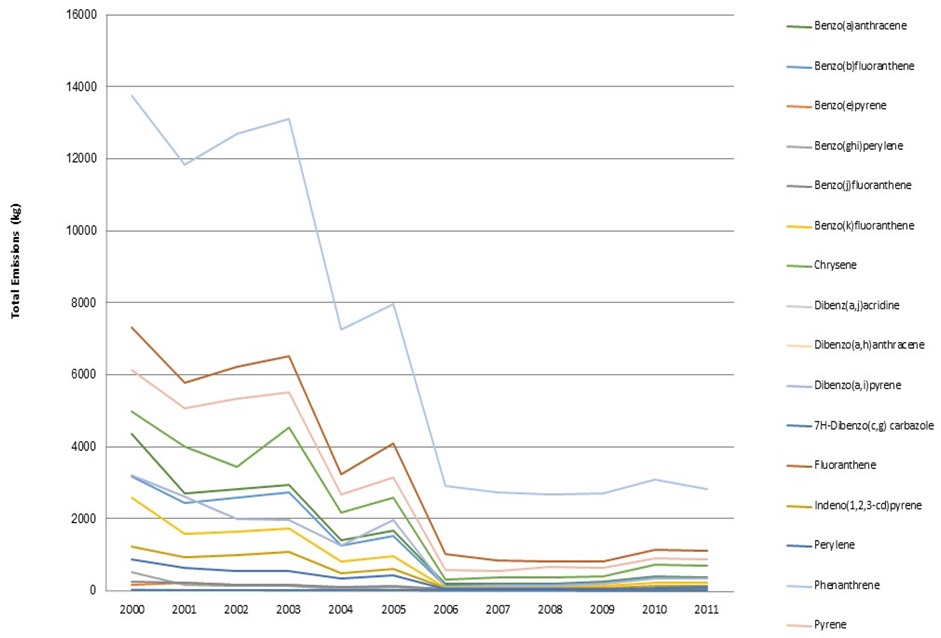
Air
Over time, there has been a decrease in the concentrations of PAHs in the air. There are higher concentrations near larger population centres:
- Integrated Atmospheric Deposition Network (IADN) monitoring data are still finding significant deposits of PAHs into the Great Lakes from the air.
- From 1997 to 2003, the IADN measured PAH concentration samples collected from several sites. IADN found there were higher PAH concentrations in the winter than in the summer. Most PAHs did not show significant long-term trends for the sites on Lakes Superior and Erie.
- For the two Canadian sites on Lakes Huron and Ontario, lower molecular weight PAHs (e.g., fluorene, pyrene) showed long-term decreasing trends. However, no long-term trends were observed for higher molecular weight PAHs at these sites.
- Generally, the Lake Superior sites had the lowest PAH concentrations (in the <1 to tens of ng/L range) (Sun et al., 2006b). This is to be expected, as there are a lower number of large urban industrial cities surrounding this lake.
Water
- In some cases, the levels of PAHs in open surface water are still above the Canadian Council of Ministers of the Environment (CCME) Canadian Water Quality Guidelines (CWQG). These exceedances are associated with known industrial sources.
- Several PAHs do not have a CCME CWQG. For those PAHs without a guideline, their concentrations were compared to the Ontario Interim Provincial Water Quality Objectives (PWQOs). This comparison indicated that, in general, Lake Erie and the St. Clair River have the highest PAH levels of concern in the province.
Figure 14: Concentrations of benzo(a)anthracene in water of the Great Lakes (1998–2007). Source: Ontario Ministry of the Environment and Climate Change
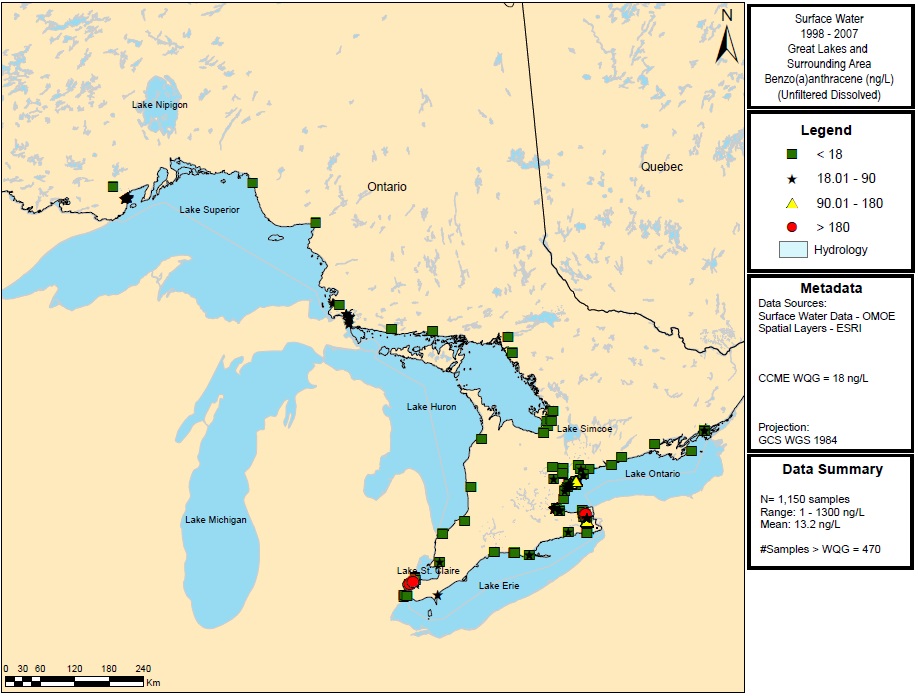
Figure 15: Concentrations of pyrene in water of the Great Lakes (1998–2007). Source: Ontario Ministry of the Environment and Climate Change
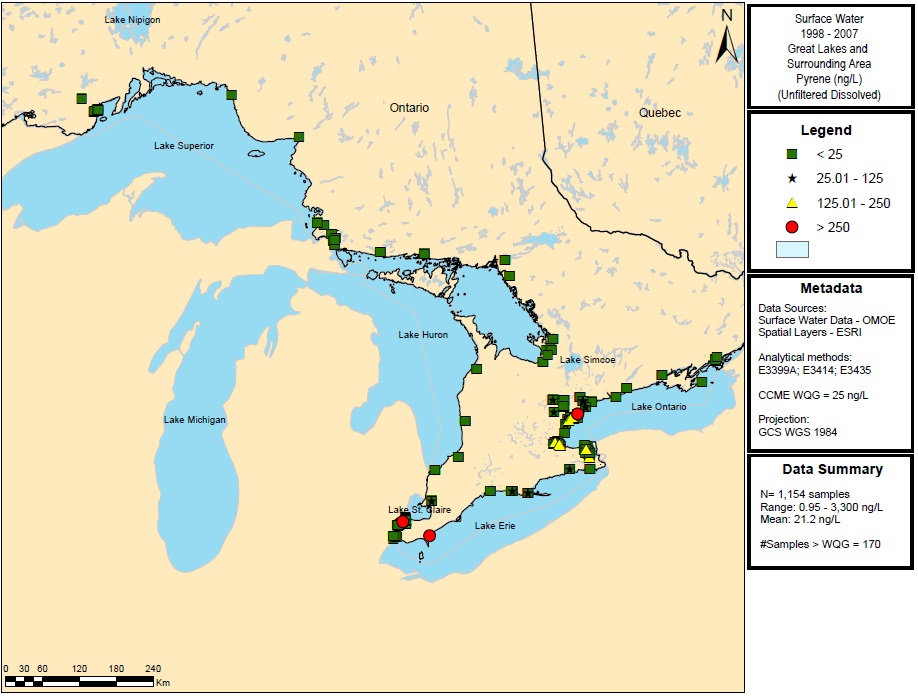
- Research into the use of passive sampling devices to monitor PAH concentrations in water in Hamilton Harbour (an Area of Concern) in 2006 found concentrations of fluoranthene ranging between 14 to 19 ng/L and 23 to 29 ng/L for pyrene (Ouyang et al., 2007).
- The Ontario Ministry of the Environment and Climate Change does not monitor benzo(a)phenanthrene, benzo(b)fluoranthene, benzo(j)fluoranthene, benzo(k)fluoranthene, dibenz(a,j)acridine, dibenzo(a,i)pyrene or 7H-dibenzo(c,g)carbazole in water of the Great Lakes.
- Over the last 27+ years, the ministry’s Drinking Water Surveillance Program detected PAHs in approximately 2 per cent of 1,000 samples. The ministry did not detect benzo(a)anthracene, benzo(g,h,i)perylene, dibenzo(a,h)anthracene, indeno(1,2,3-c,d)pyrene, or perylene in the Great Lakes Basin (Figures 14 and 15
Sediment
- The Ontario Ministry of the Environment and Climate Change does not monitor the following PAHs in sediment of the Great Lakes: benzo(a)phenanthrene; benzo(j)fluoranthene; dibenz(a,j)acridine; dibenzo(a,i)pyrene and 7H-dibenzo(c,g)carbazole).
- For those PAHs that are currently monitored, PAH concentrations are generally higher in industrial emission areas and near urban centres, as they are associated with large population centres (Figures 16, 17, 18, 19, 20 and 21).
Figure 16: Concentrations of benzo(a)anthracene in sediments (2003–2012). Source: Ontario Ministry of the Environment and Climate Change
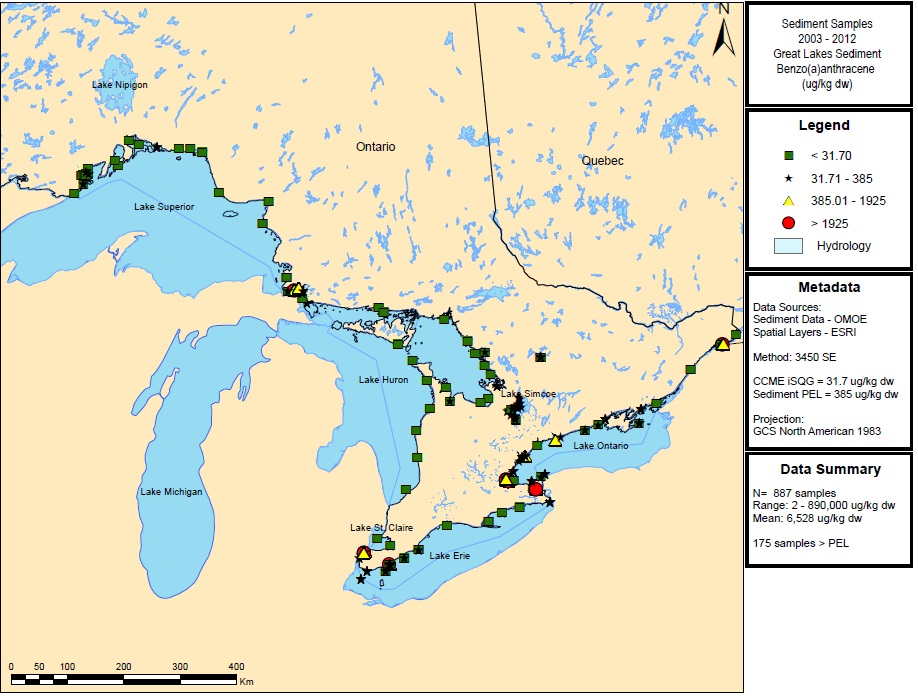
Figure 17: Concentrations of dibenzo(a,h)anthracene in sediments (2003–2012). Source: Ontario Ministry of the Environment and Climate Change
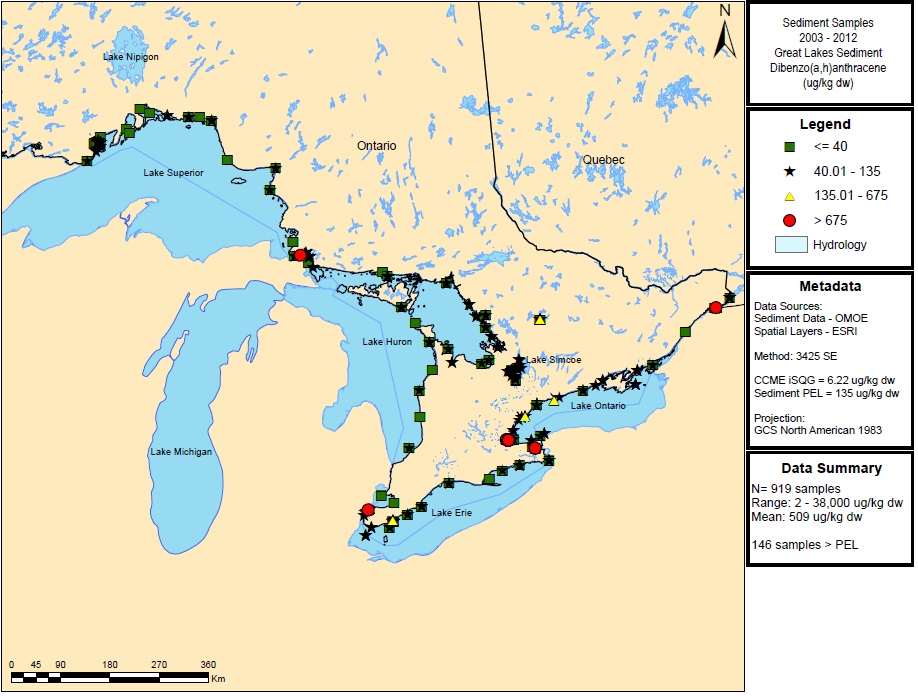
Figure 18: Concentrations of fluoranthene in sediments (2003–2012). Source: Ontario Ministry of the Environment and Climate Change
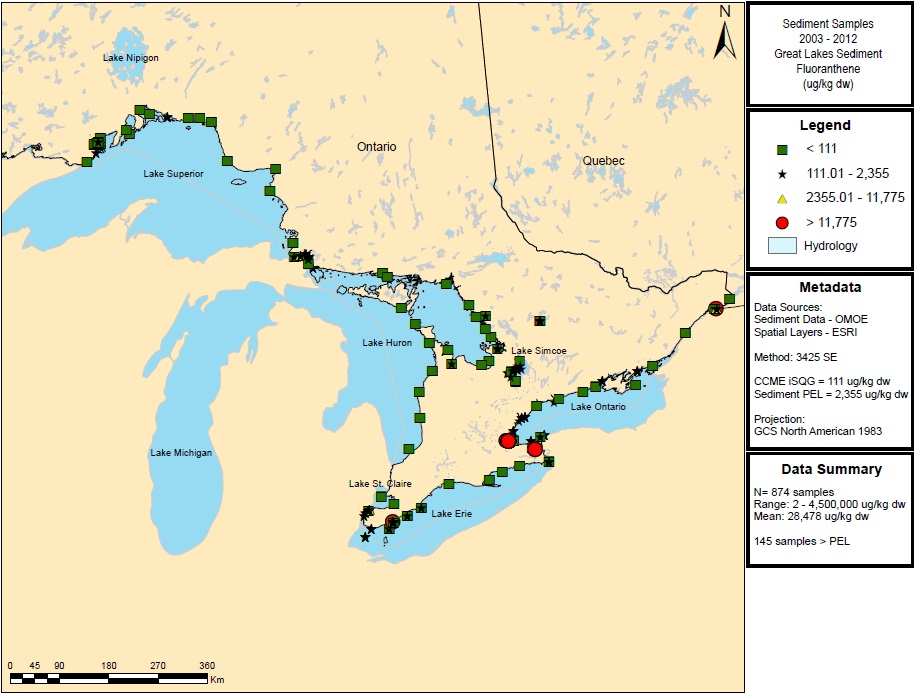
Figure 19: Concentrations of indeno(1,2,3-c,d)pyrene in sediments (2003–2012). Source: Ontario Ministry of the Environment and Climate Change
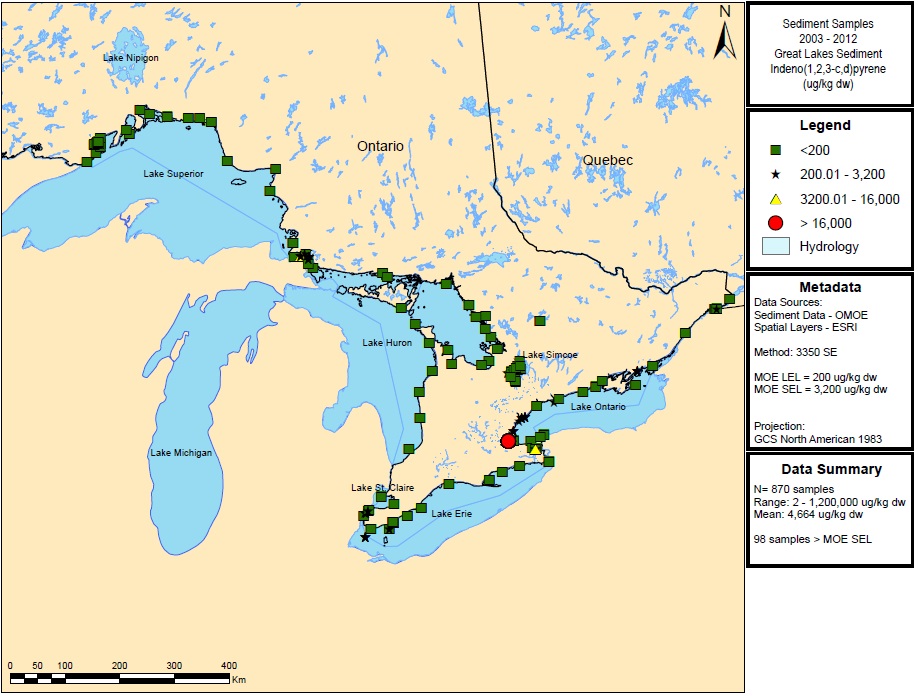
Figure 20: Concentrations of phenanthrene in sediments (2003–2012). Source: Ontario Ministry of the Environment and Climate Change
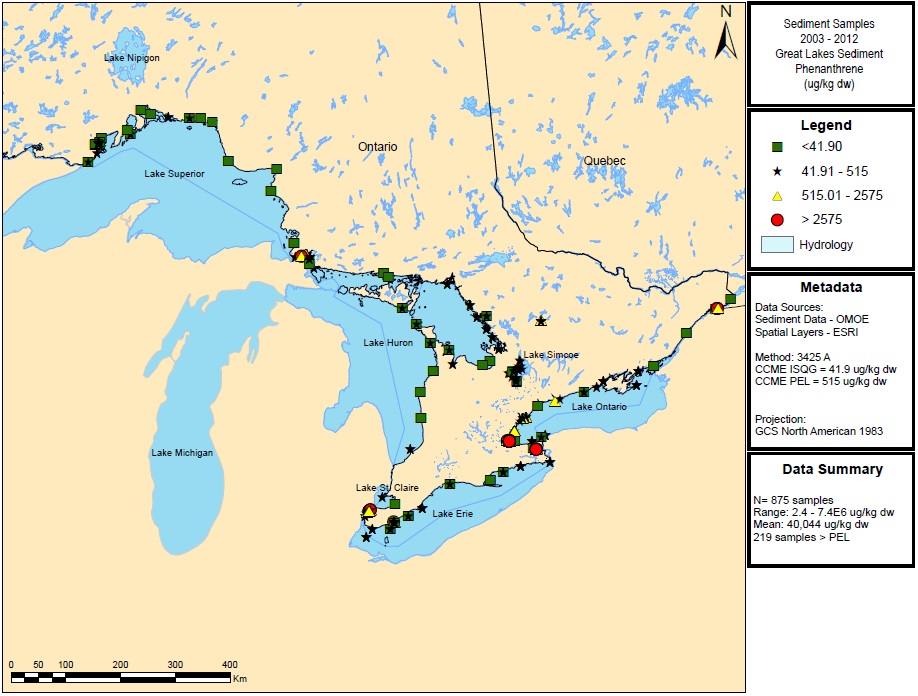
Figure 21: Concentrations of pyrene in sediments (2003–2012). Source: Ontario Ministry of the Environment and Climate Change
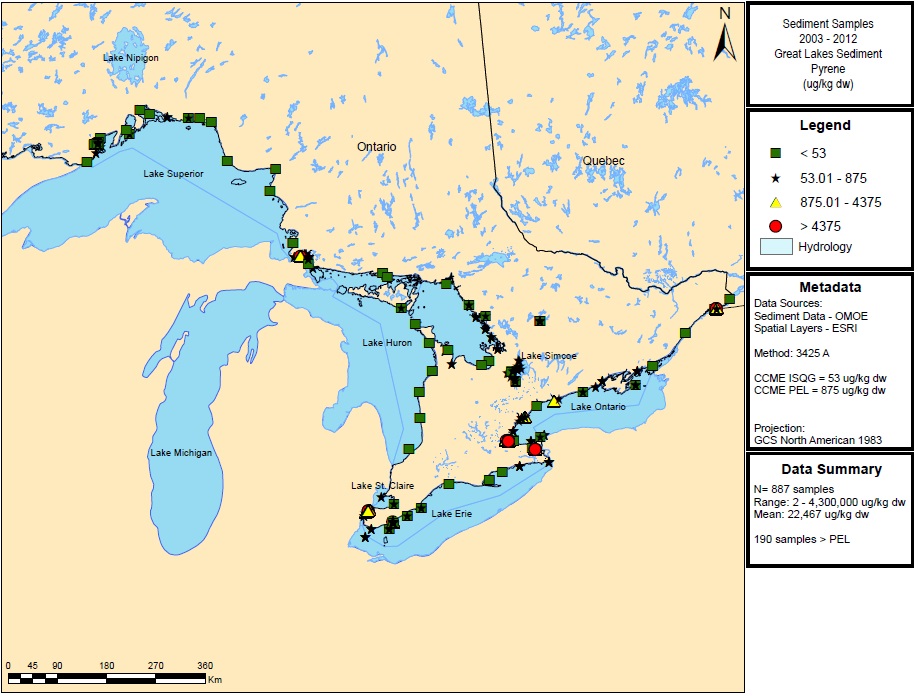
Fish
- Fish can metabolize PAHs. As result, PAHs generally do not accumulate in fish tissues. Therefore, there is no routine monitoring of fish for PAHs.
Herring Gull eggs
- PAHs have not been shown to accumulate in Herring Gull eggs and, therefore, they have not been measured.
Tools and tactics for reducing PAH concentrations in the environment
A number of regulatory and non-regulatory initiatives have been taken to reduce PAH concentration levels in the Great Lakes.
Legislation and regulations
Select PAHs are on the Toxic Substances List – Schedule 1 of the Canadian Environmental Protection Act, 1999. A number of national risk management tools have reduced anthropogenic PAH releases, including:
- Environmental performance agreements
- Environmental codes of practice
- Design guidelines
PAHs are on the list of prescribed toxic substances under Ontario’s Toxics Reduction Act, 2009. The Act and its regulation require the province’s manufacturing and mineral processing facilities that meet specific thresholds to:
- Undertake yearly toxic substance accounting and reporting, including reports on PAHs.
- Look for opportunities to reduce the use and creation of prescribed toxic substances by developing reduction plans.
- Make summaries of the plan available to the public.
Implementation of plans is voluntary.
Programs
- Residential wood burning accounts for up to 99.9 per cent of non-industrial PAH releases in Ontario. Both the U.S. and Canada make it a priority to address pollution due to wood burning. Both countries have residential wood combustion outreach and education programs.
- Additional measures to reduce PAHs in the environment include: the “Burn It Smart!” campaign, the Ontario Tire Stewardship Program and the implementation of control technologies by the petroleum refining sector.
- Site-specific remediation activities are also managing point sources of PAHs in the Great Lakes environment, specifically PAH-contaminated sediments.
Remedial action plans
- Remedial Action Plans for Areas of Concern and Lakewide Action and Management Plans (LAMPs) include activities to address PAH contamination in each of the Great Lakes; for example, at Thunder Bay Harbour in Lake Superior and Hamilton Harbour in Lake Ontario.
Agreements
- Internationally, Canada is party to multilateral environmental agreements that aim to reduce the levels of harmful substances getting into the environment. The agreements include the Convention on Long-range Transboundary Air Pollution (UNECE, 2013). It provides guidance on controls and best available techniques for reducing PAH emissions.
By supporting this convention, Canada is helping to reduce out-of-basin sources and long range atmospheric transport and deposition of toxic substances into the Great Lakes Basin.
Summary
The major sources of PAHs in the Great Lakes are industrial emissions and residential wood combustion. The highest levels of PAHs are still associated with large urban centres.
PAHs continue to be present at concentrations of concern in water and sediment in the Great Lakes due to their persistence.
Conclusion
The Canadian federal government and the Ontario government, with their partners, have implemented risk management, research, monitoring and surveillance programs. These have been critical to reducing concentrations of Tier 1 and Tier 2 chemicals in the Great Lakes.
Under the 2014 COA and the GLWQA, 2012, these cooperative and coordinated actions are continuing – aimed at reducing or eliminating releases of harmful pollutants, including chemicals of concern and chemicals of mutual concern, into the Great Lakes Basin.
For more information
Alternative Formats
This document, or the information that it contains, is available, on request, in alternative formats. Please forward all requests for alternative formats to:
Service Ontario at 1-800-668-9938 (TTY: 1-800-268-7095).
References
ATSDR (Agency for Toxic Substances and Disease Registry). 1994. Toxicological Profile for 4,4’-Methylenebis(2-chloroaniline) MBOCA.
ATSDR (Agency for Toxic Substances and Disease Registry). 1995. Toxicological Profile for Polycyclic Aromatic Hydrocarbons. U.S. Department of Health and Human Services. Public Health Service. Agency for Toxic Substances and Disease Registry. Available at: Toxicological Profile for Polycyclic Aromatic Hydrocarbons
ATSDR (Agency for Toxic Substances and Disease Registry). 1998a. Toxicological Profile for Chlorinated Dibenzo-p-dioxins. U.S. Department of Health and Human Services. Public Health Service. Agency for Toxic Substances and Disease Registry. Available at: Toxicological Profile for Chlorinated Dibenzo-p-dioxins
ATSDR (Agency for Toxic Substances and Disease Registry). 1998b. Toxicological Profile for 3,3’-Dichlorobenzidine. U.S. Department of Health and Human Services. Public Health Service. Agency for Toxic Substances and Disease Registry. Available at: Toxicological Profile for 3,3’-Dichlorobenzidine
ATSDR (Agency for Toxic Substances and Disease Registry). 1999. Toxicological Profile for Mercury. U.S. Department of Health and Human Services. Public Health Service. Agency for Toxic Substances and Disease Registry. Available at: Toxicological Profile for Mercury
ATSDR (Agency for Toxic Substances and Disease Registry). 2000. Toxicological Profile for Polychlorinated Biphenyls (PCBs). U.S. Department of Health and Human Services. Public Health Service. Agency for Toxic Substances and Disease Registry. Available at: Toxicological Profile for Polychlorinated Biphenyls (PCBs)
ATSDR (Agency for Toxic Substances and Disease Registry). 2001. Toxicological Profile for Pentachlorophenol. U.S. Department of Health and Human Services. Public Health Service. Agency for Toxic Substances and Disease Registry. Available at: Toxicological Profile for Pentachlorophenol
ATSDR (Agency for Toxic Substances and Disease Registry). 2005a. Toxicological Profile for Tin and Tin Compounds. U.S. Department of Health and Human Services. Public Health Service. Agency for Toxic Substances and Disease Registry. Available at: Toxicological Profile for Tin and Tin Compounds
ATSDR (Agency for Toxic Substances and Disease Registry). 2005b. Toxicological Profile for Alpha-, Beta-, Gamma-, and Delta-Hexachlorocyclohexane. U.S. Department of Health and Human Services. Public Health Service. Agency for Toxic Substances and Disease Registry. Available at: Toxicological Profile for Alpha-, Beta-, Gamma-, and Delta-Hexachlorocyclohexane
ATSDR (Agency for Toxic Substances and Disease Registry). 2006. Toxicological Profile for Dichlorobenzenes. U.S. Department of Health and Human Services. Public Health Service. Agency for Toxic Substances and Disease Registry. Available at: Toxicological Profile for Dichlorobenzenes
ATSDR (Agency for Toxic Substances and Disease Registry). 2007. Toxicological Profile for Lead. U.S. Department of Health and Human Services. Public Health Service. Agency for Toxic Substances and Disease Registry. Available at: Toxicological Profile for Lead
ATSDR (Agency for Toxic Substances and Disease Registry). 2012. Toxicological Profile for Cadmium. U.S. Department of Health and Human Services. Public Health Service. Agency for Toxic Substances and Disease Registry. Available at:Toxicological Profile for Cadmium
ATSDR (Agency for Toxic Substances and Disease Registry). 2013. Draft Toxicological Profile for Hexachlorobenzene. U.S. Department of Health and Human Services. Public Health Service. Agency for Toxic Substances and Disease Registry. Available at: Toxicological Profile for Hexachlorobenzene
BC MOE. 1997. Ambient Water Quality Guidelines for Chlorophenols – First Update. Overview Report. British Columbia Ministry of the Environment. Available at: Ministry of Environment - Environmental Protection Division
Bhavsar, S.P., Jackson, D.A., Hayton, A., Reiner, E.J., Chen, T. and J. Bodnar. 2007. Are PCB Levels in Fish from the Canadian Great Lakes Still Declining? J. Great Lakes Res. 33: 592-605.
Bhavsar, S.P., Awad, E., Fletcher, R., Hayton, A., Somers, K.M., Kolic, T., MacPherson, K., and E.J. Reiner. 2008. Temporal trends and spatial distribution of dioxins and furans in lake trout or lake whitefish from Canadian Great Lakes. Chemosphere 73: S158-S165.
Bowling, J. W., Leversee, G. J., Landrum, P. F., and J.P. Giesy. 1983. Acute mortality of anthracene contaminated fish exposed to sunlight. Aquat. Toxicol. 3(1): 79–90.
Burniston D., Klawunn, P., Backus, S., Hill, B., Dove, A., Waltho, J., Richardson, V., Struger, J., Bradley, L., McGoldrick, D., and C. Marvin. 2012. Spatial distributions and temporal trends in pollutants in the Great Lakes 1968–2008. Water Quality Research Journal of Canada 46.4: 269–289.
CCME (Canadian Council of Ministers of the Environment). 1997. Canadian Soil Quality Guidelines for the Protection of Environmental and Human Health: Pentachlorophenol.
CCME (Canadian Council of Ministers of the Environment). 1999a. Canadian Environmental Quality Guidelines.
CCME (Canadian Council of Ministers of the Environment). 1999b. Canadian Sediment Quality Guidelines for the Protection of Aquatic Life: Lead.
CCME (Canadian Council of Ministers of the Environment). 1999c. Canadian Water Quality Guidelines for the Protection of Aquatic Life: Polycyclic Aromatic Hydrocarbons (PAHs). Available at: Polycyclic Aromatic Hydrocarbons
CCME (Canadian Council of Ministers of the Environment). 1999d. Canadian Water Quality Guidelines for the Protection of Aquatic Life: Chlorinated Benzenes: 1,4-Dichlorobenzene. Available at: Chlorinated Benzenes 1,4-dichlorobenzene
CCME (Canadian Council of Ministers of the Environment). 1999e. Canadian Water Quality Guidelines for the Protection of Agricultural Water Uses. Organotins: tributyltin, triphenyltin, tricyclohexyltin. Available at: Organotins
CCME (Canadian Council of Ministers of the Environment). 1999f. Canadian Sediment Quality Guidelines for the Protection of Aquatic Life: Lindane (Hexachlorocyclohexane).
CCME (Canadian Council of Ministers of the Environment). 2001. Canadian Sediment Quality Guidelines for the Protection of Aquatic Life: Polychlorinated dibenzo-p-dioxins and polychlorinated dibenzofurans (PCDD/Fs).
CCME (Canadian Council of Ministers of Environment). 2003a. Canadian Water Quality Guidelines for the Protection of Aquatic Life: Mercury (Inorganic Mercury and Methylmercury).
CCME (Canadian Council of Ministers of the Environment). 2003b. Environmental Code of Practice for On-Road Heavy-Duty Vehicle Emission Inspection and Maintenance Programs. PN1328. Available at: Environmental Code of Practice
CCME (Canadian Council of Ministers of the Environment). 2009. Canadian Sediment Quality Guidelines for the Protection of Aquatic Life: Polychlorinated biphenyls.
CCME (Canadian Councils of Ministers of the Environment). 2012. Code of Practice for Residential Wood Burning Appliances.
CCME (Canadian Council of Ministers of the Environment). 2014. Canadian Water Quality Guidelines for the Protection of Aquatic Life: Cadmium.
CEC (Commission for Environmental Cooperation). 2011. North American Strategy for Catalyzing Cooperation on Dioxins and Furans, and Hexachlorobenzene.
CEC (Commission for Environmental Cooperation). 2013a. North American Regional Action Plan on Mercury Close-out Report. May 2013.
CEC (Commission for Environmental Cooperation). 2013b. North American Regional Action Plan on Lindane and Other Hexachlorocyclohexane Isomers. Available at: Final Evaluation Report.
CEC (Commission for Environmental Cooperation). 2014a. Burning Agricultural Waste: A Source of Dioxins.
CEC (Commission for Environmental Cooperation). 2014b. Wood Burning: A Source of Dioxins.
CIELAP (Canadian Institute for Environmental Law and Policy). 2007. Hazardous Waste in Ontario: Progress and Challenges. 2007 Status Report.
CleanFARMS. 2014. CleanFARMS Programs. Obsolete Pesticide & Livestock Medication.
COA. (Canada-Ontario Agreement Respecting the Great Lakes Basin Ecosystem). 1994. Section 4.2 Prevent and Control Pollution. April 1, 1994. Cited in: Canadian Institute for Environmental Law and Policy. 1999. Troubled Waters? A Review of the Performance of the Governments of Canada and Ontario under the Canada-Ontario Agreement Respecting the Great Lakes Basin Ecosystem. Available at: Troubled Waters?
COA. (Canada-Ontario Agreement Respecting the Great Lakes Basin Ecosystem). 2007. Annexes to the Agreement: Areas of Concern, Harmful Pollutants, Lakewide Management, and Monitoring and Information Management.
COA (Canada-Ontario Agreement Respecting the Great Lakes Basin Ecosystem). 2011. 2007–2010 Progress Report. Available at:
COA. (Canada-Ontario Agreement Respecting the Great Lakes Basin Ecosystem). 2014. Draft Canada-Ontario Agreement on Great Lakes Water Quality and Ecosystem Health. Accessed August 26, 2015.
de Solla, S.R., Weseloh, D.V.C., Hughes, K.D. and D.J. Moore. Submitted. 40 Year Decline of Organic Contaminants in Eggs of Herring Gulls (Larus argentatus) from the Great Lakes, 1974 to 2013.
Dove, A., Painter, S. and J. Kraft. 2003.Sediment Quality in Canadian Lake Ontario Tributaries: Part One (West of the Bay of Quinte). A Screening-level Survey. Environment Canada. Report No. ECB/EHD-OR/03-01/I.
ECHA (European Chemicals Agency). 2008. Member State Committee. Support Document for Identification of Anthracene as a Substance of Very High Concern. Available at: ECHA
Environment Canada. 2001a. Environmental Code of Practice for Integrated Steel Mills. CEPA 1999 Code of Practice. First Edition. EPS 1/MM/7. March 2001. Available at: Environmental Code of Practice for Integrated Steel Mills
Environment Canada. 2001b. Environmental Code of Practice for Non-Integrated Steel Mills. CEPA 1999 Code of Practice. First Edition. EPS 1/MM/8. March 2001. Available at: Environmental Code of Practice for Non-Integrated Steel Mills
Environment Canada. 2003. Follow-up Report on Five PSL1 Substances for Which There Was Insufficient Information to Conclude Whether the Substances Constitute a Danger to the Environment. 1,2-Dichlorobenzene, 1,4-Dichlorobenzene, Trichlorobenzenes, Tetrachlorobenzenes, Pentachlorobenzene.
Environment Canada. 2004a. Canadian In-Use Vehicle Emissions Reduction Programs. November 2004. Prepared by D. Cope Enterprises. Prepared for Transportation Systems Branch, Environment Canada. Available at: Canadian In-Use Vehicle Emissions Reduction Programs
Environment Canada. 2004b. Industrial Treated Wood Users Guidance Document.
Environment Canada. 2004c. Recommendations for the Design and Operation of Wood Preservation Facilities, 2004. Technical recommendations document. Report EPS 2/WP/6.
Environment Canada. 2009. Environment Canada’s Gasoline Regulations. Discussion Paper Proposing Indeterminate Exemption for the Use of Leaded Gasoline in Competition Vehicles.
Environment Canada and Health Canada. 2010a. Risk Management Strategy for Mercury.
Environment Canada. 2010b. Risk Management Strategy for Mercury-Containing Products. Accessed May 2, 2014.
Environment Canada. 2010c. What goes up must come down. Open burning of garbage is harmful to your health and the environment. Available at: Safer Alternatives
Environment Canada. 2013a. Great Lakes Water Quality Agreement.
Environment Canada. 2013b. National Fish Contaminants Monitoring and Surveillance Program.
Environment Canada. 2013c. List of Toxic Substances Managed Under CEPA (Schedule 1): Mirex. Available at: Dodecachloropentacyclo
Environment Canada. 2013d. National Pollutant Release Inventory – Facility Reported Data and Air Pollutant Emissions Data. 1990–2012.
Environment Canada. 2013e. Environmental Performance Agreements and Results. Accessed May 8, 2014.
Environment Canada. 2013f. Thunder Bay Area of Concern.
Environment Canada. 2013g. Risk Management Tools. Accessed May 8, 2014. Available at: Polychlorinated dibenzodioxins
Environment Canada. 2013h. Risk Management Tool(s). Accessed May 9, 2014. Available Hexachlorobenzene.
Environment Canada. 2013i. Supplementary Guide for Reporting to the National Pollutant Release Inventory-Alternate Thresholds. 2000.
Environment Canada. 2013j. Inorganic Cadmium Compounds. Accessed July 4, 2014.
Environment Canada. 2013k. List of Toxic Substances Managed Under CEPA (Schedule 1): 3,3’-Dichlorobenzidine.
Environment Canada. 2013l. Tributyltins. Accessed July 15, 2014.
Environment Canada. 2013m. Pollutants Accessed July 7, 2014.
Environment Canada. 2013n. Supplementary Guide for Reporting to the National Pollutant Release Inventory – Alternate Thresholds. 2000.
Environment Canada. 2013o. Hamilton Harbour Area of Concern. Remedial Action Plan Status. Available at: Hamilton Harbour Area of Concern
Environment Canada. 2014a. Areas of Concern. Thunder Bay Harbour.
Environment Canada. 2014b. Areas of Concern. Spanish Harbour.
Environment Canada. 2014c. Areas of Concern. Peninsula Harbour.
Environment Canada. 2014d. Areas of Concern. St. Clair River.
Environment Canada. 2014e. 2008–2010 Progress Report on PCB Regulations.
Environment Canada. 2014f. Personal communications to Ontario Ministry of the Environment and Climate Change. PCB Inventory Progress Report. July 2014.
Environment Canada. 2014g. Areas of Concern. Wheatley Harbour.
Environment Canada. 2014h. Areas of Concern. Hamilton Harbour.
Environment Canada and Ontario MOE. 2011. Detroit River Area of Concern. Canadian Section. Status of Beneficial Use Impairments. September 2010. Available at: Detroit River Area of Concern
FAO/UNEP (Food and Agriculture Organization of the United Nations/ United Nations Environment Programme). 2013. Rotterdam Convention PIC Circular XXXVIII. Available at: PIC Circular
Friends of the St. Clair River. 2010. BPAC (Binational Public Advisory Council). Sediments. Accessed May 2, 2014. Available at: BPAC
Galarneau, E., Bidleman, T.F. and P. Blanchard. 2006. Seasonality and interspecies differences in particle/gas partitioning of PAHs observed by the Integrated Atmospheric Deposition Network (IADN). Atmospheric Environment 40: 182–197.
GC (Government of Canada). 1990. Polychlorinated Dibenzodioxins and Polychlorinated Dibenzofurans. Canadian Environmental Protection Act Priority Substances List Assessment Report. Environment Canada and Health Canada, Ottawa. Available at: Priority Substances List Assessment Report No. 1.
GC (Government of Canada). 1993. Hexachlorobenzene. Canadian Environmental Protection Act Priority Substances List Assessment Report. Environment Canada and Health Canada, Ottawa. Available at: Priority Substances List Assessment Report.
GC (Government of Canada). 2009. Proposed Risk Management Approach for Non-Pesticidal Organotin Compounds.
GC (Government of Canada). 2010. Regulations Amending the Gasoline Regulations. SOR/2010-134 June 17, 2010.
GC (Government of Canada). 2012. Prohibition of Certain Toxic Substances Regulations, 2012 (SOR/2012-285).
GC/EC/HC. 1993a. Priority Substances List Assessment Report. 1,4-Dichlorobenzene. Government of Canada/Environment Canada/Health Canada. Available at: 1,4-Dichlorobenzene
GC/EC/HC. 1993b. Canadian Environmental Protection Act. Priority Substances List Assessment Report. 3,3’-Dichlorobenzidine.
GC/EC/HC. 1994. Canadian Environmental Protection Act, Priority Substances List Assessment Report. Polycyclic Aromatic Hydrocarbons. Available at: Priority Substances List Assessment Report
Gewurtz, S.B., Shen, L., Helm, P.A., Waltho, J., Reiner, E.J., Painter, S., Brindle, I.D. and C.H. Marvin. 2008. Spatial Distributions of Legacy Contaminants in Sediments of Lakes Huron and Superior. J. Great Lakes Res. 34: 153–168.
Gewurtz, S.B., Bhavsar, S.P., Jackson, D.A., Fletcher, R., Awad, E., Moody, R. and E.J. Reiner. 2010. Temporal and spatial trends of organochlorines and mercury in fishes from the St. Clair River/Lake St. Clair corridor, Canada. J. Great Lakes Res. 36: 100–112.
GLBTS (Great Lakes Binational Toxics Strategy). 2004a. Canada-United States Strategy for the Virtual Elimination of Persistent Toxic Substances in the Great Lakes.
GLBTS (Great Lakes Binational Toxics Strategy). 2004b. Strategy/Implementation Plan for Reducing the Prevalence of Household Garbage Burning (Barrel Burning) in Rural Areas of the Great Lakes.
GLBTS (Great Lakes Binational Toxics Strategy). 2009. Biennial Report.
Health Canada. 2005. State of the Science Report for a Screening Health Assessment Report. 4,4’-Methylenebis(2-chlorobenzenamine) (MBOCA). CAS No. 101-14-4. Available at:4,4’-Methylenebis(2-chlorobenzenamine)
Health Canada. 2009. Lead Information Package – Some Commonly Asked Questions About Lead and Human Health. Environment and Workplace Health.
Health Canada. 2010a. Re-evaluation Decision: Tributyltin Compounds.
Health Canada. 2010b. Re-evaluation Note. Lindane Risk Assessment. Available at: Lindane Risk Assessment and Lake St. Clair.
Health Canada. 2011. Re-evaluation Decision. Heavy Duty Wood Preservatives: Creosote, Pentachlorophenol, Chromated Copper Arsenate (CCA) and Ammoniacal Copper Zinc Arsenate (ACZA). RVD2011-06. 22 June 2011. Available at: Heavy Duty Wood Preservatives .
Health Canada. 2013a. Form-2. Form for submission of information specified in Annex E to the Stockholm Convention pursuant to Article 8 of the Convention. 11 January 11, 2013. Available Pentachlorophenol.
Health Canada. 2013b. Re-evaluation Note. Heavy Duty Wood Preservative (HDWP) – Risk Management Plan. REV2013-05. 5 September 2013. Available at: Heavy Duty Wood Preservative (HDWP) – Risk Management Plan.
IADN (Integrated Atmospheric Deposition Network). 2008. Cooperating to Implement the Great Lakes Water Quality Agreement. Mis en oeuvre de L’accord sur la qualité de l’eau des Grand Lacs. Technical Summary of Progress of the Integrated Atmospheric Deposition Network (IADN), 2002–2008. United States–Canada IADN Scientific Steering Committee. October 2008. Available at: The Great Lakes.
IARC (International Agency for Research on Cancer).1974. 3,3-Dichlorobenzidine. In: Some Aromatic Amines, Hydrazine and Related Substances, N-Nitroso Compounds and Miscellaneous Alkylating Agents. IARC Monographs on the Evaluation of Carcinogenic Risk of Chemicals to Humans, Vol. 4. Lyon, France. pp. 49–55.
IARC (International Agency for Research on Cancer). 1987. IARC Monographs on the Evaluation of Carcinogenic Risks to Humans. 3,3'-Dichlorobenzidine. Volumes 1–109. Available at: Agents Classified by the IARC Monographs, Volumes 1–116.
IARC (International Agency for Research on Cancer). 1999. Polychlorophenols and Their Sodium Salts.
IARC (International Agency for Research on Cancer). 2012. IARC Monographs on the Evaluation of Carcinogenic Risks to Humans. Cadmium and cadmium compounds. Volumes 1–109. Available at: Agents Classified by the IARC Monographs, Volumes 1–116
IARC (International Agency for Research on Cancer). 2013. IARC Monographs-105. 1,3-Dinitropyrene. Available at: 1,3-Dinitropyrene
IARC MWG (International Agency for Research on Cancer Monograph Working Group). 2012. Carcinogenicity of Diesel-engine and Gasoline-engine Exhausts and Some Nitroarenes. The Lancet 13: 663-664.
IJC (International Joint Commission). 2013. 16th Biennial Report on Great Lakes Water Quality: Assessment of Progress Made Towards Restoring and Maintaining Great Lakes Water Quality since 1987. Available at: Biennial Reports
Kaminsky, R. and R.A. Hites. 1984. Octachlorostyrene in Lake Ontario: Sources and Fates. Environ. Sci. Technol. 18(4): 275–279.
Kluke, A.L. 2011. Dieldrin concentrations in Great Lakes sediment: Spatial and temporal trends. A major research paper presented to Ryerson University in partial fulfillment of the requirements for the degree of Master of Spatial Analysis.
LAMP (Lakewide Action and Management Plan). 2000. Lake Michigan Lakewide Action and Management Plan.
LAMP (Lakewide Action and Management Plan). 2004. Lake Erie Lakewide Management Plan. 2004 Update. Available at: Lake Erie
LAMP (Lakewide Action and Management Plan). 2008. Lake Huron Binational Partnership: 2008–2010 Action Plan. Available at: The Great Lakes
LAMP (Lakewide Action and Management Plan). 2012a. Lake Superior Lakewide Management Plan: 1990-2010. Critical Chemical Reduction Milestones. Available at: Lake Superior
LAMP (Lakewide Action and Management Plan). 2012b. Lake Superior Lakewide Management Plan: Zero Discharge Demonstration Program.
LAMP (Lakewide Action and Management Plan). 2013a. Lake Michigan Lakewide Management Plan: Annual Report 2013. Available at: Lake Michigan.
LAMP (Lakewide Action and Management Plan). 2013b. Lake Superior Lakewide Management Plan: Annual Report 2013. Available at: Lake Superior
Lampi, M.A., Gurska, J., McDonald, K.I.C., Xie, F., Huang, X-D., Dixon, D.G. and B.M. Greenberg. 2006. Photoinduced toxicity of polycyclic aromatic hydrocarbons to Daphnia magna: Ultraviolet-mediated effects and the toxicity of polycyclic aromatic hydrocarbon photoproducts. Environmental Toxicology and Chemistry 25(4): 1079–1087.
Maguire, R.J. 1984. Butyltin Compounds and Inorganic Tin in Sediments in Ontario. Environ. Sci. Technol. 18(4): 291–294.
Maguire, R.J. and S.P. Batchelor. 2005. Survey for Tributyltin in Water and Sediment in Canada in 1999. Water Qual. Res. J. Canada. 40(4):431-447.
Marvin, C.H., Charlton, M.N., Stern, G.A., Braekevelt, E., Reiner, E.J. and S. Painter. 2003. Spatial and Temporal Trends in Sediment Contamination in Lake Ontario. J. Great Lakes Res. 29(2): 317–331.
Marvin, C., Painter, S., Williams, D., Richardson, V., Rossmann, R., and P. Van Hoof. 2004. Spatial and temporal trends in surface water and sediment contamination in the Laurentian Great Lakes. Environmental Pollution 129(1): 131–144.
Melymuk, L., Robson, M., Csiszar, S.A., Helm, P.A., Kaltenecker, G., Backus, S., Bradley, L., Gilbert, B., Blanchard, P., Jantunen, L.M. and M.L. Diamond. 2014. From the City to the Lake: Loadings of PCBs, PBDEs, PAHs and PCMs from Toronto to Lake Ontario. Environmental Science & Technology. Web publication 8 Jan. 2014.
MOE (Ministry of the Environment). 2008. Guidelines for Identifying, Assessing and Managing Contaminated Sediments in Ontario: An Integrated Approach. May 2008. PIBS 6658e.
MOE (Ministry of the Environment). 2013. Guide to Eating Ontario Fish, 2013–2014. Twenty-seventh Edition, Revised. Queen’s Printer for Ontario. ISBN 978-4606-0819-7. Available at: Eating Ontario Fish
MOEE (Ministry of Environment and Energy). 1994. Water Management. Policies, Guidelines, Provincial Water Quality Objectives of the Ministry of the Environment and Energy. July 1994. PIBS 3303E. Available at: Water management policies.
MOJ (Minister of Justice). 2014a. Consolidation – Gasoline Regulations SOR/90-247. Current to January 23, 2014. Available at: Gasoline Regulations
MOJ (Minister of Justice). 2014b. Consolidation – PCB Regulations SOR/2008-273. Current to January 14, 2014. Available at: Consolidation – PCB Regulations
NADP (National Atmospheric Deposition Program). 2013. National Atmospheric Deposition Program, 2012 Annual Summary. NADP Data Report 2013-01. Illinois State Water Survey, University of Illinois at Urbana-Champaign, IL. Available at: National Atmospheric Deposition Program, 2012
NCBI (National Center for Biotechnology Information). 2012a. Benzo(a)pyrene Substance Summary. Pub Chem Substances. The U.S. National Library of Medicine. Available at: 1,2-Benzpyrene.
NCBI (National Center for Biotechnology Information). 2012b. Pub Chem Substance. The U.S. National Library of Medicine. Available at: NCBI.
OTS (Ontario Tire Stewardship). 2014. Ontario’s Disappearing Used Tire Piles. Available at: Rethink.
Ouyang, G., Zhao, W., Bragg, L., Qin, Z., Alaee, M. and J. Pawliszyn. 2007. Time-weighted average water sampling in Lake Ontario with solid-phase microextraction passive samplers. Environ. Sci. Technol. 41: 4026–4031.
PMA (Polyurethane Manufacturing Association). 2010. MOCA Safe Use Guidance for the Castable Polyurethane Industry. September 2010 Revision.
PMRA (Pest Management Regulatory Agency). 1999. Regulatory Directive DIR99-03. The Pest Management Regulatory Agency’s Strategy for Implementing the Toxic Substances Management Policy. Available at: Regulatory Directive DIR99-03
SIDS. 2013. SIDS Initial Assessment Profile.
SOLEC (State of the Lakes Ecosystem Committee). 2011. State of the Great Lakes 2011. Prepared by Environment Canada and the U.S. Environmental Protection Agency. ISSN 2292–1222.
Sun, P., Blanchard, P., Brice, K.A. and R.A. Hites. 2006a. Trends in Polycyclic Aromatic Hydrocarbon Concentrations in the Great Lakes Atmosphere. Environ Sci Technol 40: 6221–6227.
Sun, P., Backus, S., Blanchard, P. and R.A. Hites. 2006b. Annual Variation of Polycyclic Aromatic Hydrocarbon Concentrations in Precipitation Collected Near the Great Lakes. Environ Sci Technol 40: 696–701.
Szalinska, E., Drouillard, K.G., Anderson, E.J. and G.D. Haffner. 2011. Factors influencing contaminant distribution in the Huron-Erie Corridor sediments. Journal of Great Lakes Research 37: 132–139.
Transport Canada. 2010. Anti-fouling Systems.
UNECE (United Nations Economic Commission for Europe). 1998. Protocol to the 1979 Convention on Long-range Transboundary Air Pollution.
UNECE (United Nations Economic Commission for Europe). 2009a. Guidance document on best available techniques for reducing emissions of POPs from major stationary sources. Appendix. Adopted 2009. Available at: UNECE.
UNECE (United Nations Economic Commission for Europe). 2009b. Appendix: Guidance Document on Best Available Techniques to Control Emissions of Persistent Organic Pollutants from Major Stationary Sources. Available at: Protocol on Persistent Organic Pollutants
UNECE (United Nations Economic Commission for Europe). 2010a. Exploration of management options for Dicofol. Paper for the 8th meeting of the UN-ECE CLRTAP Task Force on Persistent Organic Pollutants, Montreal 18–20 May 2010. Available at: Exploration of management options for Dicofol
UNECE (United Nations Economic Commission for Europe). 2010b. The 1998 Protocol on Persistent Organic Pollutants, Including the Amendments Adopted by the Parties on 18 December 2009. Available at: UNECE
UNECE (United Nations Economic and Social Council). 2013. Guidance Document on Best Available Techniques for Controlling Emissions of Heavy Metals and Their Compounds from the Source Categories Listed in Annex II to the Protocol on Heavy Metals. Available at: UNECE.
UNEP (United Nations Environment Programme). 2010. Draft final review of scientific information on lead. Available at: UNEP
UNEP (United Nations Environment Programme). 2009. Stockholm Convention on Persistent Organic Pollutants (POPs) as amended in 2009. Text and Annexes. Available at: Stockholm Convention website.
UNEP (United Nations Environment Programme) 2011a. Basel Convention on the Control of Transboundary Movements of Hazardous Wastes and their Disposal. Available at: UNEP
UNEP (United Nations Environment Programme). 2011b. Basel Convention. Updated general technical guidelines for the environmentally sound management of wastes consisting of, containing or contaminated with persistent organic pollutants (POPs). Available at: UNEP
UNEP (United Nations Environmental Programme). 2011c. Report of the Conference of the Parties to the Stockholm Convention on Persistent Organic Pollutants. Fifth meeting. Available at: Stockholm.
UNEP (United Nations Environmental Programme). 2011d. Rotterdam Convention on the Prior Informed Consent Procedure for Certain Hazardous Chemicals and Pesticides in International Trade. Text and Annexes. Revised in 2011. Available at: Rotterdam Convention website.
UNEP (United Nations Environment Programme). 2011e. Proposal to list Pentachlorophenol and its salts and esters in Annexes A, B and/or C to the Stockholm Convention on Persistent Organic Pollutants. Persistent Organic Pollutants Review Committee. Seventh meeting. Available at: Stockholm.
UNEP (United Nations Environment Programme). 2013. Minamata Convention on Mercury. Text and Annexes. October 2013.
UNEP (United Nations Environment Programme). 2014. Minamata Convention on Mercury. Countries. Accessed May 2, 2014. Available at: Minamata Convention on Mercury.
U.S. EPA (United States Environmental Protection Agency). 2000a. U.S. Challenge on Alkyl-lead: Report on Use of Alkyl-lead in Automotive Gasoline. Great Lakes Binational Toxics Strategy.
U.S. EPA (United States Environmental Protection Agency). 2000b. Draft PBT National Action Plan for Octachlorostyrene. Available at: Federal Register Website.
U.S. EPA (United States Environmental Protection Agency). 2000c. 4,4’-Methylenebis(2-chloroaniline) (MBOCA). Hazard Summary. Available at: Health Effects Notebook for Hazardous Air Pollutants
U.S. EPA (United States Environmental Protection Agency). 2002. PBT National Action Plan for Alkyl-lead. The U.S. Environmental Protection Agency (EPA) Persistent, Bioaccumulative, and Toxic Pollutants (PBT) Program. Available at: PBT National Action Plan for Alkyl-lead
U.S. EPA (United States Environmental Protection Agency). 2006a. Lindane Voluntary Cancellation and RED Addendum Fact Sheet. July 2006. Accessed July 7, 2014.
U.S. EPA (United States Environmental Protection Agency). 2006b. Pesticide News Story: Remaining Lindane Registrations Cancelled. December 2006. Accessed July 7, 2014. Available at: Pesticides: Reregistration
U.S. EPA (United States Environmental Protection Agency). 2008a. Reregistration Eligibility Decision for the Tributyltin Compounds: Bis(tributyltin) oxide, Tributyltin benzoate, and Tributyltin maleate (Case 2620). EPA 739-R-08-005. June 2008. Available at: National Service Center for Environmental Publications
U.S. EPA (United States Environmental Protection Agency). 2008b. Registration Eligibility Decision for Pentachlorophenol.
U.S. EPA (United States Environmental Protection Agency). 2010. Advance Notice of Proposed Rulemaking on Lead Emissions from Piston-Engine Aircraft Using Leaded Aviation Gasoline.
U.S. EPA (United States Environmental Protection Agency). 2011a. Alkyl-Lead. Persistent Bioaccumulative and Toxic (PBT) Chemical Program.
U.S. EPA (United States Environmental Protections Agency). 2011b. Persistent Bioaccumulative and Toxic (PBT) Chemical Program – Dioxins and Furans.
U.S. EPA (United States Environmental Protection Agency). 2011c. National Emissions Inventory.
U.S. EPA (United States Environmental Protection Agency). 2012a. Basic Information about Benzo(a)pyrene in Drinking water. Water: Basic Information about Regulated Drinking Water Contaminants. Available online: Drinking Water Contaminants – Standards and Regulations
U.S. EPA (United States Environmental Protection Agency). 2012b. Great Lakes Binational Toxics Strategy.
U.S. EPA (United States Environmental Protection Agency). 2012c. Great Lakes Fish Monitoring – Open Lakes Trend Monitoring Program. Available at: Great Lakes Fish Monitoring and Surveillance.
U.S. EPA (United States Environmental Protection Agency). 2012d. Priority Chemicals. Anthracene. Available at: U.S. EPA website.
U.S. EPA (United States Environmental Protection Agency). 2013a. Burn Wise Changeout Program. Available at: U.S. EPA website.
U.S. EPA (United States Environmental Protection Agency). 2013b. Update to an Inventory of Sources and Environmental Releases of Dioxin-like Compounds in the United States for the years 1987, 1995, and 2000. EPA/600/R-11/005A. January 2013 External Review Draft.
U.S. EPA (United States Environmental Protection Agency). 2013c. Basic Information. Available Mercury.
U.S. EPA (United States Environmental Protection Agency). 2013d. The Mercury and Air Toxics Standards (MATS). Regulatory Actions.
U.S. EPA (United States Environmental Protections Agency). 2014. Wastes – Non-Hazardous Waste – Municipal Solid Waste. Air Emissions from MSW Combustion Facilities. Available at: Advancing.
Van der Zande, A. 2010. Exploration of Management Options for Pentachlorophenol (PCP). 2010. Paper for the 8th meeting of the UNECE CLRTAP Task Force on Persistent Organic Pollutants, Montreal, 18–20 May 2010. Draft dated 22 March 2010. Available at: Exploration of Management Options for Pentachlorophenol (PCP)
Weseloh, D.V.C., Moore, D. and R. Letcher. 2010. Canadian Wildlife Service Great Lakes Herring Gull Egg Monitoring Program: Trends in Emerging and Legacy Contaminant Levels in Herring Gull Eggs. GLBTS, 2008–2009.
Weseloh, D.V.C., Moore, D., Hebert, C.E., de Solla, S.R., Braune, B.M. and D.J. McGoldrick. 2011. Current Concentrations and Spatial and Temporal Trends in Mercury in Great Lakes Herring Gull Eggs, 1974–2009. Ecotoxicology 20: 1644–1658.
WHO (World Health Organization). 2005. Tin and Inorganic Tin Compounds. Concise International Chemical Assessment Document 65. Available at: Evaluation of Environmental Effects
Wood Heat Organization Inc. 2013. What Was the Burn It Smart! Program. Available at: Wood Heat Organization Inc.
XCG. 2007. Best Management Practices. 1,4-Dichlorobenzene, 3,3-Dichlorobenzidine, Hexachlorobenzene, and Pentachlorophenol. Non-Sector Specific Practices. Prepared for the Ministry of the Environment. March 6, 2007. PIBS 6212e.
Yang, F. and R.J. Maguire. 2000. Occurrence and Seasonal Variation of Tributyltin in Marinas on Lake Ontario, Canada. Water Qual. Res. J. Canada 35(4): 681–691.
This report also includes information that staff at the Ontario Ministry of the Environment and Climate Change conveyed through personal communications (email, telephone, meetings).
Appendix A: Toxics Reduction Act, 2012 reporting facilities within the Great Lakes–St. Lawrence Basin