Minister’s 10-Year Report on Lake Simcoe
Read about the progress made under the Lake Simcoe Protection Plan to protect and restore Lake Simcoe.
Minister's message
Clean water is vital to the health of our environment and communities across Ontario. People from the Lake Simcoe region know this well. Over the years, it has become clear that human activities like urban development, agriculture and recreation have impacted the lake's health, and that's why organizations, community groups, local advocates, and all levels of government have come together to restore and protect this crucial watershed.
This collaboration resulted in the establishment of the Lake Simcoe Protection Act in 2008, the first watershed-specific legislation in Canada, followed by the release in 2009 of the Lake Simcoe Protection Plan, Ontario's first watershed protection plan. Together, the act and plan outline actions and targets for environmental improvements in Lake Simcoe.
The restoration of Lake Simcoe and its watershed was also a key commitment in our government's Made-in-Ontario Environment Plan, as part of a broader effort to protect water resources in the province.
This report marks a significant milestone for Lake Simcoe: it showcases actions implemented under the Lake Simcoe Protection Plan in the last five years, showing progress in key areas of concern. This includes a 50 per cent reduction in phosphorus from sewage treatment plants entering the watershed since 2009, decreased amounts of algae, and successful reproduction of cold-water fish such as lake trout, although at lower levels than historically. These results are very encouraging, but there is more work to be done.
The following sections describe the significant progress made towards the key priorities which are critical to achieving the targets and objectives set out in the Lake Simcoe Protection Plan, such as improving water quality and restoring aquatic life. Each priority area is supported by data and trends collected from several provincial monitoring programs, and supplemented with data from partners such as the Lake Simcoe Region Conservation Authority.
You will read about our work with partners on a number of initiatives, including a project aimed at reducing the amount of stormwater runoff associated with urban development, and work to investigate plastic contamination in the environment and its impacts on fish health. Another ongoing initiative is developing training and education on the use of road salt for de-icing, as well as best management tools for inspecting and maintaining septic systems to reduce the movement of contaminants into local lakes and rivers.
Through the Lake Simcoe Protection Plan, we will continue to focus on improving the lake's water quality, restoring key natural heritage features, and addressing the impacts of invasive species and other threats such as climate change. This includes continuing to invest annually in the implementation of the Lake Simcoe Protection Plan and building on previous successes.
I want to thank the local conservation authorities, Indigenous communities, municipalities, agricultural and commercial sectors and residents who have worked tirelessly on implementing actions to protect and restore the ecological health of Lake Simcoe. I also want to thank the Lake Simcoe Coordinating Committee and the Lake Simcoe Science Committee for their advice on where our efforts need to be focused. This ongoing work requires collaboration and I look forward to continuing this important partnership with you.
I am proud of the progress we have made together to improve the health of Lake Simcoe and its watershed and I look forward to continuing the vital work of protecting this great inland lake over the next 10 years and beyond.
Jeff Yurek
Minister of the Environment, Conservation and Parks
Executive summary - a lake in change
Protecting and restoring Ontario's water resources, including Lake Simcoe and its watershed, is a key part of the Ontario government's Made-in-Ontario Environment Plan. The Lake Simcoe Protection Plan (the plan) provides a roadmap for restoring the health of Lake Simcoe.
Over the past 10 years, Ontario and its partners have implemented a wide range of actions to help to protect and improve the ecological health of the Lake Simcoe watershed. We are seeing some improvements in overall lake health, such as increased dissolved oxygen in the deep waters of the lake, which is a positive step towards our desired outcome of restoring and sustaining a cold water fish community.
This consolidated report, which addresses both five-year and annual reporting requirements under the Lake Simcoe Protection Act, 2008, describes the collaborative efforts taken to implement the Lake Simcoe Protection Plan, as well as results of monitoring programs and progress towards the plan's objectives.
The sections following the executive summary cover:
- Actions taken under the key priority areas to address the issues most critical to the health of Lake Simcoe, supported by data and trends from monitoring programs:
- restoring aquatic life
- improving water quality
- understanding variability in a changing climate
- protecting and enhancing natural heritage
- addressing invasive species
- A summary of considerations for the next 10 years
- Advice from the Minister's Lake Simcoe Coordinating and Science Committees (see appendix)
A stressed ecosystem
A wide range of interrelated pressures have impacted Lake Simcoe. Changes to the natural landscape and stressors such as nutrient inputs, invasive species and climate change, caused significant impairment to the lake, resulting in fisheries collapse, poor water quality, and degraded habitats.
Since the first visible signs of stress in the lake were observed, such as abundant plant and algae growth and fish declines in the 1970's, the Province has consistently collected data on important indicators of lake and watershed health, such as dissolved oxygen. The information collected set the foundation for many of the policies and targets outlined in the plan, and we now have long-term data records spanning over 30 years.
Building on past actions
The plan builds on efforts to protect and restore the lake that began in the 1980s, and continues to focus on a partnership approach. Cooperative actions are being taken by watershed partners including all levels of government, First Nations and Métis communities, local conservation authorities, Ontario universities, local non-governmental organizations, as well as property owners and visitors to the watershed. Three provincial ministries collaborate to guide plan implementation and to monitor changes in our environment that indicate progress from our efforts:
- The Ministry of the Environment, Conservation and Parks coordinates the adaptive management of the plan and delivers work related to the management, conservation, and protection of water resources, as well as climate change mitigation and adaptation. The ministry also collaborates with the Lake Simcoe Region Conservation Authority to collect long-term water quality data in the tributaries of the watershed, and in the lake (most of which can be found on Ontario's Data Catalogue).
- The Ministry of Natural Resources and Forestry leads monitoring and research, and delivers on-the-ground work related to fisheries management, natural heritage (e.g. woodlands, wetlands) and important ecological areas (e.g. shorelines), invasive species and biodiversity.
- The Ministry of Agriculture, Food and Rural Affairs leads work related to the preservation and enhancement of agricultural lands, nutrient-management planning and soil conservation, and local agricultural production in the watershed. They also monitor data on agricultural trends in the watershed using Statistics Canada products such as the Census of Agriculture.
The current programs are adaptable to changing conditions in the watershed and new information, to ensure we take the best action to manage threats. All ministries regularly review monitoring requirements and priorities to ensure that the right data is being collected to inform the adaptive management process, and that monitoring efforts are not being duplicated.
Changing context
Much has changed in the watershed since the plan came into effect:
- The population in the watershed has grown by more than 100,000. Rapid urbanization has resulted in an increase in impervious surfaces such as paved roads, and a slight decline in natural cover.
- The plan set a target of 40 per cent high-quality natural cover, and while there were minimal woodland and wetland losses between 2005 to 2015, defining what constitutes "high quality" natural cover has taken time. We now have a robust "high quality of natural cover index", a composite measure based on several individual indicators of quality. Improving the quality of natural cover remains a challenge as most of the land in the watershed is privately-owned.
- In 2009, the plan's primary focus to improve water quality was on phosphorus reduction. While this is still a priority, our monitoring efforts show that our scope must expand to include other water quality issues, such as chloride contamination from winter road salt.
- A key focus in 2009 was on ensuring sufficient flow of water in rivers and streams to sustain aquatic ecosystems; now, climate change-induced extreme weather events have raised the need for solutions that can build resiliency across the watershed. While we were aware of climate change as a stressor in 2009, we are now seeing direct local impacts, such as a reduction in the ice-covered period of the lake during the winter.
Progress to date
As we continue our monitoring programs, we track improvements and changes in the key indicators of the plan and assess our targets. Our monitoring is showing some encouraging signs of improvement for the lake, demonstrating that ongoing remedial efforts are having an impact:
- Phosphorus loads from sewage treatment plants in the watershed have been reduced by approximately 50 per cent since 2009.
- Total spring and ice-free (May through October) phosphorus concentrations in the lake have been consistently low since the 2015 Five-Year Report, and have dropped significantly from 1980 to 2018.
- The amount of algae (measured as chlorophyll-a) in the lake has also decreased over time, leading to improved water quality, which has remained stable through much of the watershed since the 2015 Five-Year Report.
- Dissolved oxygen concentrations in the deep, cold water of the lake, which is the key habitat for cold-water fish, have increased since 1980, helping support cold-water fish populations, such as lake trout.
- For the cold-water fish community, monitoring has shown that lake trout, lake whitefish, and cisco continue to successfully reproduce, although the wild populations of these species are dominated by only a few year classes (fish produced in the same year), and are at lower levels than historically.
Charting the course ahead
In the 10 years since the launch of the plan, our understanding of the complex interplay of stressors and potential solutions has improved. We have evidence to support new actions and new management tools are ready to be applied. The data trends reinforce the need for a comprehensive approach to understand and manage the cumulative effects of multiple stressors. The pressures are unlikely to diminish as the population around the lake continues to grow, demand for water resources increases, and climate change modifies the lake's ecosystem. Our commitment to adaptive management requires we reflect on what has worked, identify where there are gaps and opportunities, and determine if updates to the plan are needed to combat the existing pressures on the lake.
Lessons learned from 10 years of implementation and new evidence gathered is informing our first comprehensive review of the plan in 2019–2020, as required under the Lake Simcoe Protection Act, 2008. This report provides key information to support discussions during the review of the plan and may inform recommendations for amendments within the adaptive management framework.
Plan priority: restoring aquatic life
As recognized in the Made-in-Ontario Environment Plan and the Lake Simcoe Protection Plan, the health of aquatic life and fish communities in particular, is a key indicator of the overall health of the aquatic ecosystem. The plan seeks to improve habitats for aquatic life and to protect and restore aquatic communities throughout the watershed by improving the management and stewardship of these resources.
Lake Simcoe is host to a warm-water fish community and a cold-water fish community. Warm-water fish, such as bass, perch, minnows, and catfishes, live in the shallower, nearshore areas of the lake, where the water is warmer. The offshore, deep areas of the lake are home to cold-water fish such as lake trout, cisco, lake whitefish, and burbot. These fish require cold, deep, and well-oxygenated water to survive and thrive.
The management of Lake Simcoe's fisheries is the responsibility of the Ministry of Natural Resources and Forestry, which is committed to an adaptive approach. The ministry receives fisheries management advice and recommendations from two Lake Simcoe fisheries committees:
- The Lake Simcoe Fisheries Management Committee is a government committee made up of experts from science, policy, and operations that provides advice to fisheries managers related to the ecological health of Lake Simcoe and its fisheries resources. The committee reviews information collected on the lake and evaluates progress towards meeting Lake Simcoe's Fish Community Objectives (described below).
- The Lake Simcoe Fisheries Stakeholder Committee is an external committee comprised of individuals representing a broad range of fisheries interests from stakeholder organizations, Indigenous communities, individual ice hut operators, and local environmental organizations. The committee provides advice and recommendations to the Ministry of Natural Resources and Forestry on the management of the fisheries resources of Lake Simcoe. The committee also takes an active role in promoting fisheries stewardship within the watershed to improve the health of the fish communities.
Taking action to restore aquatic life
The Ministry of Natural Resources and Forestry and their partners have taken important steps to manage Lake Simcoe's fish community over the last 10 years. The Lake Simcoe Fish Community Objectives (the objectives) were developed in 2011 to provide a comprehensive set of objectives to guide collective efforts to manage the fish community and fisheries resources of the Lake Simcoe watershed. The ultimate goal of this work is “a fish community reflective of a healthy and restored ecosystem where socio-economic and cultural benefits of the fishery are realized now and into the future”. To support this goal, the Ministry of Natural Resources and Forestry with its partners, have implemented the following key actions:
- A review of the cold-water fish stocking program was conducted in 2018 to evaluate the current stocking program, review potential stocking options, and determine future stocking management direction. This is a key component of the adaptive management approach to encourage natural reproduction of native species such as lake trout, and supports achieving a self-sustaining fishery with sustainable harvest opportunities.
- Data from long term aquatic monitoring programs are being used to measure progress towards the Fish Community Objectives and to inform fisheries management decisions such as stocking levels and recreational fishing limits. For example, the cisco fishery was reopened in 2015 after a 13-year closure, based on monitoring evidence that showed a positive trend in cisco populations.
- Tributary habitats are being identified for protection and restoration for species such as brook trout.
The Ministry of Natural Resources and Forestry has created programs and projects to actively engage many community groups to raise awareness. For example, the ministry ran a multi-year lake trout classroom hatchery program in partnership with the Chippewas of Georgina Island First Nation's Waabgon Gamig elementary school, Morning Glory Public School in Innisfil, and the Lake Simcoe Region Conservation Authority. The curriculum-based education program was developed to engage students on hands-on restoration efforts and teach them about lake biodiversity and aquatic habitat, thus fostering future environmental stewards. Students learned about the life cycle of lake trout while watching them grow in an aquarium in their school. They learned of the importance of aquatic plants and wetlands and their relation to a healthy aquatic community in Lake Simcoe. Students gained hands-on restoration experience by releasing their fish in the spring and by participating in planting events in Georgina Island's Gerties Creek.
Efforts are being made to restore lost elements of the fish community, such as muskellunge. The ministry established the Lake Simcoe Muskellunge Restoration Program in 2005 in partnership with key groups such as Muskies Canada, Fleming College, Orillia Fish and Game, and the Ontario Federation of Anglers and Hunters. Once plentiful in the lake, it is believed that by the 1930s the species was almost extirpated in Lake Simcoe. This was due to a variety of reasons, including overharvest from a prior commercial fishery and habitat loss.
The objective was to re-establish a self-sustaining muskellunge population through long-term collaborative restoration, including habitat enhancement, stocking efforts and effectiveness monitoring, in alignment with several Lake Simcoe Protection Plan objectives. Monitoring to support the program has included netting, genetic analysis, eDNA sampling, electrofishing, visual observations and the support of Muskies Canada Inc. members through targeted angling permitted under a Scientific Collectors Licence.
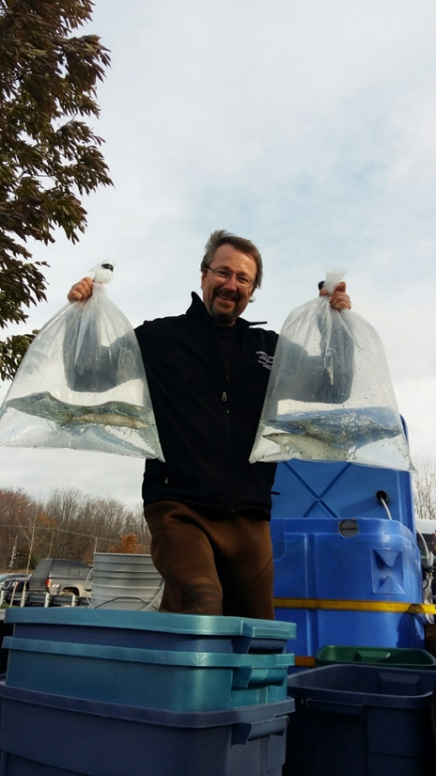
A total of 20,159 muskellunge were stocked into Lake Simcoe over the duration of the program (Figure 1). One Georgian Bay strain of muskellunge (a strain that was stocked into Lake Simcoe) was sampled while electro-fishing in Lake Simcoe in 2016, which is a positive initial sign in assessing the success of stocking efforts over time. Re-establishment of populations can take years to be observed and tracked, especially for long-lived species such as muskellunge. As monitoring efforts (including netting, genetic analysis, eDNA sampling, electrofishing, and visual observations) provide important information about program outcomes, they will guide next steps for the program.
Monitoring aquatic life
The Ministry of Natural Resources and Forestry has designated Lake Simcoe as a 'Provincially Significant Inland Fishery', due to its social, economic, and ecological importance. This designation enables the development of a unique fisheries monitoring and management approach for Lake Simcoe. The ministry's aquatic monitoring program on Lake Simcoe includes:
- assessments of small fish biodiversity, where ministry staff gather information on the near shore fish community, allowing resource managers to understand species richness, diversity, abundance and spatial distribution
- offshore benthic index netting, where staff set nets in mid-summer at the bottom of the lake to monitor relative abundance of cold-water fishes such as lake trout, lake whitefish and cisco
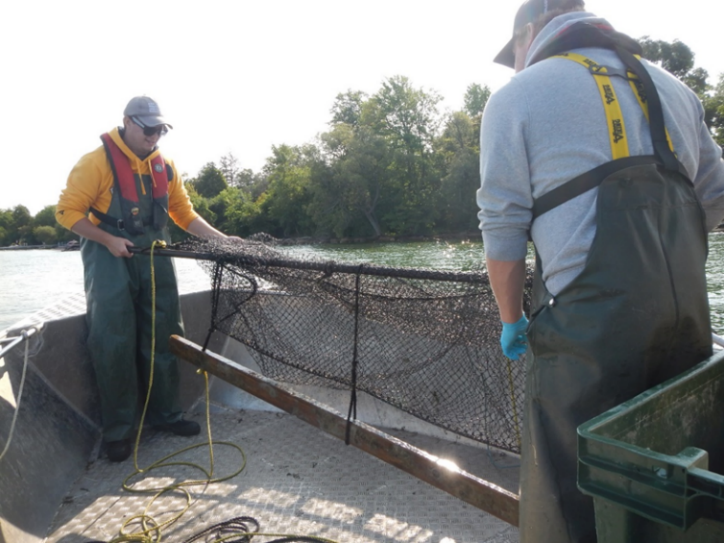
- nearshore community index netting, where staff assess the relative abundance of key warm-water species such as yellow perch, smallmouth bass, largemouth bass and northern pike (Figure 2)
- surveys of anglers in the winter and summer, to measure fishing effort, catch and harvest of fish
- annual hydroacoustic (i.e. fisheries sonar) surveys, conducted since 2011 on Lake Simcoe, to assess the pelagic (open-water and offshore) fish community
Monitoring has shown that cisco, a native prey fish for lake trout that was once in steep decline in the lake, is showing positive signs of recovery. This finding supported the re-opening of a conservative winter fishery for cisco in 2015. Young cisco have been observed in this survey every year since then, with higher numbers in 2018. The hydroacoustic surveys continue to support management decisions. For example, the hydroacoustic surveys showed that there is a strong prey base available for lake trout, which was pertinent information for the lake trout stocking review.
Innovative aquatic life research
The Ministry of Natural Resources and Forestry conducts innovative research on aquatic life in Lake Simcoe, with several ongoing research projects informing fisheries management priorities. Some new and emerging studies carried out by the ministry include:
- A warm-water species diet study was carried out in 2017 to capture a variety of nearshore warm-water species using multiple gear types. Stomach contents were analyzed to understand the diet of fish species and improve our understanding of the aquatic food web. Studies such as these help us understand how invasive species, such as round goby, are being integrated into the larger aquatic food web following invasion. More broadly, fish diet studies are important for assessing the health of fish populations. For example, they help show whether there is sufficient food for sport fishes and show whether fish are able to respond to changes in the ecosystem. These and other monitoring and research activities support a better understanding of the recovery potential of our fisheries resources in Lake Simcoe.
- Experimental trials of the North American index netting method, a standard being used to monitor all provincial aquatic inland lake fishery resources outside of Lake Simcoe, were conducted in the summer of 2018. In contrast to the offshore benthic index netting method, sample site locations are distributed across all depths of the lake providing for a simultaneous evaluation of the warm-, cool- and cold-water fish communities across their complete temperature range. This will permit prediction of actual densities of fish in the lake, which combined with harvest information and spatial context of results (i.e. how do they compare to other similar lakes), allow for improved evaluation of management requirements and outcomes.
- A computer-based ecosystem model of the Lake Simcoe aquatic food web has been collaboratively developed with the Ministry of the Environment, Conservation and Parks, the University of Toronto, and the Lake Simcoe Fisheries Management Committee. It leverages the wealth of monitoring data collected on the lake and is being used to assess the impacts of fishing, fish stocking, phosphorus reduction, and invasive species on cold-water fish populations. The model will also be used to assess alternative management scenarios for the lake's fisheries and enhance our understanding of recent changes to Lake Simcoe fish populations. For example, we learned that the potential recovery of the wild lake trout population has been aided by phosphorus reductions but impeded by invasion of dreissenid mussels and the spiny water flea.
- Research has been conducted on what causes the number of newly hatched (larval) fish (Figure 3) to be high in certain years and low in others. One hypothesis is that larval fish survival is high in years when the peak in zooplankton (their food source) coincides with the hatching of larval fish. Climate change could be changing the timing of the larval fish hatch compared to the timing of the zooplankton peak and invasive species could change the abundance of zooplankton. As part of this project, the diet and growth of larval fish are assessed to examine whether they have sufficient food. A better understanding of the production, development and survival of important sport fish species, and the effects of factors such as climate change and invasive species, will help support sustainable management of recreational fisheries on Lake Simcoe.
Aquatic life outcomes

Using historical records of fishery catches dating back to 1868, researchers have shown that while large, predatory fish like muskellunge, walleye, and lake sturgeon once dominated commercial fishing catches, those species had declined over time to be replaced by smaller species close to the base of the food web. Unsustainable historical commercial fishing in the late 19th and early 20th centuries was likely one of several drivers of early fish population declines on Lake Simcoe, along with later habitat degradation and poor water quality in the mid-20th century. However, when commercial fishing ceased, and the recreational fishery expanded on Lake Simcoe, the trend reversed, and catches began to revert to larger species towards the top end of the food web (e.g. lake trout) once again. In recent years, stocking and invasive species have also altered the sizes, diets and species of fish caught in the recreational fishery.
Cold-water fish community
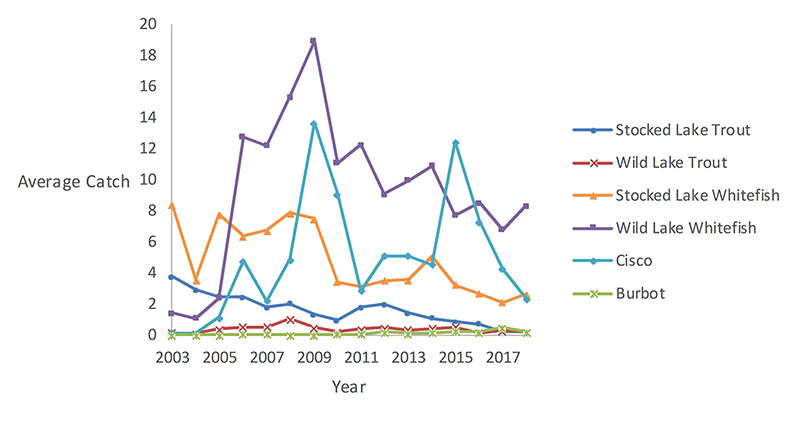
Lake Simcoe's cold-water fish community has shown a range of trends from 2003 to 2018 depending on the species (Figure 4). Catches of wild lake trout in monitoring nets have remained low, but stable, while stocked lake trout catches have declined from 2003 to 2018. Monitoring has also shown that lake trout continue to reproduce, although at low levels. Most wild lake trout are currently large, old fish (15+ years old), suggesting that the last year of strong reproduction was in 2004, although an appreciable number of wild fish were produced in 2013.
While catches of wild lake whitefish in monitoring nets are much higher than 2003 and 2004, both stocked and wild lake whitefish catches have declined since 2009. More wild fish were captured than stocked fish, and, although at least some wild fish were born in most years, fish born in 2004 and 2012 make up most of the wild whitefish population.
Catches of cisco in monitoring nets have been variable since 2003. Research using fisheries sonar (described above) has shown that many young cisco have been produced in certain years (e.g. 2012) but not others. The large numbers of cisco produced in recent years (e.g. 2018) would have been too small to be encountered in the monitoring nets. Burbot catches in monitoring nets have been increasing slightly, although generally few burbot were captured in the nets.
Warm-water fish community
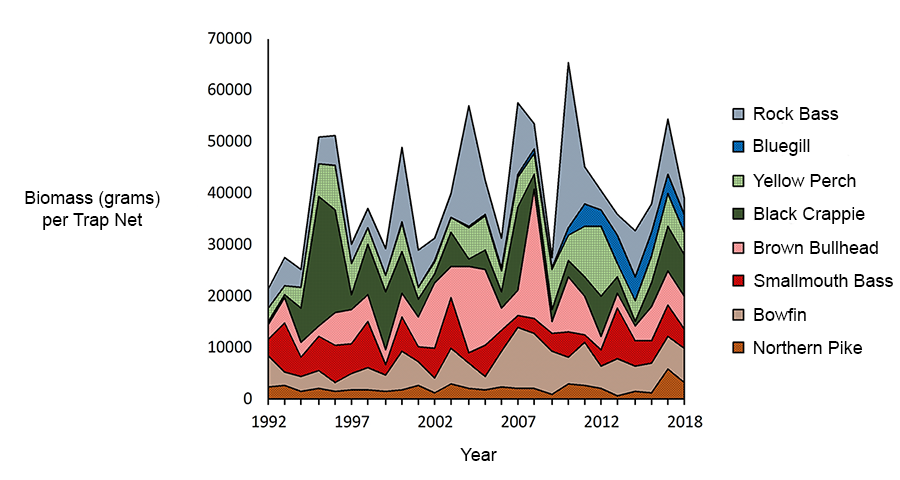
Long-term monitoring of the warm-water fish community shows that the overall weight of the catch (referred to as biomass) of fish in monitoring nets has been stable overall since 1992, with some year to year variability for most species (Figure 5). This overall stability is a sign of a healthy fish community.
The species contributing the most to the overall biomass in 2009–2018 were rock bass, yellow perch and bowfin. When comparing 2009–2018 to 1999–2008, yellow perch and bluegill biomass have increased, while brown bullhead biomass has decreased.
Lake Simcoe sport fishery
The Ministry of Natural Resources and Forestry also surveys anglers on the lake in the summer and winter to measure total angling effort and the number of fish caught. These angler surveys have occurred since 1961 in the winter and 1981 in the summer. Historically, these data showed declines in the catch of lake trout and lake whitefish in the 1960–1970s, and cisco in the 1980–1990s, followed by later increases due to stocking (for lake trout and lake whitefish) and natural reproduction. Also notable was the large increase in winter perch catch since the 1960s.
More recently, the angler surveys showed that the total annual angling effort in Lake Simcoe averaged 980,000 hours from 2009 to 2018. This is a reduction from the 1999–2008 average annual angling effort of approximately 1.2 million hours. There were no noticeable trends in the overall catch of fish (all species in summer and winter) by the fishery between 2009–2018, which averaged 1,136,000 fish annually. Of the annual lake-wide harvest, yellow perch made up 80 per cent of the harvest by number, followed by panfish (8 per cent) and bass (6 per cent) for the period 2009–2018. Ontario residents remain consistently the primary users of the fishery and there has been a substantial increase in the proportion of anglers who day trip to Lake Simcoe during the summer.
As the longest-running fishery monitoring program on the lake, the angler survey provides clues about the status of fish populations and trends in the fishery over the course of decades. For example, while both wild and stocked lake trout and lake whitefish are captured by anglers (a positive indicator for these species and the health of the lake), their current catches remain below historic levels.
Plan priority: improving water quality
Stresses from both urban and rural activities have changed the landscape of the Lake Simcoe watershed, increased the inputs of nutrients and pollutants to the lake, and impaired the ecological functions of the watershed. The primary stressors that degrade water quality in Lake Simcoe include:
- excessive nutrients such as phosphorus, which leads to the increased growth of plants and algae in the lake; when these plants die, they sink to the bottom and decompose, which uses up dissolved oxygen in the deep-waters of the lake
- pollutants and contaminants such as heavy metals, sediments and chlorides
- pathogens (disease-causing microorganisms), such as E. coli
A key objective of the Lake Simcoe Protection Plan is “to reduce the discharge of pollutants to Lake Simcoe and its tributaries”. Protecting and restoring water quality in our lakes is also a key part of the Made-in-Ontario Environment Plan.
The quality of surface and ground water across the Lake Simcoe watershed varies. The Lake Simcoe Region Conservation Authority's most recent Watershed Report Card (2018) indicates that the overall quality of groundwater is fairly consistent and good throughout all of Lake Simcoe's subwatersheds. While the quality of surface water has remained relatively stable since the last Report Card in 2013, there are key stressors in extensively urbanized areas and some agricultural areas. For more information on the standardized set of indicators used by Ontario's conservation authorities in their report cards, visit Watershed Checkup.
Ground and surface water quality in rural and urban environments is affected by both natural processes and anthropogenic influences. In urban environments, the increase of impervious surfaces such as paved roads, leads to an increase in contaminated run-off that can affect water quality. In rural environments, intensive agriculture and poorly maintained septic systems (i.e. in rural areas that do not have centralized municipal servicing), can sometimes result in water quality impairment.
As phosphorus is a key water quality concern in Lake Simcoe, the Province released the Lake Simcoe Phosphorus Reduction Strategy in 2010, to guide efforts by multiple partners to reduce phosphorus loads. The strategy outlined the multiple sources of phosphorus, and recommended actions that not only reduce phosphorus, but other nutrients and pollutants from both rural and urban sources.
Addressing rural stressors
Some of the most productive agricultural land in Canada is found within the Lake Simcoe watershed. Farmland makes up approximately half of the watershed and collectively generates over $450 million in annual agricultural sales. Reducing nutrient loss from agricultural lands while increasing their productivity has been a key focus for the Ministry of Agriculture, Food and Rural Affairs.
Encouraging best management practices in Lake Simcoe polders
Polders, or muck soils, are wetlands that have been drained for agricultural purposes. The Holland Marsh near Bradford West Gwillimbury is the largest of the polders found in the Lake Simcoe watershed. With about 7,000 acres of highly productive muck soils, the Holland Marsh produces $130 million of carrots and $160 million of onions annually, in addition to over 60 different types of other vegetables. While these muck soils are impressive in their productive capacity, they are also susceptible to nutrient loss and can be a contributing source of phosphorus to the watershed lake and tributaries.
The economic and ecological sustainability of the Holland Marsh is contingent on maintaining the quality of its muck soils, and the Ministry of Agriculture, Food and Rural Affairs is committed to their stewardship. In 2012, the Muck Crop Research Station conducted a three-year study on phosphorus fertilizer application rates and use of cover crops in the Holland Marsh. The results of this study emphasized the importance of conducting soil tests for phosphorus to determine additional phosphorus fertilizer requirements. This study also demonstrated the effectiveness of cover crops, even if planted late after carrot and onion harvest, to prevent soil losses from erosion.
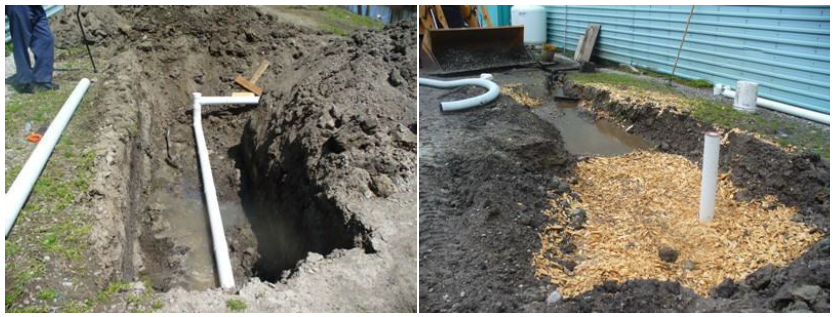
Another agricultural source of phosphorus loss can occur during post-harvest processing. Vegetables after harvest are washed with water and this wash-water can accumulate phosphorus that can then enter the environment. Also, water in agricultural soils is usually drained in perforated pipes called tile drains. Applying treatment technologies to wash water and tile drains can further reduce phosphorus loss, however, these technologies have been cost-prohibitive to implement. The Province has been working collaboratively with farmers to identify a range of technologies and adopt low-cost solutions that will reduce the risk to the environment.
Starting in 2013, the Ministry of Agriculture, Food and Rural Affairs partnered with researchers at the Universities of Waterloo and Windsor to evaluate the effectiveness of low-cost filters to treat phosphorus in water. Results showed that 60 per cent of phosphorus in water can be removed with simple woodchip filled biofilters (Figure 6). This simple solution presents future potential implementation opportunities due to its effectiveness, low cost and low maintenance needs.
Working with farmers – best management practices and demonstration sites
The Ministry of Agriculture, Food and Rural Affairs works directly with farmers and farm organizations to ensure they have access to cutting-edge research and technologies. This involves adapting research to fit farmer needs and extensive education and outreach efforts. Highlights of work with farmers include:
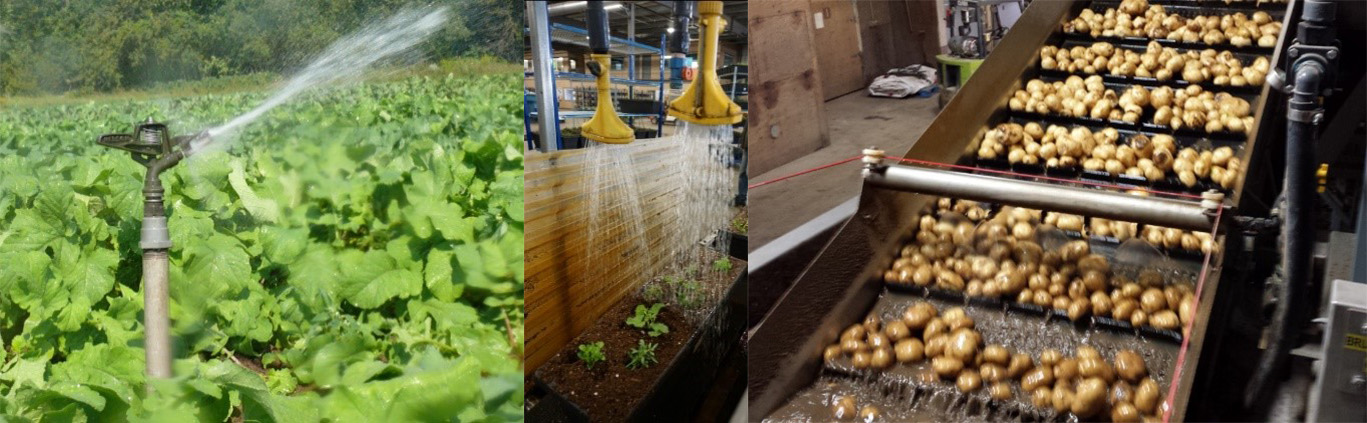
- Water Smart Farming: Efficient water-use is an important element to improving water quality. Precise irrigation ensures crops get the right amount of water when they need it and avoids runoff losses of phosphorus. In partnership with the ministry, Farm and Foodcare Ontario undertook several on-farm water-use assessments to promote and encourage adoption of water conservation practices (Figure 7). The project's goal was to identify cost-efficient and site-specific opportunities to optimize water uses through reduction, reuse and recycling. Farmers and processors that adopted recommended practices were able to achieve water-use savings of 30 to 70 per cent.
- Talbot River Targeted Best Management Practice Demonstration: The Ministry partnered with the Kawartha and Region Conservation Authority to promote the adoption of best management practices that reduce phosphorus loss and soil erosion. Engaging directly with farmers, they supported 34 individual projects in the Talbot river subwatershed. These projects included improvements in manure management, water runoff diversions, fencing to exclude livestock from ecologically sensitive areas, water well stewardship and establishing tree cover on marginal lands prone to phosphorus loss. These projects had immediate benefits and raised awareness of best practice effectiveness within the local community.
Driving adoption of best management practices with strategic incentives
Farmers are natural stewards of their land, but farms are also businesses. Implementing best management practices is usually a clear win-win with environmental and economic benefits. When economic benefits are less clear, incentives are key to enable farmers to implement environmental best management practices. Over the past 10 years, the Ministry of Agriculture, Food and Rural Affairs has worked with partners like the Ontario Soil and Crop Improvement Association to incentivize actions through programs that pay a portion of the costs associated with implementing best management practices. The association recently reviewed the cost-share projects they administered in the Lake Simcoe watershed from 2004 to 2017.
Results confirmed considerable progress. Between 2004 and 2017, over $26 million was invested on 1,248 unique environmental projects. Projects were completed on 376 farms, approximately 22 per cent of all farms in the watershed. These farms collectively invested $15 million of their own money with an additional $11 million in government cost-share funding. As a result:
- about 23 km of fencing was installed to protect and enhance farm habitat
- over 16,000 trees and shrubs were planted
- plans were developed for improved water and nutrient management on approximately 54,000 acres of cropland
- over 90 equipment enhancement projects were completed to improve tillage and fertilizer applications
The progress in implementing best management practices was made possible by the commitment of farmers. Going forward, there are further opportunities to incentivize direct actions on the ground, such as the use of cover crops, equipment modifications to reduce tillage, and adoption of the "4R" Nutrient Stewardship Framework to encourage the right source, rate, time and place for the application of fertilizer, thereby reducing the risk of nutrient loss to waterways.
Agricultural trends in Lake Simcoe
Agricultural trends in the Lake Simcoe watershed were identified through analysis of the Census of Agriculture, a StatsCan product developed every five years. This analysis has indicated that over a 10-year period (2006–2016), agriculture in the Lake Simcoe watershed has experienced similar changes to other areas of Ontario. We are seeing the following trends in agriculture in the watershed:
- The number of farms continues to decrease, while the average farm size increases (Figure 8).
- Farmers are planting more row crops, such as corn and soy, while acres in pasture have significantly decreased (Figure 9).
- The number of livestock and livestock farms is decreasing (Figure 10 and Figure 11).
- Surprisingly with less livestock, there has been an expansion in farmland acres receiving manure applications (Figure 12). This suggests that farmers are applying manure more strategically (i.e. less manure per acre on average) and reducing risk of phosphorus loss.
- The increase in fertilized acres aligns with the increase in annual row crops and corresponds with an increase in farmers utilizing best management practices specific to these production systems. For example, compared to before the Lake Simcoe Protection Plan, there has been a 25 per cent increase in the number of farms using cover crops and reduced tillage practices are implemented on twice as many acres (Figure 13). This is encouraging as cover crops and reduced tillage are key best management practices that effectively build soil health and retain phosphorus on agricultural lands.
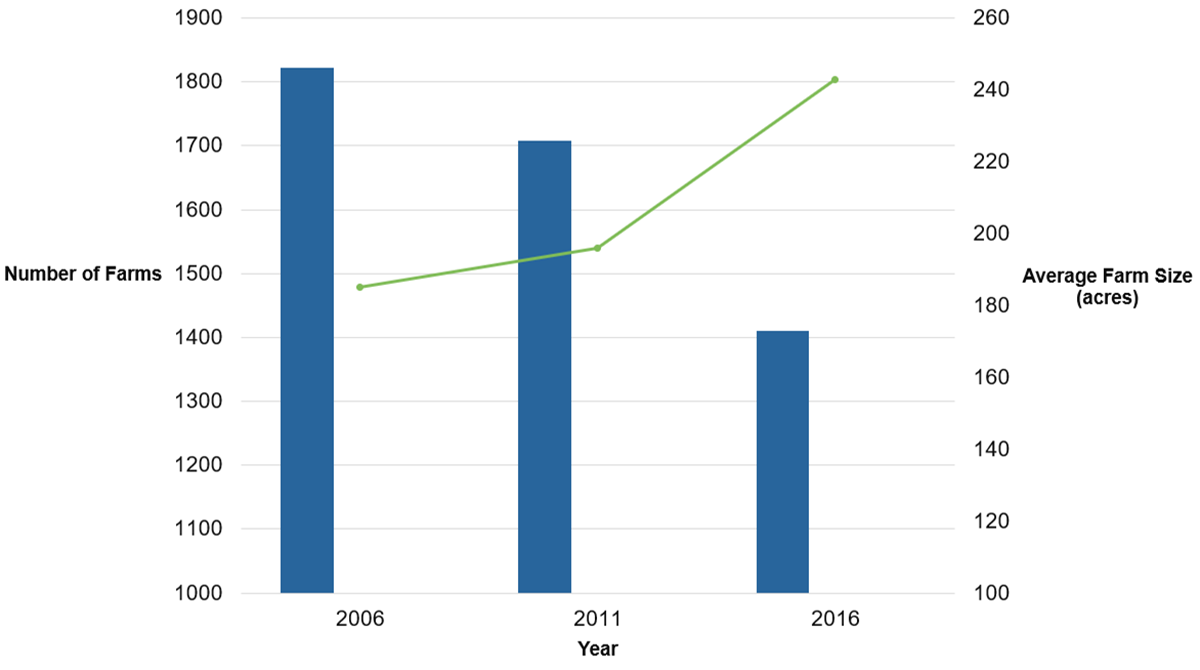
Figure 8: Number of farms and average size of farms in Lake Simcoe watershed. Farm numbers are depicted by bars, and average farm size by line. Data adapted from StatsCan Census of Agriculture 2006 and 2016.
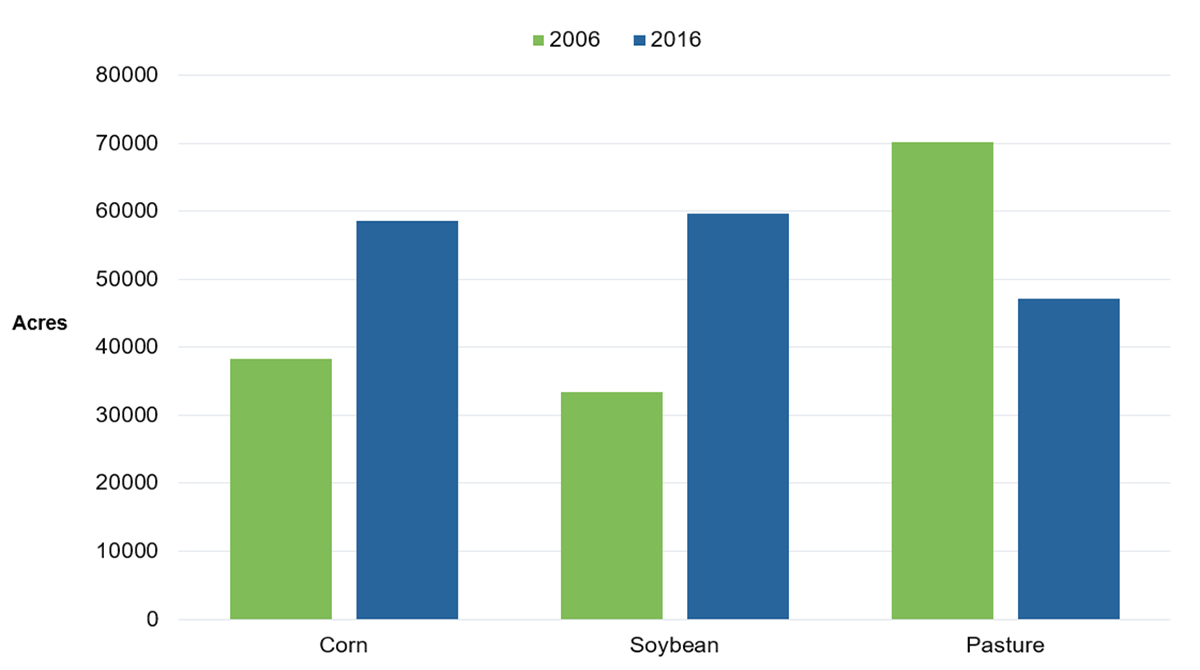
Figure 9: Acres of Corn, Soy and Pasture in Lake Simcoe watershed. Data adapted from StatsCan Census of Agriculture 2006 and 2016.
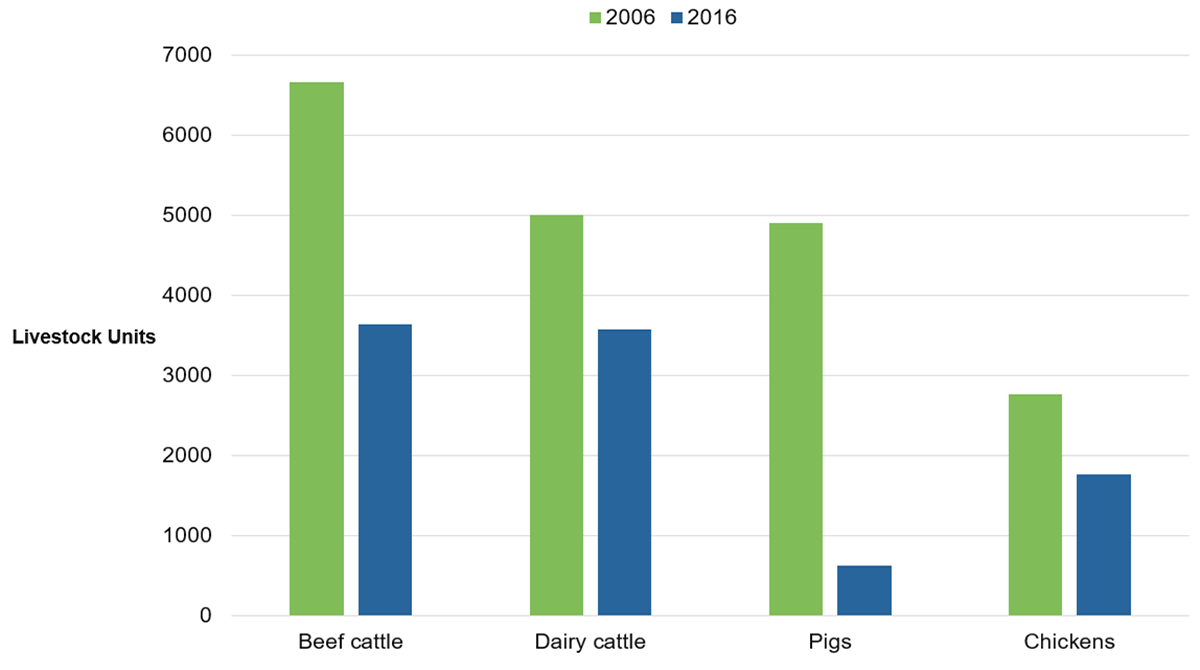
Figure 10: Livestock units for beef, dairy, pigs and chicken in Lake Simcoe watershed. Data adapted from StatsCan Census of Agriculture 2006 and 2016.
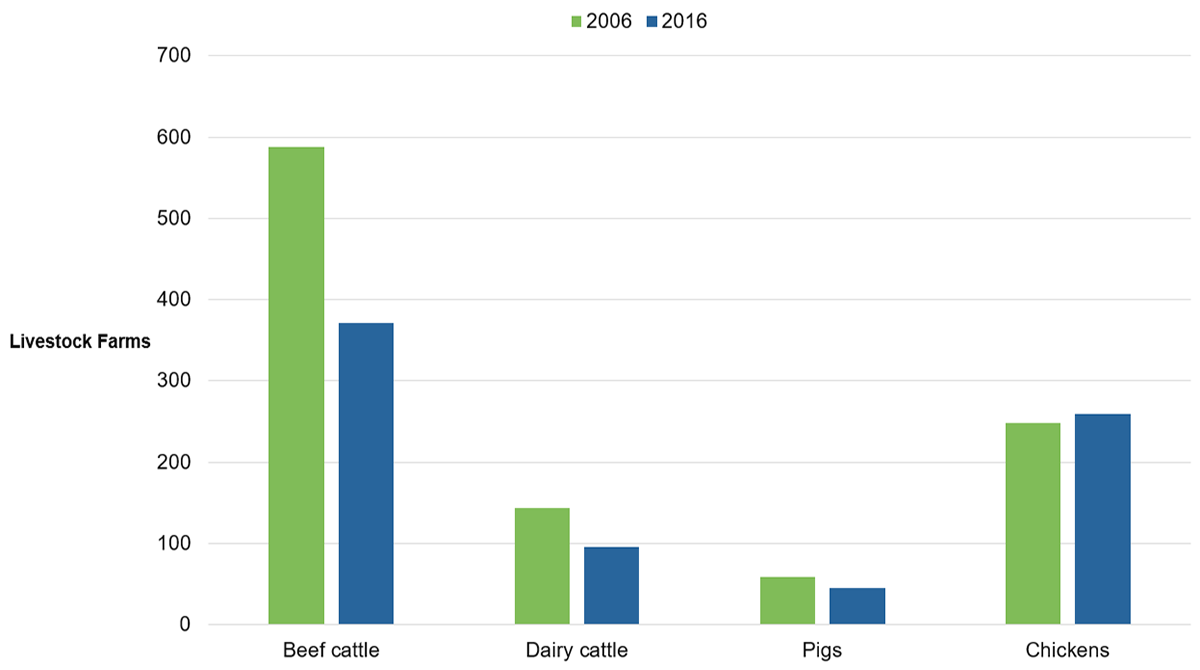
Figure 11: Number of farms raising beef, dairy, pigs and chicken in Lake Simcoe watershed. Data adapted from StatsCan Census of Agriculture 2006 and 2016.
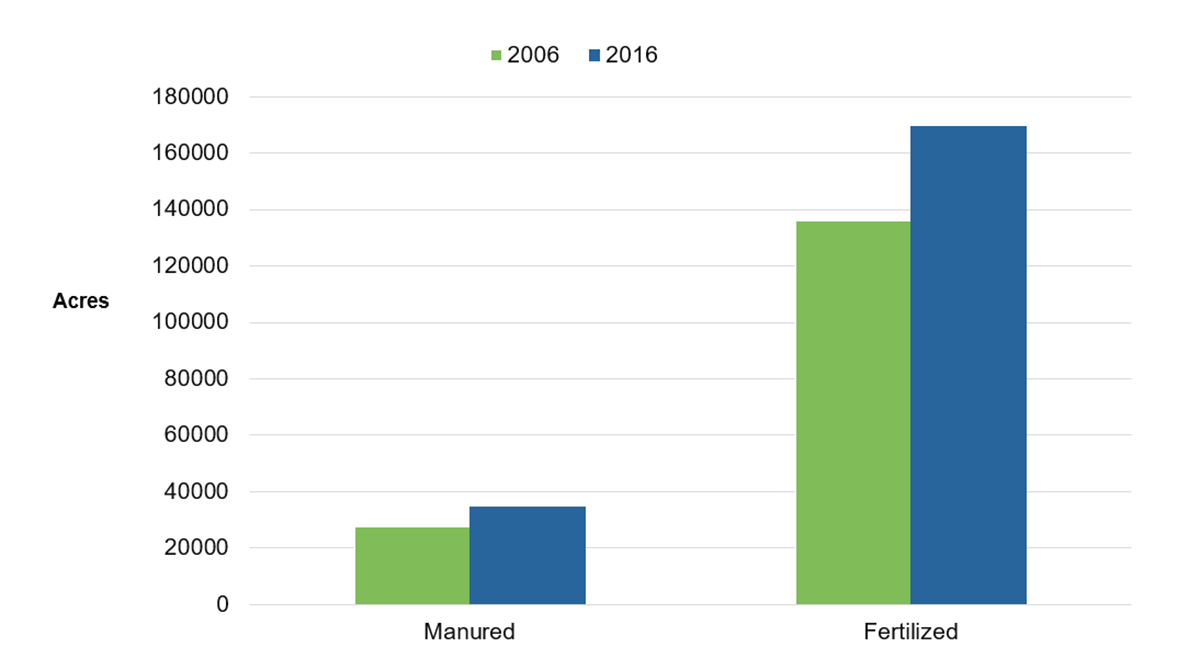
Figure 12: Acres receiving manure or fertilizer application in Lake Simcoe watershed. Data adapted from StatsCan Census of Agriculture 2006 and 2016.
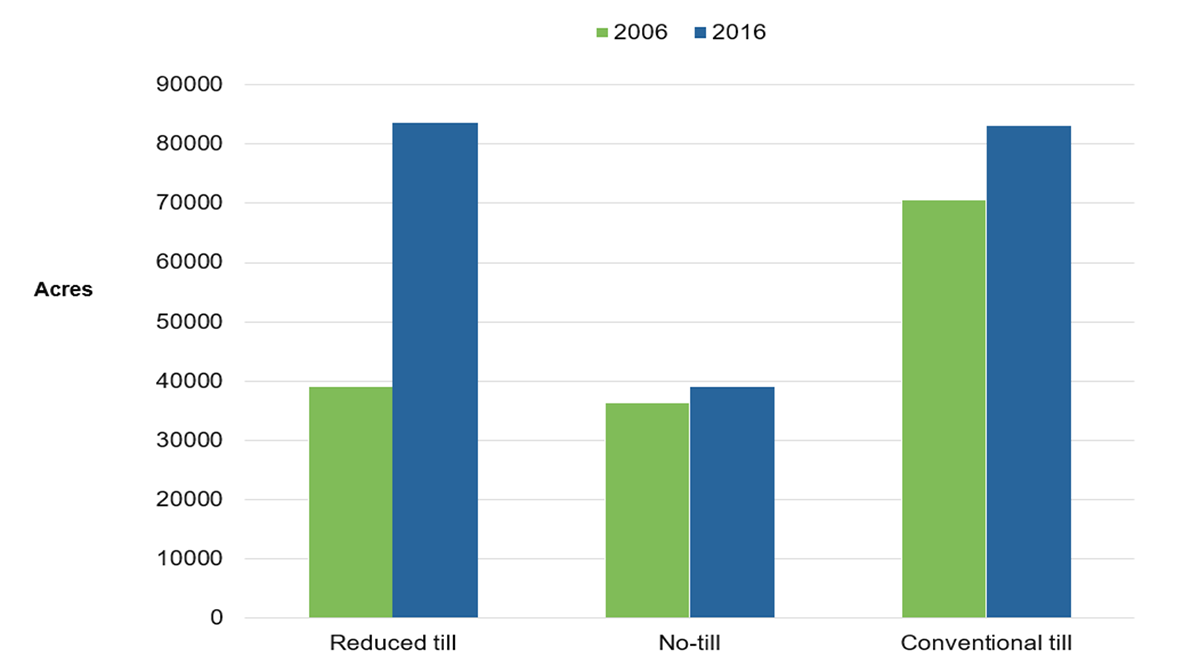
Figure 13: Acres with conventional, no-till and reduced till practices in Lake Simcoe watershed. Data adapted from StatsCan Census of Agriculture 2006 and 2016.
Agriculture may be changing, but trends indicate that farmers are adapting in ways that support improved water quality outcomes. Although the agriculture sector has made considerable progress in implementing best management practices in the Lake Simcoe watershed over the last 10 years, in the coming years the sector will face the increasing pressures of a changing climate that will result in more frequent and intense rain events, more winter snow melts and changing air temperatures. A continued and sustained effort to build resiliency and improve environmental sustainability will be important to ensure agriculture in the region remains economically viable and meets the growing demand for local and sustainably produced food, without compromising water quality in the watershed.
Septic systems
Septic systems, when properly designed, constructed and maintained, can effectively reduce or eliminate most human health or environmental threats posed by pollutants in household wastewater. However, without regular maintenance they can fail. Failed systems can contaminate the surrounding ground and groundwater, potentially impacting the natural environment and drinking water sources.
In the Lake Simcoe watershed, septic systems have been estimated to contribute approximately 4.4 tonnes of phosphorus to Lake Simcoe per year. This estimate is based on an approximation of the number of septic systems that are thought to be adjacent to the lake. Previous survey work estimated that approximately 3,700 septic systems were located within 100 metres of the lake. However, information on individual septic systems (i.e. location, age, condition, capacity) is not collected consistently by watershed municipalities, and results from municipal inspections are not tracked at a watershed level. Also, the situational complexity (i.e. how well septic systems are maintained, what transport pathways are present, etc.) means that it is very difficult to predict whether a contaminated plume from a failed septic tank will ultimately reach or impair the lake. This makes it very difficult to reliably estimate the contribution of nutrients and pathogens from septic systems at a watershed scale.
In 2012, the Lake Simcoe Science Committee recommended that the Ministry of the Environment, Conservation and Parks focus on improving our understanding of the number of septic tanks near watercourses, and how phosphorus migrates in septic tank plumes. Acting on that advice, the ministry funded the University of Western Ontario to develop a geospatial tool to improve our estimate of the number of septic systems in the watershed. Preliminary results estimate there are approximately 28,500 septic systems in the watershed and approximately 5,700 are within 100 metres of the lake, ponds or permanent watercourses in the watershed. They also found that up to 20 per cent of septic effluent from failed systems could reach watershed tributaries, especially under high stream flow conditions (i.e. when effluent breakout from septic tile beds may occur).
The plan required an update to the Building Code so that all septic systems within 100 metres of Lake Simcoe would be inspected by 2015. All municipalities have now completed these inspections and these systems will be re-inspected every five years. Systems that fail inspection may need to be repaired or replaced, depending on municipal requirements. The next phase of this work is to inspect any septic systems within 100 metres of ponds, permanent rivers and streams in the Lake Simcoe watershed by January 1, 2021, and every five years thereafter. To help with this, the Ministry of the Environment, Conservation and Parks and the Lake Simcoe Region Conservation Authority provided municipalities with maps showing the boundaries of these areas.
The ministry has also funded research at the University of Guelph to identify best practices for municipalities in carrying out and tracking their inspections and resulting requirements for improvements. The project also identified barriers that may be preventing homeowners from successfully maintaining their on-site septic systems and provided a recommended framework for municipalities, homeowners and private businesses to work together to protect our drinking water sources.
Many groups are working hard to reduce the impact by identifying and repairing malfunctioning septic systems or improving phosphorus removal technology from septic systems:
- Since 2004, the Lake Simcoe Region Conservation Authority's Restoration Assistance Program has provided technical and financial assistance to upgrade, repair and replace 610 faulty and malfunctioning septic systems.
- The Town of Innisfil is leading the way in implementing advanced phosphorus removal technology. In 2018, the town updated its Official Plan to prohibit new septic systems or subsurface systems within 100 metres of an identified vulnerable area unless the system provides tertiary treatment (which removes nutrients such as phosphorus and nitrogen and practically all suspended and organic matter from waste water).
- The Ministry of Agriculture, Food and Rural Affairs provided homeowners in the watershed with information on septic system maintenance best management practices. More than 6,000 copies of a SepticSmart DVD, educational booklets, and checklists have been produced and distributed in the watershed and across Ontario.
Call to action: what you can do
- Know the location of your septic system and leaching bed.
- Get your septic system pumped every three to five years.
- Keep accurate records of your septic maintenance.
- Divert surface water, including gutters and your sump pump away from your leaching bed.
- Replace inefficient toilets with low flow models.
- Never put cooking oils or food waste down the drain.
- Never pour or flush hazardous chemicals, or pharmaceuticals.
- Be careful not to drive or park over your tank or leaching bed.
- Avoid planting trees and shrubs near the tank or leaching bed.
- Avoid using anti-bacterial soaps, bleaches and harsh cleaning products.
Addressing urban stressors
When land is developed, natural land cover is often replaced with hard, impervious surfaces (e.g. pavement for parking lots and roads). This changes the way water naturally cycles in the environment by preventing rain and snow from infiltrating into the ground and increasing runoff. Several contaminants can be picked-up as water runs over paved surfaces, including phosphorus, chloride, pathogens, metals, and organic chemicals. Monitoring shows that much of the phosphorus from urban runoff increases in concentration as urban density increases.
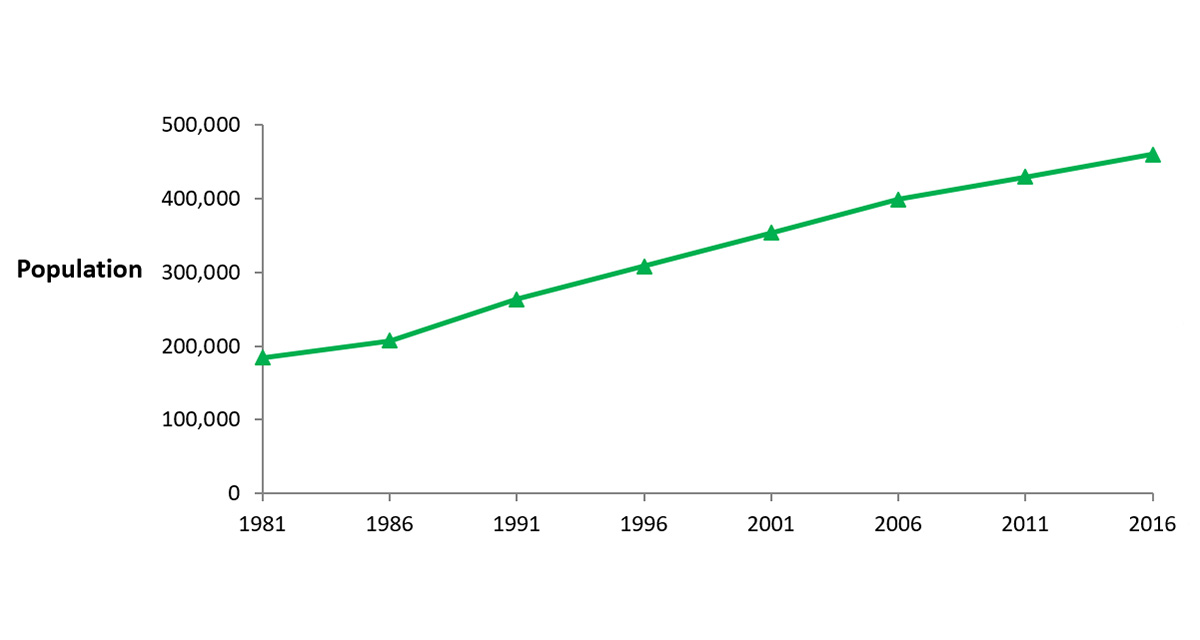
The urban areas of the watershed are experiencing varying degrees of growth pressure. As one of the fastest growing regions in Ontario, the watershed's population increased roughly 30 per cent between 2001 and 2016 (Figure 14). Lake Simcoe Region Conservation Authority estimates that from 2016 to 2041, the watershed's urban area will increase by approximately 50 per cent and the watershed population will almost double.
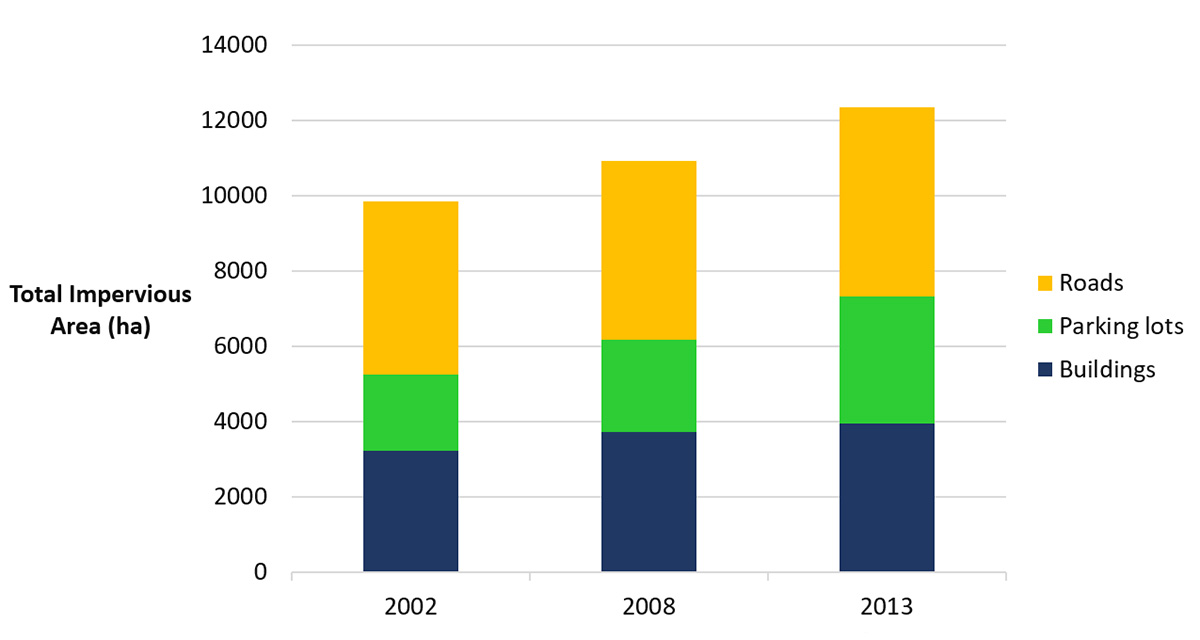
In 2017, the Ministry of the Environment, Conservation and Parks provided funding to the Lake Simcoe Region Conservation Authority to track changes in impervious features (roads, parking lots, buildings) and land use (agricultural, urban) in the watershed over time. Using comprehensive air photo coverage of the Lake Simcoe watershed captured in 2002/2003, 2008, and 2013, they developed a time series of land cover maps which showed that impervious cover in the watershed has increased since 2002, as the watershed's population has increased. The study reported the following results:
- Impervious area has increased from 3.4 per cent in 2003 to 4.3 per cent in 2013. However, the rate of that increase has decreased from the 2002–2008 period to the 2008–2013 period (Figure 15) indicating that growing municipalities have been better able to absorb increases in population with smaller increases in impervious cover.
- From 2002 to 2013 there was a decrease in agricultural land use (4359 hectares, or 1.5 per cent of the watershed), and natural heritage features (458 hectares, or 0.2 per cent), and an increase in urban area including both residential (1479 hectares, or 0.5 per cent) and the industrial, commercial, institutional sector (1064 hectares, or 0.4 per cent).
The Ministry of the Environment, Conservation and Parks funded the St. Lawrence River Institute of Environmental Sciences in 2018 to research a new way to identify hotspots of phosphorus concentrations remotely through the use of multispectral satellite imagery. The Spectral Landscape Nutrient Estimate model could be used to complement traditional monitoring to provide a better understanding of phosphorus hotspots in remote areas, where on-the-ground sampling can be difficult and expensive. Ultimately, it can help watershed managers decide where to implement best management practices to reduce phosphorus.
Road salt and chloride
Chloride is present in the natural environment from the weathering of rocks, and at low concentrations, is harmless. However, chloride concentrations in freshwater can become elevated due to the use of road salts, which contain chloride. Elevated chloride concentrations may contaminate sources of drinking water and be harmful to fish and other organisms that live in our freshwaters. The Canadian Water Quality Guidelines for the Protection of Aquatic Life on chloride is 120 mg/L for chronic (constant) exposure, and 640 mg/L for acute (short-term) exposure.
The Ministry of the Environment, Conservation and Parks and the Lake Simcoe Region Conservation Authority have measured chloride since 1971 at Atherley Narrows (where the water flows out of Lake Simcoe to the north) and since 2000 at stations in the lake (Figure 16). Chloride concentrations have increased significantly at Atherley Narrows and averaged across the lake (Figure 17).
The lake-wide chloride concentration in 2012 was 44 mg/L, and in 2018 it was 52 mg/L. From 2011 through 2013, chloride concentrations did not increase in the lake, since then (2013–2018) the rate of chloride increase has been 1.67 mg/L/yr. If this rate continues, Lake Simcoe will reach the chronic threshold level by 2058; the chronic threshold is the maximum concentration of chloride before constant exposure could affect sensitive aquatic life. This would be 11 years earlier than previously predicted due to a higher rate of increase.
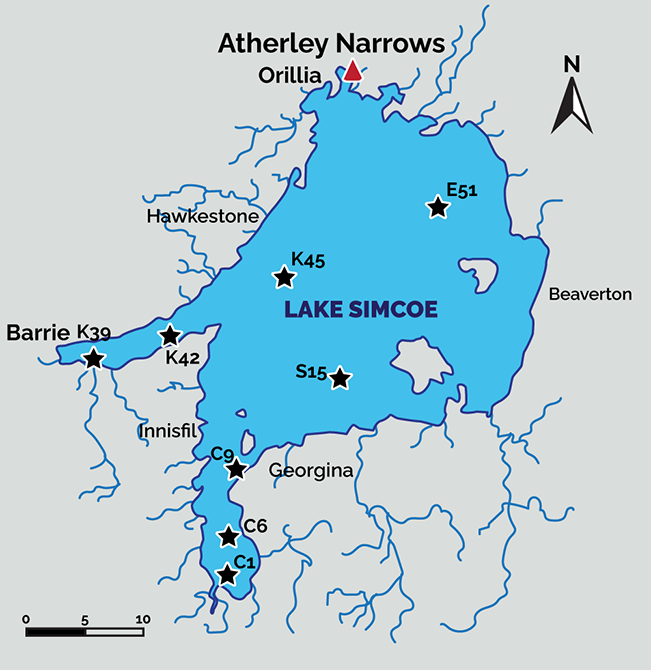
Figure 16: Ministry of the Environment, Conservation and Parks Water Quality Station locations in Lake Simcoe and at the lake's outflow, Atherley Narrows.
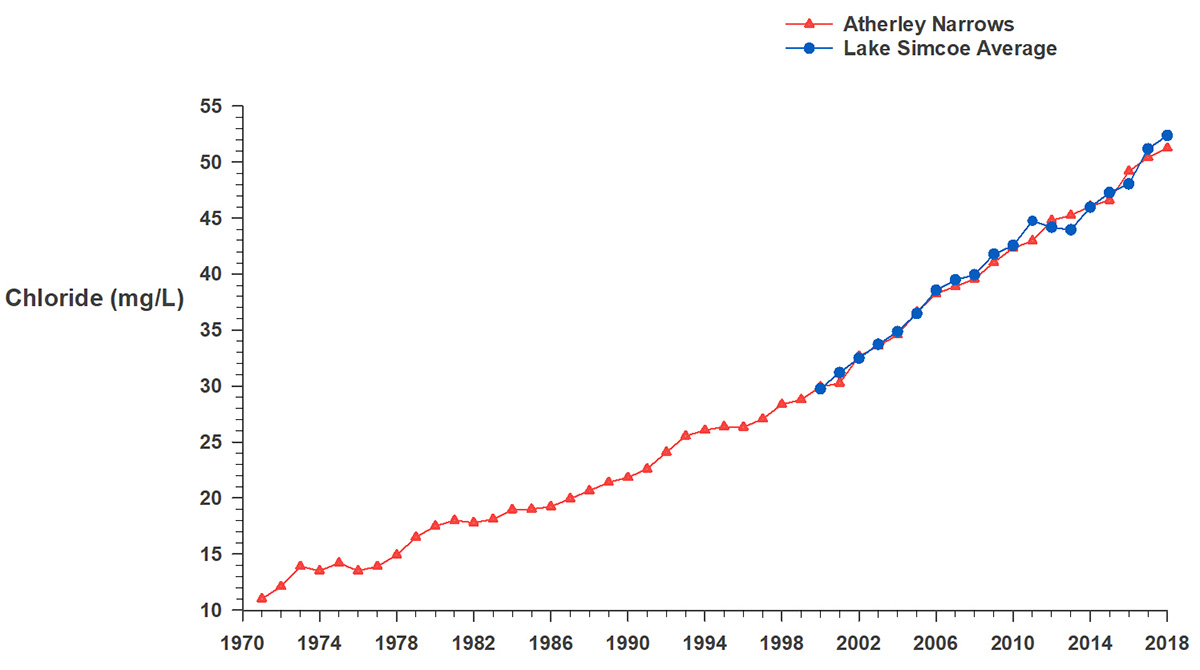
Figure 17: Chloride levels at Lake Simcoe's outflow, Atherley Narrows, and averaged across the lake. Note: Monitoring at lake stations began in 2000.
In 2012, the Lake Simcoe Science Committee recommended that the Ministry of the Environment, Conservation and Parks focus effort on improving our understanding of the increasing chloride concentrations in the Lake Simcoe watershed. The ministry funded the Lake Simcoe Region Conservation Authority to conduct research to identify areas where adoption of best practices could best result in improvements. Lake Simcoe Region Conservation Authority researchers tested and tracked the results of salt application on various winter surfaces and monitored salt concentrations in local waterways.
The conservation authority's monitoring results showed that the highest concentrations of chloride were recorded in tributaries draining from urban areas. High concentrations in urban creeks have been observed year-round. Recognizing this, the conservation authority began work with municipal, provincial and private sector partners to promote the adoption of winter maintenance best practices to reduce chloride concentration in Lake Simcoe and its tributaries. Over the past five years, several large and urbanizing municipalities have purchased new equipment, updated their policies, and adopted improved practices that could result in a reduction in their application rates of almost 40 per cent.
The City of Barrie is leading by example, demonstrating to the community that safe and environmentally conscious road salt management and winter maintenance practices are a priority for the municipality. Since implementing the strategy, the city has reduced the total salt used on their roads by an estimated 354.58 tonnes in the 2016–2017 winter season, and 618.45 tonnes in the 2017-2018 winter season.
The conservation authority has also been monitoring chloride concentrations in the runoff of a commercial parking lot in the watershed each winter since 2014, and each year they have observed concentrations in parking lot runoff that are nearly 4 times higher than sea water, with a maximum value recorded at 73,127 mg/L in 2018. They have identified opportunities to significantly reduce the amount of road salt used on parking lots and sidewalks while achieving safe winter surfaces by designing public spaces with winter in mind. This includes the use of design features that will require less salt application to maintain the same level of service without increasing liability. For more information, visit the conservation authority's 'Parking Lot Design Guidelines to Promote Salt Reduction'.
Because contractors and building managers may be inclined to overapply salt to address public perceptions of risks, the ministry also funded the Smart About Salt Council to develop online, bilingual training to support contractors with the use of leading practices that optimize salt application. This training encourages the right mix of product and removal techniques to limit water quality impairment while reducing the risk of slipping.
Leaders in the private sector, provincial and federal governments and non-government organizations have become engaged in this effort, through participation in a Freshwater Roundtable that seeks to better understand the benefits and barriers to the adoption of best practices for using road salt. Ongoing collaboration with this multi-stakeholder group is intended to promote greater adoption of winter maintenance best practices in parking lots across the Lake Simcoe watershed, and beyond.
Call to action: what you can do to reduce chloride in Lake Simcoe
- Lake Simcoe Region Conservation Authority recommends clearing as much snow and ice from your walkway and driveway as possible before reaching for that bag of road salt. If you do choose to apply road salt, remember that a little goes a long way: piling on layer after layer of salt won't speed up the melting rate but it might make your sidewalk slippery and a mess of your yard.
- If you employ a contractor to make your property winter safe, ask if they are Smart About Salt Certified. The Smart About Salt program is Ontario's resource for training and certification on the use of road salt, which is beneficial for both the property manager and the contractor and is the first step in reducing the overapplication of road salt.
- Check out Ontario 511, a pre-trip planning tool that lets drivers know about events that may impact their travel on provincial highways. "Track My Plow" website allows you to plan ahead and see where along your route you might come across a snow plow or salt truck, and which part of your route has already been cleared.
- Learn how to get ready for winter safe driving by reviewing tips for driving in winter weather (e.g. using snow tires).
Contaminants of emerging concern
While phosphorus and chloride are major water quality issues in Lake Simcoe, there are other contaminants that require monitoring and research consideration. "Pharmaceuticals and Personal Care Products" refers to a broad category of products, which can include medicines, cosmetics, and perfumes, some of which can make their way into our waters.
The Ministry of the Environment, Conservation and Parks has been collaborating and conducting research on pharmaceuticals (including antibiotics, anti-convulsant, mood stabilizers and hormones) and other emerging contaminants since the late 1990s. Generally, levels of pharmaceuticals measured in treated and untreated drinking water in Ontario are very low and unlikely to affect human health, however the Ministry continues to watch the science related to this emerging issue. Concentrations of pharmaceuticals in sewage treatment plant effluent can be higher than in the receiving water body. However, most pharmaceuticals are reduced by conventional treatment. Levels observed in Ontario are lower or similar than those reported in other jurisdictions and it is expected that impacts to aquatic life would most likely occur where less advanced treatment plants discharge to small bodies of water.
The ministry has been working with municipalities to raise awareness of how these contaminants can enter municipal sewer systems upstream of sewage treatment plants. Most municipalities and all pharmacies now have unused pharmaceutical take back programs. York Region is working with the pharmaceutical industry to encourage pollution prevention, on-site treatment or recovery processes for manufacturers to reduce pharmaceutical and other contaminants discharged to the sewers and sewage treatment plants.
Another contaminant of emerging concern is microplastics, small particles of plastic ranging from about 0.001 to 5 millimeters in size. Microplastics are present in Ontario's lakes and streams, raising concerns because they take a long time to breakdown and can be mistakenly ingested as food by wildlife. This may impact wildlife nutrition and health if blockages occur and food is replaced by plastic.
The ministry and the University of Toronto are measuring the amounts and types of microplastics present in Lake Simcoe waters, lake-bottom sediments and fish. Although analysis is continuing, early results show that microplastics, mostly fibers and fragments, are present in water, sediment and the stomachs of fish from the lake at similar or lower amounts than in the Great Lakes. Higher amounts are found in the Great Lakes in areas of greater population, where rivers deliver stormwater to the lakes, and where the watershed has more plastics companies.
Most microplastics taken into the body with food pass through wildlife and humans. Studies of fish fillets and drinking water suggest that microplastics are present in very small amounts, if they can be detected. Based on current information, the World Health Organization indicates that there are no known human health concerns with microplastic particles in drinking water. The ministry has committed to reducing plastic waste in the Made-in-Ontario Environment Plan and limiting microplastics that can end up in our lakes and rivers.
Call to action: what you can do
- Never pour or flush hazardous chemicals, or pharmaceuticals down the drain.
- Return expired or unused medicine to a local pharmacy.
- Reduce your use of single-use plastics.
- Participate or organize a beach clean up in your community.
Reducing phosphorus from urban runoff
The Ministry of the Environment, Conservation and Parks is working with the Lake Simcoe Region Conservation Authority and local municipalities to identify, promote and track the use of best management practices to manage urban sources of phosphorus. This includes implementing stormwater retrofits and better controls to minimize sediment and erosion from construction and new development.
The conservation authority has implemented an erosion and sediment control program within the watershed to help construction activities reduce the risks of erosion. This effort includes a suite of tools that support sediment and erosion controls during construction and development, including:
- 2016 Erosion and Sediment Control Research Study, to support the use of erosion and sediment control practices in the watershed and help reduce the overall impact of stormwater on Lake Simcoe and its tributaries
- Erosion and Sediment Control Guidelines for land developers to follow during construction activities (developed through the Sustainable Technologies Evaluation Program (STEP))
- Erosion and Sediment Control Site Evaluation Tool, to assist in identifying and managing erosion and sediment risks associated with urban construction sites, and compiled examples of current industry best management practices to reduce sediment and erosion from development
- Over 88 attendees including developers, consultants, contractors and municipal representatives participated in two workshops held in 2017 to increase awareness of the conservation authority's current Erosion and Sediment Control guidelines
- Certified Inspector of sediment and erosion control training to over 45 participants
Future actions in the watershed (and beyond) to improve soil health and reduce erosion will be guided by the results of these projects. This work directly supports the plan objective to "promote environmentally sustainable land and water uses, activities and development practices".
Stormwater infrastructure in a changing climate
The Lake Simcoe Region Conservation Authority's research found that stormwater ponds become less efficient at filtering runoff if they are not adequately maintained. They estimate that the reduced efficiency is resulting in an additional 0.81 tonnes of phosphorus per year being added to watercourses in the watershed. Inspecting, maintaining and retrofitting existing stormwater management facilities is an important part of protecting water quality, but it can be expensive and can compete with other municipal service needs. In the Lake Simcoe watershed, this is compounded by projected population growth that will increase in the number of stormwater management facilities required.
In 2017, the Ministry of the Environment, Conservation and Parks collaborated with the Lake Simcoe Region Conservation Authority to develop the Stormwater Management Pond Inspection and Maintenance Program featuring a standard methodology for assessing or completing stormwater pond inspection and maintenance prioritization. The ministry also provided funding to the conservation authority to work with stormwater pond owners (private and public) to improve stormwater inspection, maintenance, and record keeping practices. Working with several watershed municipalities, the conservation authority created a database of municipal stormwater features, including 355 stormwater ponds, 106 oil and grit separators and stormwater features that promote on-site infiltration, such as rain gardens. The database application also includes information pertaining to work orders for maintenance and inspection tools to assist municipalities with best management practices and regular upkeep of their stormwater management facilities.
This will help municipalities prioritize stormwater management ponds most in need of retrofits and manage their investments in infrastructure assets. The Ministry of the Environment, Conservation and Parks has also provided funding to the Town of Newmarket in 2016 to compile and share information on the use of stormwater utility fees and landowner credit programs. The ministry initiated this pilot project with the Town, recognizing that several Lake Simcoe watershed municipalities needed an example to follow to secure stable and reliable funding sources for managing stormwater facilities, including on-going inventory uptake, inspection, and maintenance needs.
Phosphorus offsetting policy
The Lake Simcoe Region Conservation Authority, in collaboration with the Province, the Chippewas of Georgina Island First Nation, local municipalities, the Building Industry and Land Development Association and watershed community members, developed and implemented the Lake Simcoe Phosphorus Offsetting Policy in 2017. Under this policy, developers must ensure that no phosphorus is exported from any proposed development with an impervious area of 500 square metres or greater. If zero phosphorus export is not possible, even after on-site measures are implemented, any residual phosphorus leaving the site will need to be offset through a cash-in-lieu payment at a ratio of 2.5:1. This means that for every tonne of phosphorus that leaves the site, proponents will have to provide funds to pay for 2.5 tonnes of phosphorus to be removed from elsewhere in the same subwatershed area.
Funds will be used to finance urban stormwater retrofit projects at sites with uncontrolled flow in existing urban areas. This is expected to achieve an overall net reduction in phosphorus loading to Lake Simcoe.
Sewage treatment plants
There are fourteen municipal, and one industrial, sewage treatment plants in the Lake Simcoe watershed. Seven of the plants discharge treated water into Lake Simcoe while the other eight discharge into watercourses that eventually drain into the lake. Although the discharge is treated to a high standard, it still contains some phosphorus. The Ministry of the Environment, Conservation and Parks regularly inspects and monitors the operation of sewage treatment plants to ensure all operating conditions are being met and to make sure they are not adversely impacting the environment.
Prior to the Lake Simcoe Protection Plan, the average annual phosphorus load from sewage treatment plants was approximately 5.1 tonnes per year. As required under the plan, the ministry amended the Environmental Compliance Approvals for sewage treatment plants in the watershed to require new stringent limits and loads (see Table 1). Resulting improvements in phosphorus removal technology and techniques to meet the new requirements, have led to a decrease in phosphorus loadings from sewage treatment plants by approximately 50 per cent from pre-plan levels. In 2017, the total amount of phosphorus going into the lake from sewage treatment plants was less than two tonnes per year. The reduction of phosphorus coming from the sewage treatment plants is considered a major achievement given the increased pressures from urban development. Sewage treatment plants in the watershed are now among the most innovative and effective in removing phosphorus in Ontario.
| Sewage treatment plant | PRS limit (kg/y) | 2010 | 2011 | 2012 | 2013 | 2014 | 2015 | 2016 | 2017 | 2018 |
|---|---|---|---|---|---|---|---|---|---|---|
| Lake Simcoe (Beaverton) | 190 | 33 | 19 | 25 | 41 | 50 | 23 | 26 | 25 | 25 |
| Bradford | 698 | 149 | 151 | 147 | 204 | 232 | 216 | 272 | 259 | 220 |
| Sutton | 187 | 49 | 69 | 53 | 42 | 53 | 42 | 47 | 34 | 32 |
| Beaverton River #2 (Cannington) | 97 | 34 | 56 | 43 | 48 | 34 | 24 | 42 | 56 | 43 |
| Innisfil | 629 | 176 | 215 | 134 | 171 | 160 | 125 | 168 | 268 | 250 |
| Orillia | 996 | 600 | 504 | 501 | 471 | 510 | 421 | 482 | 476 | 400 |
| Barrie | 2,774 | 1,423 | 1,346 | 1,154 | 1,524 | 876 | 1,278 | 586 | 511 | 744 |
| Uxbridge Brook | 286 | 89 | 86 | 87 | 100 | 96 | 83 | 42 | 47 | 68 |
| Queensville/Holland Landing Lagoon | 124 | 62 | 32 | 40 | 47 | 29 | 33 | 48 | 65 | 50 |
| Keswick | 655 | 385 | 652 | 452 | 193 | 77 | 72 | 124 | 108 | 99 |
| Mount Albert | 75 | 7 | 9 | 14 | 15 | 20 | 21 | 15 | 20 | 15 |
| Schomberg | 75 | 11 | 11 | 9 | 11 | 16 | 16 | 14 | 15 | 17 |
| Lagoon City | 124 | 32 | 30 | 27 | 34 | 35 | 22 | 26 | 37 | 30 |
| Beaverton River #1 (Sunderland) | 58 | 8 | 8 | 7 | 11 | 14 | 8 | 7 | 14 | 8 |
| Silani Cheese | 27 | 14 | 23 | 19 | 12 | 9 | 31 | 76 | 38 | 13 |
| Total | 6,995 | 3,072 | 3,211 | 2,712 | 2,924 | 2,211 | 2,415 | 1,975 | 1,972 | 2,015 |
The City of Barrie Wastewater Treatment Facility has seen a significant reduction in its discharged phosphorus levels since the implementation of the Phosphorus Reduction Strategy. This reduction in phosphorus levels has been a direct result of using innovative strategies to enhance treatment performance beyond the plant's current design criteria. Improved treatment performance leveraged the plant's available remaining treatment capacity along with optimizing the nutrient removal process. The City of Barrie is currently in the early stages of a multi-year project intended to upgrade the current sewage treatment technology to ensure the discharge of high-quality effluent into Lake Simcoe is maintained over the decades to come.
Water quality outcomes
Phosphorus loads and concentrations
Through a partnership with the Lake Simcoe Region Conservation Authority, the ministry has committed to monitoring, measuring and reporting on phosphorus loads to Lake Simcoe since the 1990s. Loads are typically calculated every three hydrological years, where a hydrological year goes from June 1 to May 31 of the following year. The most recent phosphorus loads (for the 2015 to 2017 hydrological years) were released in January 2020, and can be found on the conservation authority's website.
Phosphorus loads are expressed in metric tonnes and are very much a function of how much water is moving through the watershed. For each year they are estimated by source – atmospheric, septic, polders, sewage treatment plants (also known as water pollution control plants) and tributaries. For more information on the sources of phosphorus in the watershed, please visit the Lake Simcoe Region Conservation Authority's Phosphorus website.
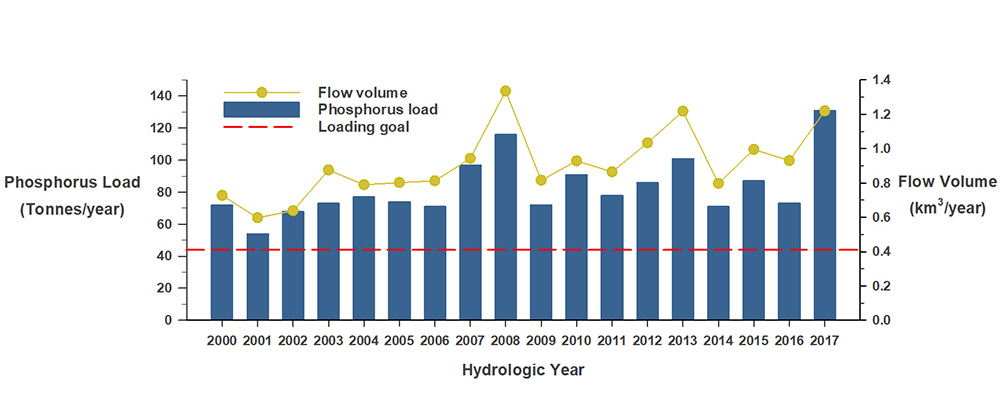
Figure 18: Phosphorus loads from the 2000 to 2017 hydrologic years along with the plan's phosphorus loading goal of 44 tonnes per year and annual tributary flow volume.
As indicated in Figure 18, the loads for 2015 to 2017 hydrologic years were:
- 2015 = 87 tonnes per year
- 2016 = 73 tonnes per year
- 2017 = 131 tonnes per year
The high loads in recent years are largely driven by high volumes of water flowing into Lake Simcoe. This is due to more frequent and intense rain events, and more winter snow melts. More water flowing into the lake adds more phosphorus.
While phosphorus loads remain high, lake phosphorus concentration has decreased since the implementation of the plan. Phosphorus concentration is the amount of phosphorus in a unit of water and is expressed as micrograms per litre (µg/L). In addition to decreases in spring (April to June 20 averages) total phosphorus concentration averaged across the lake since 1980 (Figure 19), declines are now also being seen in the annual (May through October averages, i.e. the ice-free season) total phosphorus concentrations at all but one lake monitoring station (S15; Figure 16 and Figure 20).
Phosphorus concentrations, in particular, have been consistently low since the 2015 Five-Year Report. Of the eight water quality monitoring stations in the lake (Figure 16 and Figure 20), total phosphorus concentration was highest at the southern end of Cook's Bay (station C1; Figure 16 and Figure 20), which is a shallow area that receives runoff from agricultural and urban areas such as Newmarket and Aurora.
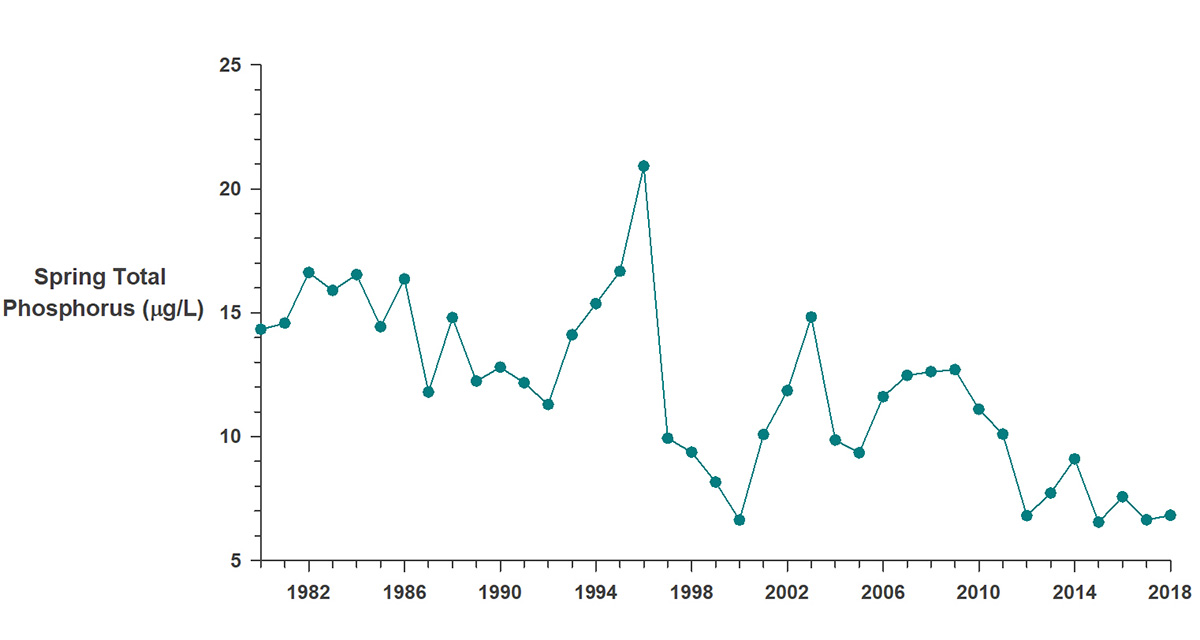
Figure 19: Spring total phosphorus averaged across the whole lake.
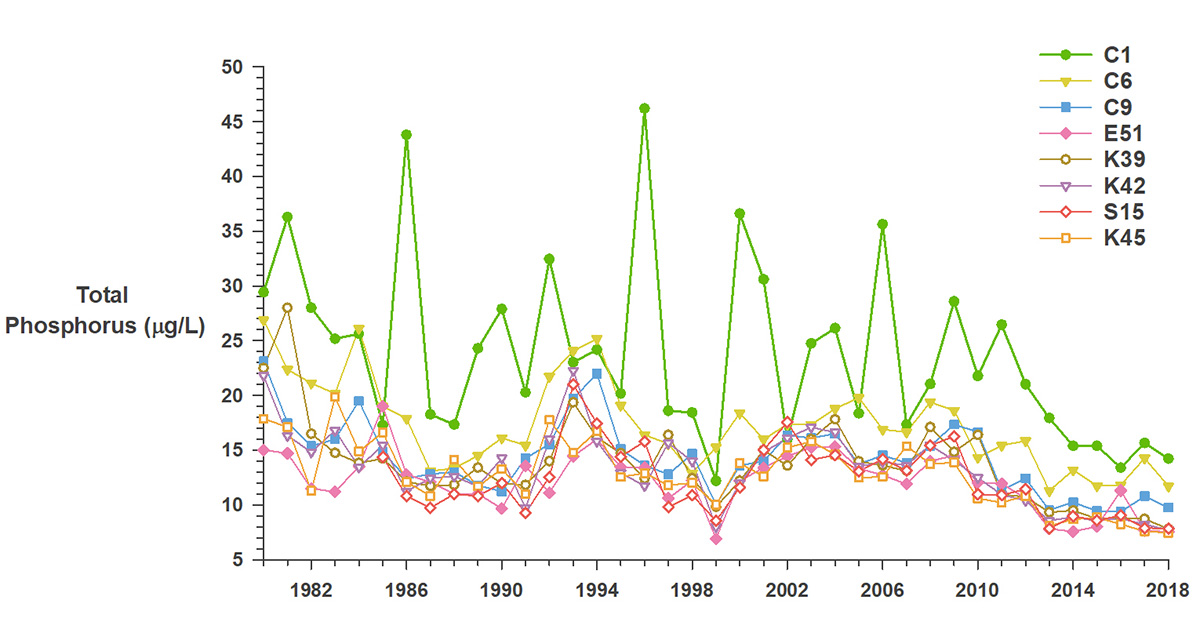
Figure 20: Total phosphorus at each lake station averaged from May through October.
Chlorophyll-a concentrations
With low phosphorus concentrations in the lake in recent years, less algae growth would be expected because phosphorus is a key factor limiting algal growth in most Ontario lakes. A common indicator of algae in freshwater is chlorophyll-a concentration. There have been significant decreases since the 1980s in chlorophyll-a concentrations from samples taken during the ice-free season at all lake stations (Figure 21). Chlorophyll-a concentrations were generally highest at station C1, which has the highest total phosphorus levels to support algae growth.
Less chlorophyll-a, and thus less algae, is likely contributing to improvements in summer deep water dissolved oxygen levels. As algae dies, it settles to the bottom of the lake and decomposes. The process of decomposition requires oxygen, which comes from the surrounding water. As algae amounts decrease, the amount of oxygen used for decomposition will also decrease.
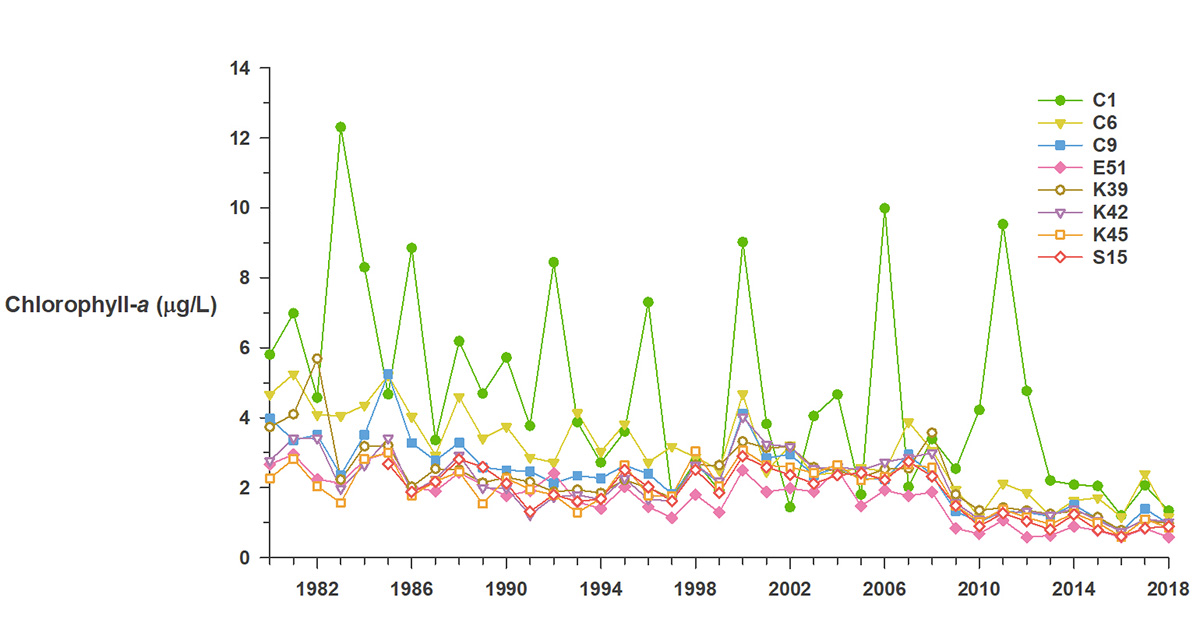
Figure 21: Chlorophyll-a concentrations at each lake station averaged from May through October.
Dissolved oxygen
To improve habitat for aquatic life, the plan aims to increase dissolved oxygen levels in the deep waters of the lake to 7 mg/L. This level is needed to support the natural reproduction of the cold-water fish (such as lake trout, lake whitefish, and cisco) that live in the deep, cold waters of the lake.
The Ministry of the Environment, Conservation and Parks has been monitoring dissolved oxygen since the 1980s as part of their long-term monitoring of water quality in Lake Simcoe. The data are used to calculate two key indicators:
- lowest level of dissolved oxygen in the deep water by the end of the summer
- how quickly the dissolved oxygen is used up over the summer, which is the rate of dissolved oxygen depletion
Improvements in deep water dissolved oxygen continue. The minimum deep water dissolved oxygen level by the end of the summer has continued to increase since the 1980s (Figure 22). Since 2012, it has ranged from 5.52–7.14 mg/L, surpassing the plan target of 7 mg/L in 2014.
One reason for the increase in deep water dissolved oxygen since the 1980s is that there has been a slower depletion rate of deep water dissolved oxygen (Figure 23). A slower depletion rate can result in higher end of summer deep water dissolved oxygen levels. Further research is needed to determine why the dissolved oxygen depletion rate has decreased, but one contributing factor is likely the reduced amount of algae resulting in less oxygen being used up as the algae decomposes.
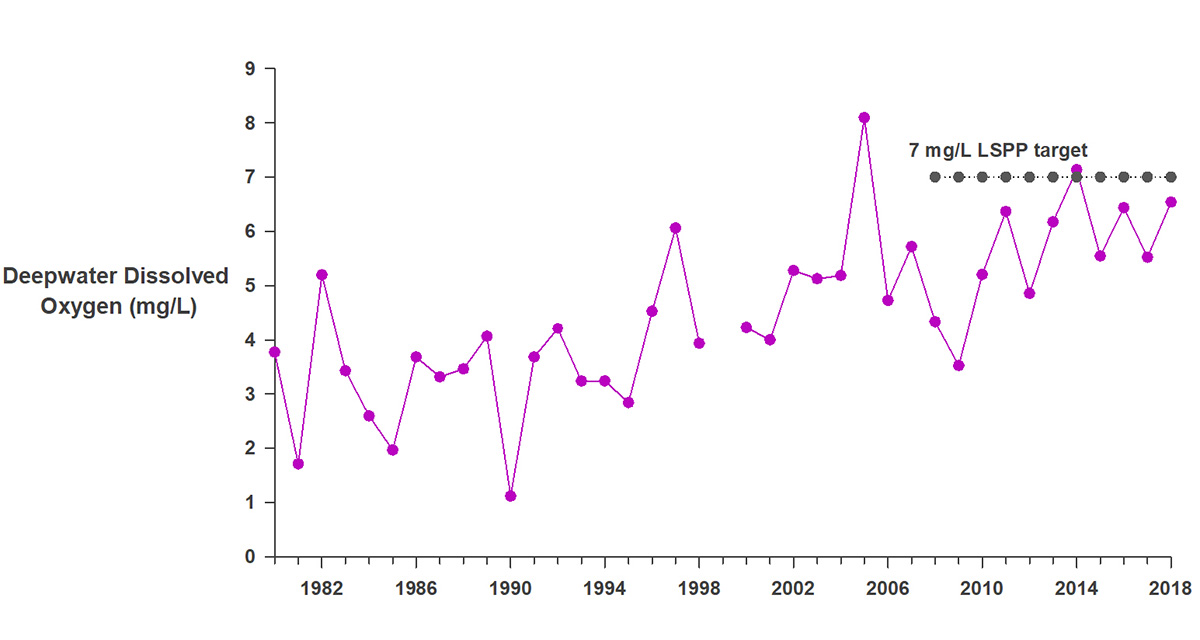
Figure 22: Lowest level of dissolved oxygen in the deep water by the end of summer.
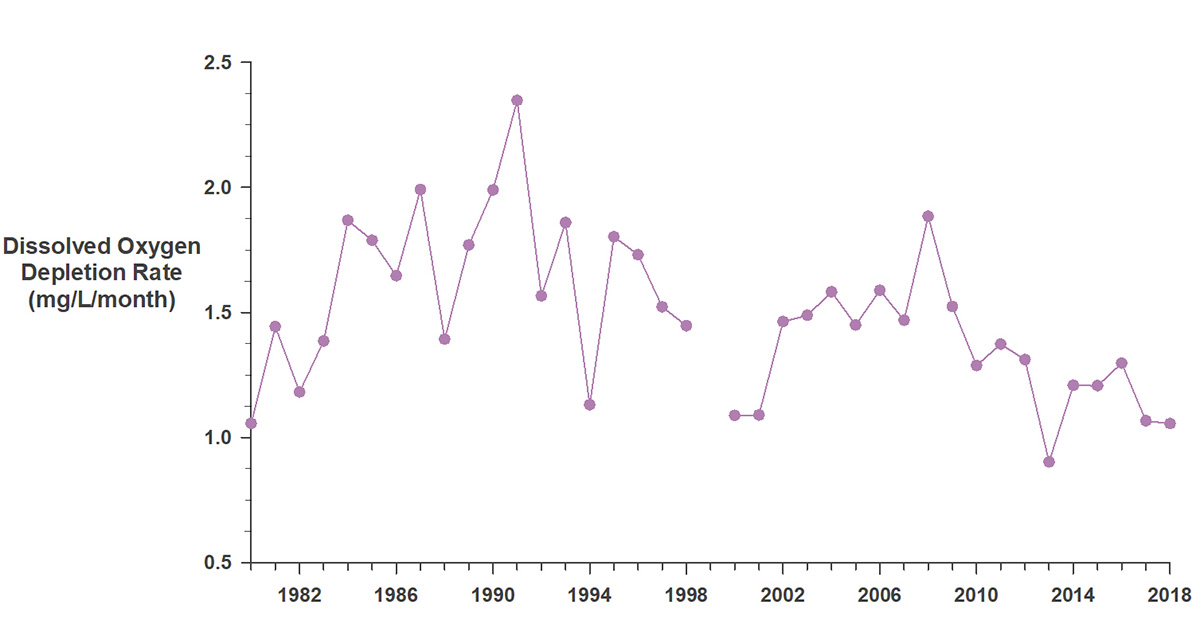
Figure 23: Dissolved oxygen depletion rate.
Understanding the link between phosphorus and dissolved oxygen
The plan has a long-term goal for phosphorus loading of 44 tonnes per year. At the time the plan was developed, this was the level thought to be needed to achieve the target of 7 mg/L minimum deep water dissolved oxygen. A series of relationships, developed by Nicholls (1997), were used to link the two (Figure 24).

Figure 24: Relationships linking phosphorus loading to deep water dissolved oxygen in Lake Simcoe.
Phosphorus loading is an estimate of all phosphorus entering the lake each year. The amount of phosphorus coming into the lake is expected to influence lake phosphorus concentration. This, in turn, affects the amount of algae (represented by chlorophyll-a concentration) because phosphorus is a limiting nutrient for algae growth in the lake. Algae use up oxygen at the bottom of the lake when they decompose, therefore chlorophyll-a concentration influences the concentration of deep water dissolved oxygen.
For the 2015 Five-Year Report, these relationships were re-evaluated to assess whether the phosphorus load target was still appropriate. Using the most up-to-date phosphorus load data at that time (which included load data to 2009), the relationships still held. These relationships have been re-evaluated again using the most current data available.
Through 10 years of collecting monitoring data on phosphorus concentration, chlorophyll-a as an indicator for the amount of algae in the water, and deep water oxygen concentration, we have determined that the relationship between phosphorus load and deep water dissolved oxygen is much more complex than originally believed. We need to do more work to understand the underlying ecology, while at the same time continuing to implement the Phosphorus Reduction Strategy to further reduce phosphorus entering the lake in order to continue to drive improvements.
Research on sources of dissolved organic carbon
The brown colour of lake water that is sometimes seen in Lake Simcoe comes from decomposed organic matter. It is called dissolved organic carbon and it is important to the lake food web. In the 2015 Five-Year Report we noted that dissolved organic carbon in Lake Simcoe was significantly increasing at all lake stations, especially since 1999. Researchers at Trent University tried to figure out where the dissolved organic carbon was coming from: the watershed, due to changes in land use and/or climate, or within the lake itself? They found that the bulk of the increase in dissolved organic carbon is being produced within the lake and is likely from the decomposition of abundant aquatic plants along the shoreline.
Lake Simcoe's beaches
An ongoing attraction of Lake Simcoe is its beautiful public beaches that can be found all around the Lake Simcoe shoreline. From time to time, beaches can become unsafe for swimming. This can sometimes be caused by fecal bacteria, which can affect human health, that is present. Fecal bacteria can get into the water from animals (e.g. pets, wildlife, agriculture) or humans (e.g. leaky septic systems, sewage spills).
Throughout the summer months, Durham, York and Simcoe Regional Health Units test water at public beaches to evaluate potential risks to public safety. The bacterium Escherichia coli is measured to detect possible fecal contamination. If a beach is deemed unsafe, a swimming advisory is posted. The water at these beaches is then retested at different frequencies depending on the region to determine when bacteria levels are safe, and postings can be removed. In the plan, beach postings are used as an indicator of environmental health to estimate pathogens, with a target to reduce pathogen loadings to eliminate beach closures.
There has been very little change in the number of postings (frequency) and the total number of days posted (duration) within the three regions; only duration in Durham region had a significant increase (Figure 25). This trend was also significant in the first five-year report. In the years since (2013–2017), there have been fewer postings at many of the Durham and York beaches and fewer days posted overall. However, some of the York beaches along the southern shore near Cook's Bay have shown some increases. Beaches along the southern and eastern shorelines have a greater exposure to onshore winds making them more susceptible to storm events, which are a key contributing factor to beach postings. Beaches in the Simcoe region, along the western and northern shores, have historically had very few postings; however, in recent years, some of these beaches have shown some increases in the frequency and duration of postings.
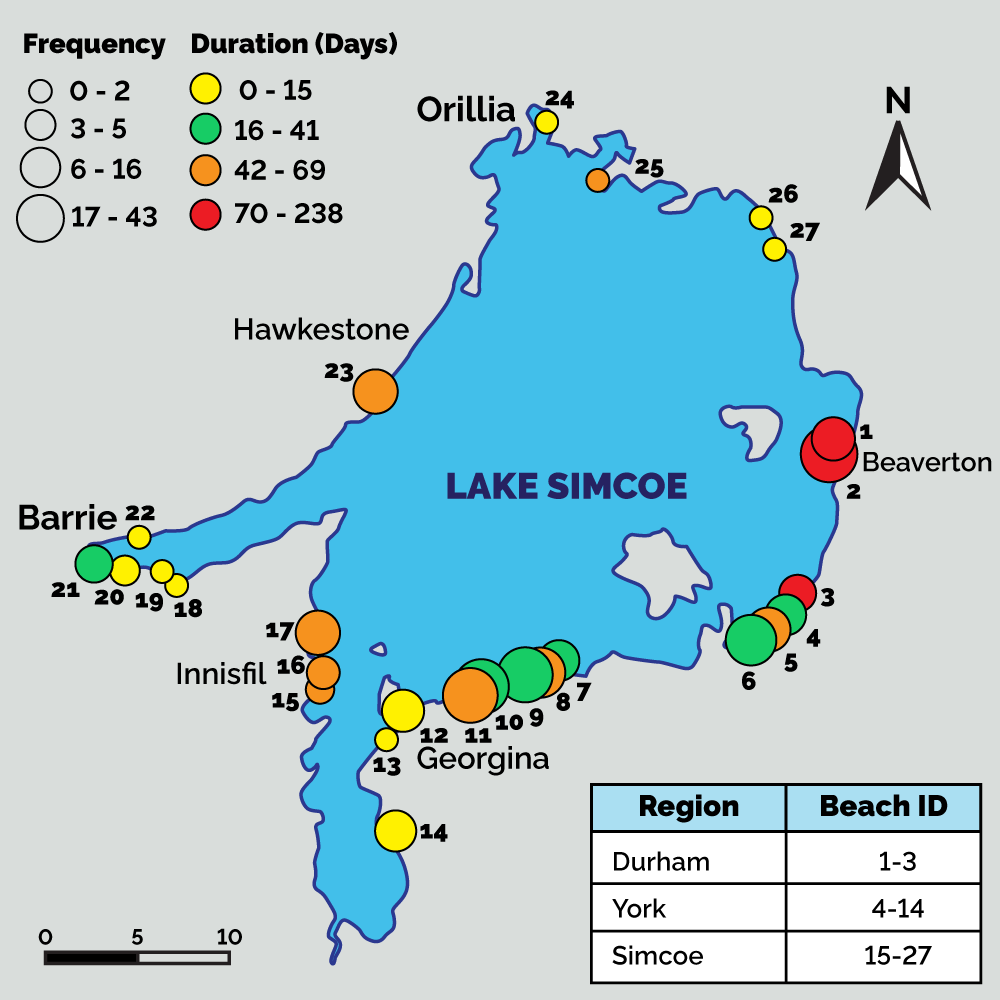
Figure 25a: Location of monitored Lake Simcoe beaches and frequency and duration of beach postings from 2013 to 2017.
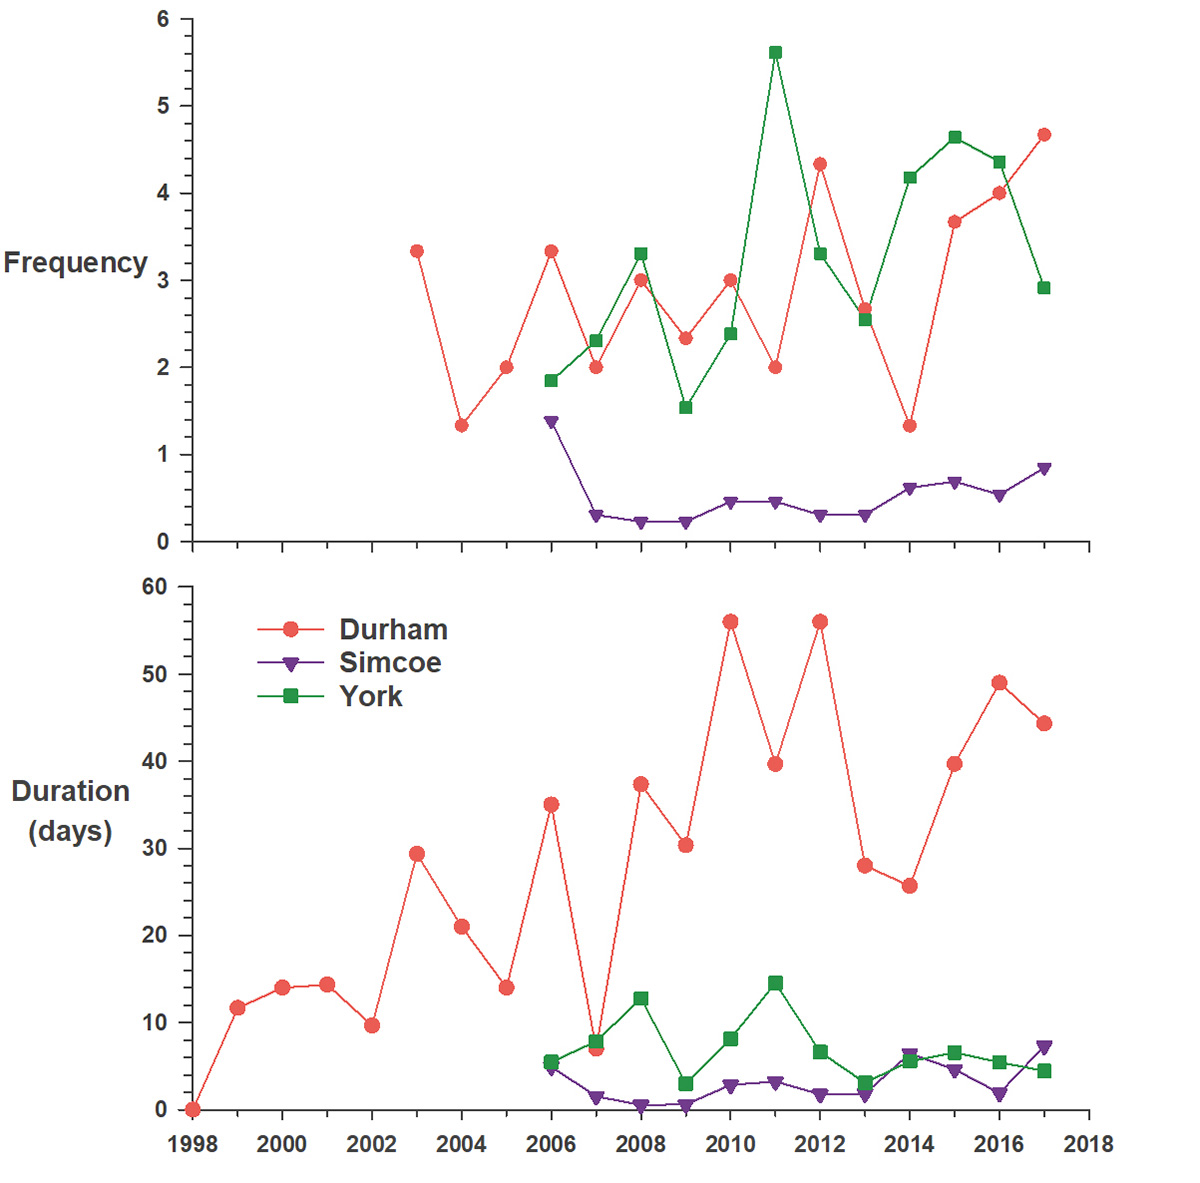
Figure 25b: Frequency and duration of Lake Simcoe beach postings annually between 1998 and 2017.
Plan priority: understanding variability in a changing climate
Although the amount of water in rivers and lakes naturally varies throughout the year, climate change can greatly impact the seasonality of the water cycle. Heavy rainfall and winter melting can increase the contaminants being washed into the lake. Warmer summer temperatures can increase the duration of low flow conditions that impact the water available to people and aquatic ecosystems. Both high and low lake levels can contribute to increased shoreline erosion, causing sedimentation and water quality concerns.
The changing climate is already affecting the Lake Simcoe watershed, and is influenced by multiple external factors. Changes in stream flow have been observed, and these changes can have impacts on water quality, aquatic, and terrestrial ecosystem structure and function, as well as the integrity of natural areas and shorelines. These changes will influence the way communities throughout the Lake Simcoe watershed manage natural assets and the infrastructure that has been built around them. Building resiliency to these changes across the watershed is critical for the protection of both ecological integrity and the built environment.
Building climate resiliency by addressing cumulative stresses in lakes is a priority of the Made-in-Ontario Environment Plan, and substantial work is underway in the Lake Simcoe watershed. The Province is working with a range of partners to help communities and families prepare for climate change, including climate monitoring, the promotion of rain gardens to increase on-site infiltration, strategic tree planting, stewardship and restoration efforts, and the installation of green infrastructure. These are described in further detail below.
Understanding the changing local climate
Mean annual air temperature is increasing (Figure 26), and climate projections forecast air temperature within the watershed will continue to increase. Warmer air temperatures have already contributed to changes in the lake, including increased surface water temperatures during the ice-free period (Figure 27) and a shorter duration of ice cover in the winter.
Linked to increasing air and water temperatures, there is an observed change in the duration of ice cover over the lake (Figure 28). In addition to the local socio-economic impacts of a shorter ice-fishing season, this change can affect the cycling and distribution of oxygen and nutrients in the lake, which are driven by lake temperature. In contrast to air temperature, total annual precipitation has not consistently increased or decreased over the period of record (Figure 29).
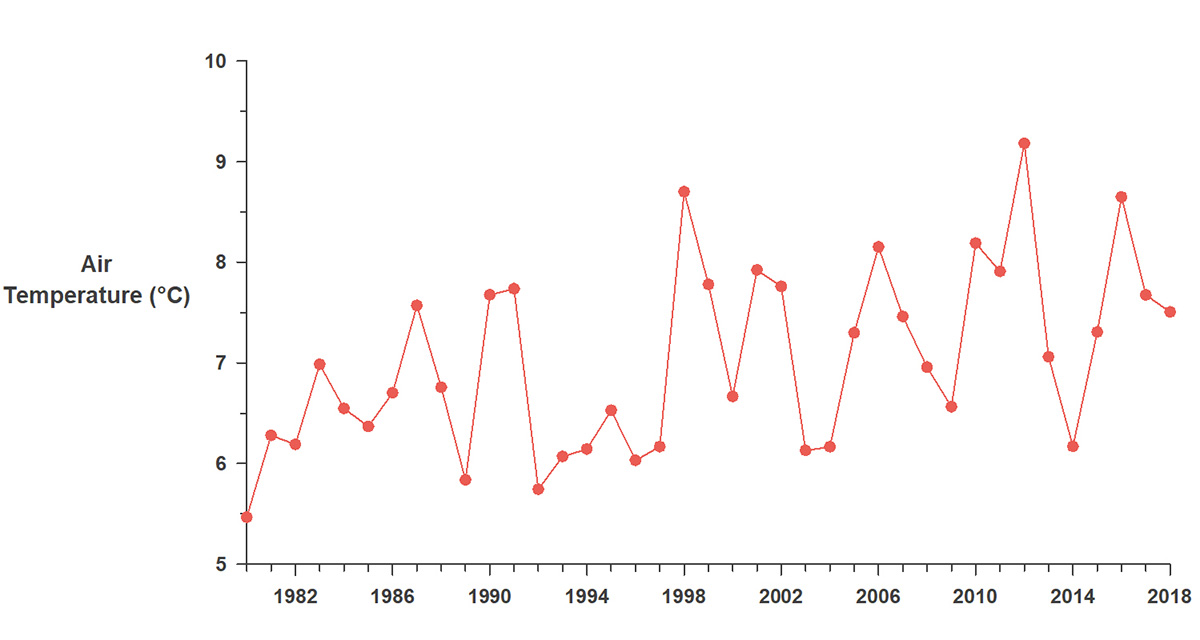
Figure 26: Mean annual air temperature as measured at the Environment and Climate Change Canada weather station located at Shanty Bay on Lake Simcoe.
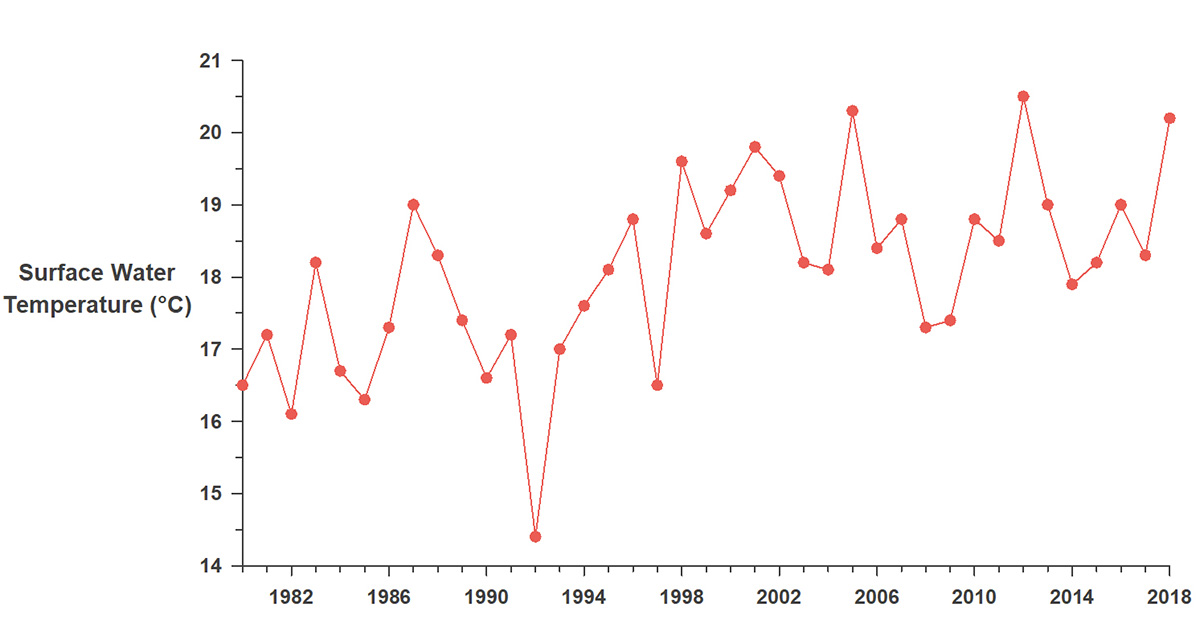
Figure 27: Mean lake water temperature at 1m depth during the ice-free period (May to September), averaged over all lake stations.
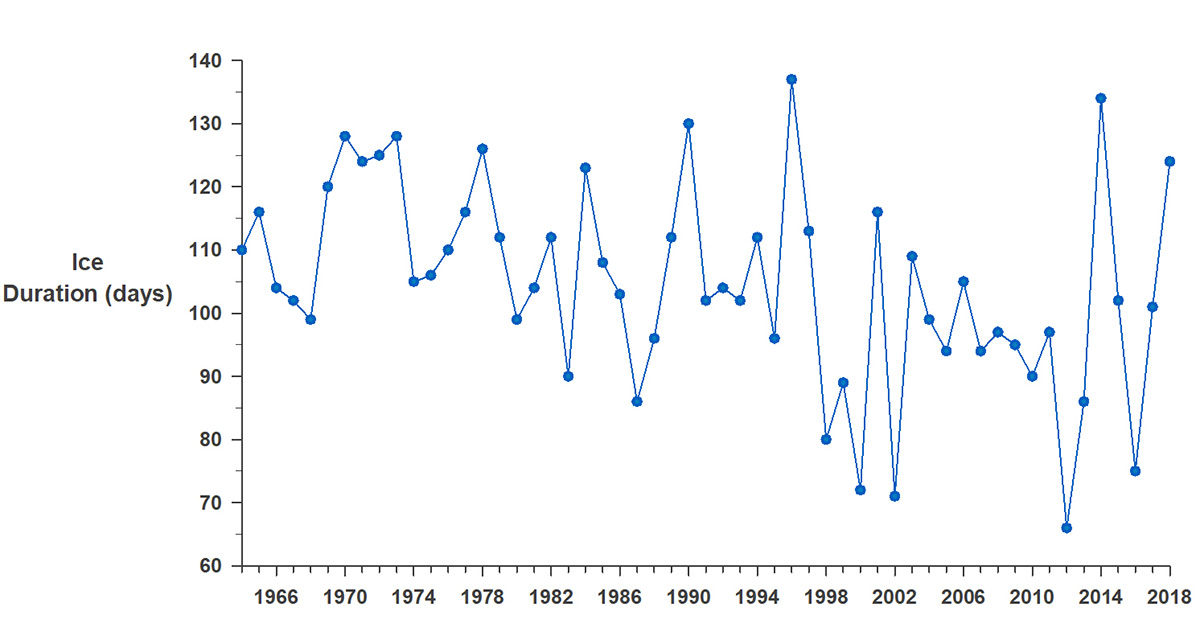
Figure 28: Duration of ice cover on Lake Simcoe from 1964 to 2018.
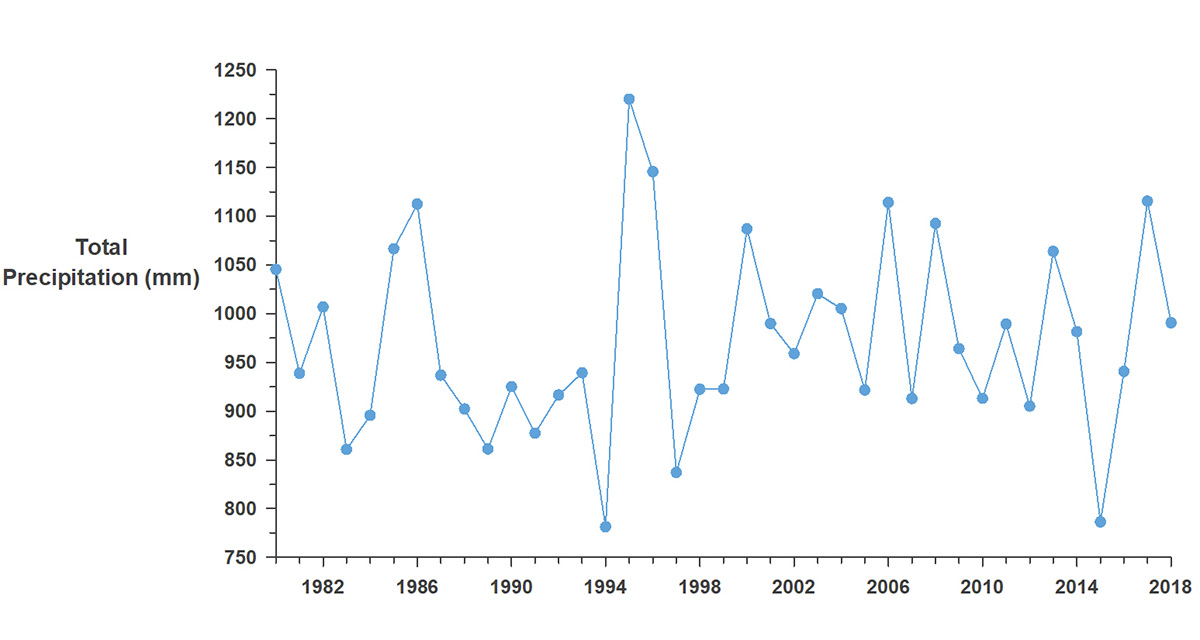
Figure 29: Mean annual precipitation as measured at the Environment and Climate Change Canada weather station located at Shanty Bay on Lake Simcoe.
Changing river dynamics
The Province works with the Lake Simcoe Region Conservation Authority to monitor water levels in streams, watching for changes in flow and corresponding stream health. Through this collaboration, the conservation authority is developing a better way to understand how much water flowing through watershed streams is needed for healthy river ecosystems.
The Lake Simcoe Protection Plan originally contemplated establishing singular 'low-flow' targets for stressed rivers. However, it is now recognized that healthy river ecosystems depend on a full range of flows to support a variety of river functions, commonly referred to as the 'flow regime'. Rivers, and the plants and animals that live in them, have not only adapted to these variations in flow, but many have evolved to rely on this variation for key life cycle functions, such as scouring and cleaning spawning beds or inundating river vegetation that provide habitat.
The goal is now to establish an 'environmental flow regime' that will help in the understanding of the variation in timing, duration, and magnitude of flows in streams. An improved understanding of flow regimes will support decision making where there are competing demands for water.
While the ministry and the Lake Simcoe Region Conservation Authority established a simple flow target for the Maskinonge River (flow greater than zero during summer), the more holistic approach of establishing a target flow regime was more recently applied for Lovers Creek and the East Holland river. For both Lovers Creek and the East Holland River, the most substantial change was an increase in flow volumes associated with urban growth. As such, a key consideration of a target environmental flow regime for each of these systems is the mitigation of high flow volumes.
Since 2009, the Lake Simcoe Region Conservation Authority has provided technical and financial support through their Restoration Assistance Program to implement over 220 streambank and shoreline restoration projects. This has resulted in the restoration of over 9,800 metres of streambank to improve habitat for native fish species, expand riparian cover, and reduce sediment and nutrient inputs to the lake.
Water budgeting and conservation
Water budgets are assessments that quantify existing water supply and demand, identify portions of the landscape that are essential in maintaining sensitive habitat, and forecast water quantity stresses. With funding from the Province and several local municipalities, the Lake Simcoe Region Conservation Authority has established water budgets for all subwatersheds in the basin, as required in the plan. The water budgets are being used to inform municipal water conservation and efficiency plans and municipal decisions concerning growth and development.
To understand how much of the lake's water budget comes from groundwater, the Ministry of the Environment, Conservation and Parks recently funded University of Western Ontario to complete surveys of groundwater discharge to the lake. Results indicated that nearshore groundwater discharge to Lake Simcoe accounts for only 5 to 10 per cent of the inputs to the lake. This result confirms that nearshore groundwater discharge is not a major component of the lake water budget.
A clear understanding of how groundwater moves is also essential for guiding land-use decisions. In early 2018, the ministry provided funding to the Lake Simcoe Region Conservation Authority to collect information about groundwater for the East Holland River subwatershed to help municipal planners and stormwater engineers plan infrastructure options in this stressed subwatershed. This work will help municipalities develop policies that protect the quality and quantity of groundwater in ecologically sensitive groundwater recharge areas, which is a requirement of the plan.
To further support water conservation and efficiency with local businesses in the watershed, the ministry also provided funding to Tourism Barrie, Ryerson University and Regional Tourism Office 7 to promote the adoption of sustainable recreation and tourism practices. Eight sector-specific Greening Guides were created, including operational planning matters and recommendations for efficient resource use (including water conservation). During 2015 and 2016, the Project Coordinator reached out to 300 businesses supporting the development of individual sustainability plans.
Low impact development
Low impact development is a land use planning and engineering design approach to manage stormwater runoff in a way that mimics the natural flow of water by using natural features to encourage on-site infiltration into the soil. This approach minimizes the impact of urban development by reducing the volume of stormwater runoff as well as sediment in runoff.
The Lake Simcoe Region Conservation Authority is supporting the completion of several municipal demonstration projects in Newmarket, Aurora and Bradford/West Gwillimbury to help residents and landowners understand the benefits of low impact development. Several retrofits using low impact development methods have been completed since 2015:
- Aurora Community Centre Parking Lot Project, Aurora
- Kennedy Street, Temperance Street and Ransom Court Road Reconstruction, Aurora
- Forest Glen Project, Newmarket
- Ray Twinney Recreation Complex Parking Lot Project, Newmarket
- Magna Centre Project, Newmarket
- Queen Street Bump out, Newmarket
- Lake Simcoe Region Conservation Authority Head Office Low Impact Development Demonstration Project
- Mary Street Parking Lot Retrofit, Bradford/West Gwillimbury
Since 2009, the conservation authority has delivered workshops with 556 environmental practitioners, and over 536 municipal staff on low impact development as a stormwater tool and is identifying further opportunities to implement in each municipality.
From 2015 to 2017, the Lake Simcoe Region Conservation Authority developed the "Low Impact Development Treatment Train Tool" in partnership with the Credit Valley Conservation and Toronto Region Conservation Authority and with support from the Ministry. This tool provides consistent, open-source, user-friendly methods for assessing low impact development design practices throughout Ontario, to support developers, consultants, municipalities, and landowners. In the Lake Simcoe watershed context, the tool provides practitioners with a way to show how proposed on-site changes will reduce or eliminate phosphorus export, in accordance with the Lake Simcoe phosphorus offset policy.
In 2017, the ministry provided funding to the "Sustainable Technologies Evaluation Program", a multi-agency program led by the Toronto Region Conservation Authority, to improve awareness and knowledge of the recommended best management practices for planning, designing, constructing and inspecting low impact facilities. They did this by developing a "Low Impact Development WIKI", a platform to support the discussion and documentation of these new methods in the Ontario context. These user-friendly web tools help with the design process and help with selecting appropriate best management practices for different development contexts.
Adapting tree planting for climate change
Maintaining, expanding, and enhancing tree canopy cover across the watershed is important for protecting and restoring water quality in the lake. Climate change impacts such as higher temperatures, a longer growing season, and variable precipitation patterns can all impact the health of watershed forests. With funding from the Ministry of the Environment, Conservation and Parks, the Lake Simcoe Region Conservation Authority completed a comprehensive study in 2018 to address the challenges facing local forests as a result of climate change. Using climatic range projections, the study, "Adapting Forestry Programs for Climate Change" resulted in a suite of recommendations for adapting forest and tree management, and a revised list of tree and shrub species that will be more resilient in this watershed. The conservation authority is incorporating those species into their programming, and sharing information with partner municipalities, conservation authorities, and environmental non governmental organizations within the Lake Simcoe watershed.
Partnering with Indigenous communities for climate adaptation
The Province is committed to building and sustaining relationships with First Nations in the implementation of the Lake Simcoe Protection Plan. The Chippewas of Georgina Island First Nation have been an active participant in the design, development and implementation of several initiatives under the plan. In 2015 and 2016, the Province provided funding to support the Chippewas of Georgina Island First Nation with the development of a local Climate Change Adaptation Strategy that incorporates traditional ecological knowledge about changing climate and weather, plants, animals, land and water. This work was expanded to the First Nation Communities of Beausoleil and Rama, with a focus on improving their capacity to adapt to climate change and mitigate impacts to lands and waters, including those in the Lake Simcoe watershed.
Plan priority: protecting and enhancing natural heritage
The Lake Simcoe Protection Plan and the Made-in-Ontario Environment Plan recognize the importance of natural heritage areas (e.g. woodlands, wetlands), parks, and green spaces to the overall health of the ecosystem. These areas provide essential functions, cultural, social and economic benefits, and are closely linked to water quality and quantity.
The Lake Simcoe Protection Plan builds on the protections for the Lake Simcoe watershed that are provided by provincial plans that apply in all or part of the watershed, including the Oak Ridges Moraine Conservation Plan, the Greenbelt Plan, and "A Place to Grow: Growth Plan for the Greater Golden Horseshoe".
In February 2018, the Province released a Natural Heritage System that supports the policies of 'A Place to Grow'. With this addition, the Province identified natural heritage system mapping is available at a regional scale for the entire Lake Simcoe watershed, outside of existing settlement areas.
The Lake Simcoe Region Conservation Authority also finalized their Natural Heritage System and Restoration Strategy for the Lake Simcoe watershed in 2018. The strategy recognizes that natural heritage features play a critical role in mitigating the impacts of urban expansion and climate change, while also providing many benefits to the people that reside in the watershed. As part of the strategy, the conservation authority identified and mapped core natural heritage features and targeted enhancement opportunities. Working with other stakeholders and partners, the conservation authority is leading the implementation of 39 action items to achieve a more resilient natural heritage system that will ultimately result in a healthier Lake Simcoe.
Taking action to protect and restore greenspace
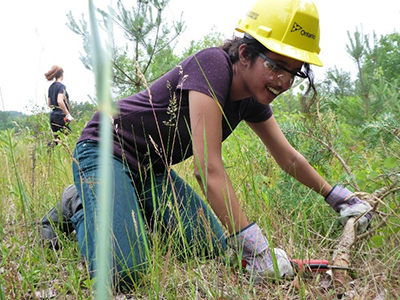
The Lake Simcoe watershed has benefited from dedicated Ministry of Natural Resources and Forestry's Stewardship Youth Ranger teams from 2014 to 2018. Rangers have provided hands-on support to a variety of partners implementing on-the-ground stewardship projects (Figure 30). Youth rangers have worked on projects such as trail maintenance and development, invasive species monitoring and removal, native tree plantings, shoreline clean-ups, learn to fish events, and fish and wildlife surveys.
In addition to youth rangers, the Ministry of Natural Resources and Forestry has supported many restoration projects through partnerships across the watershed. Agencies such as Ontario Streams and South Simcoe Stream Network have undertaken stream enhancement and riparian planting projects, and wetlands have been created and restored through Ducks Unlimited.
The South Simcoe Streams Network, in partnership with the Town of Innisfil, the Lake Simcoe Region Conservation Authority, Dufferin Simcoe Land Stewardship Network, Ducks Unlimited and the Ministry of Natural Resources and Forestry, completed the decommissioning of the Centennial Park Pond in the headwaters of Lovers Creek in 2016. This project aimed to improve fish passage, mitigate thermal impacts from the pond, and restore the flow and sediment regime in the creek. Approximately 1.4 hectares of existing wetland and aquatic ecosystem was restored, and 0.1 hectares of habitat was created through the construction of a bypass channel (Figure 31 and Figure 32).
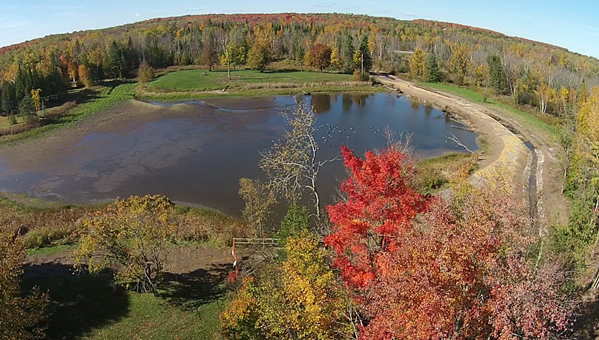
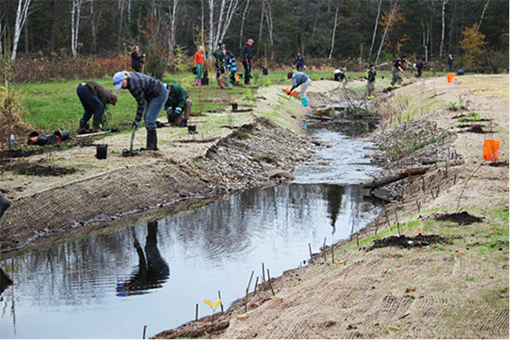
The Ministry of Natural Resources and Forestry also funded the Lake Simcoe Community Stewardship Program through between 2009 to 2012, which provided financial and technical support to watershed landowners. The program continued as the Lake Simcoe and Georgian Bay Stewardship Program until 2017, through the Dufferin Simcoe Land Stewardship Network. This program supported the implementation of on-the-ground stewardship projects that targeted shoreline, riparian, and natural heritage features such as wetlands to reduce nutrient inputs and help restore natural habitats within the watershed.
Some of the estimated program accomplishments between 2008 and 2017 include:
- over 50 stewardship projects completed
- restoration of 15 km of degraded shorelines
- 55,000 trees and shrubs planted
- 120 ha of wetlands created or restored
- 160 failed septic systems repaired or replaced
Lake Simcoe Wild Rice Restoration Project
From 2010 to 2018, the Ministry of Natural Resources and Forestry led the Lake Simcoe wild rice restoration project, in partnership with Chippewas of Georgina Island and Rama First Nations. Given the traditional use of wild rice by First Nation communities in the watershed and its ecological importance (e.g. provision of nursery habitat for young fish, cover for a variety of large warm-water species, and a preferred food source for waterfowl), the project aimed to restore the wild rice population in areas where it once flourished. Other partners such as Ontario Streams, Aurora Bassmasters, and Floating Leaf Fine Foods, also supported wild rice restoration efforts within Lake Simcoe and nearby Lake Couchiching. To date, plantings have restored colonies along the south shore of Georgina Island, the Talbot River and Barnstable Bay. The last planting in 2018 was in the Atherley Narrows area and Lake Couchiching. While the harvest of wild rice for food purposes is one of the goals of this program, currently, partners agree that any colonies beginning to establish should be left alone until they are large enough to sustain harvest.
Tracking changes in the landscape
The Ministry of Natural Resources and Forestry has assessed changes in woodland and wetland cover in the Lake Simcoe Protection Act study area over a 10-year period from 2005 to 2015, using data from the Southern Ontario Land Resource Information System (Table 2). The trends show minimal woodland and wetland losses over a 10-year period from 2005 to 2015 (woodland area decreased by 1 per cent and wetland area decreased by < 1 per cent). The values are consistent over the two, five-year periods (2005 to 2010 and 2010 to 2015). All wetland losses occurred inland from Lake Simcoe, while coastal wetlands (those located along Lake Simcoe and the Holland River shorelines where they are influenced by Lake Simcoe water levels) remained intact for the 10-year period observed.
| Land cover class | Year 2000 baseline inventory (hectares) | Year 2005 baseline inventory (hectares) | Year 2010 baseline inventory (hectares) | Year 2015 baseline inventory (hectares) |
|---|---|---|---|---|
| Woodlands | 41,927 | 41,710 | 41,494 | 41,206 |
| Wetlands (total) | 49,635 | 49,404 | 49,211 | 48,985 |
| Coastal wetlands | 2,262 | 2,262 | 2,262 | 2,262 |
| Inland wetlands | 47,373 | 47,142 | 46,949 | 46,723 |
To help achieve the plan's 40 per cent natural vegetative cover for the Lake Simcoe watershed, the Lake Simcoe Region Conservation Authority formalized an Ecological Offsetting Policy in 2017. This policy addresses the loss of natural heritage features that is sometimes necessary to allow for development. When a feature is lost from the landscape, the policy requires the land developer to recreate the feature in another location at a ratio of 2:1 for woodland and 3:1 for wetlands, ensuring that the total natural cover in the watershed is maintained and improved. It strikes an important balance between conservation and economic growth by facilitating development on strategically important land while upholding the principle of “no net loss”. Recognizing that not all natural heritage features can be easily replaced, ecological offsetting is only considered when there is no other option. The implementation of this policy is being led by the Lake Simcoe Region Conservation Authority and supported by municipalities as well as the development community within the watershed.
Assessing high quality natural cover
The Lake Simcoe Protection Plan includes a target of 40 per cent high quality natural vegetative cover in the watershed. Natural cover includes woodlands, swamps, non-treed wetlands, grasslands, alvar (a grassland that supports a distinctive group of prairie-like plants), prairie grasslands, sand barrens and savannah. In 2008/2009, the watershed had 35 per cent overall natural cover, but no information or methodology existed to determine how much of that was ‘high quality'. To define high-quality natural cover, both structural (how much) and compositional (what kind) vegetation indicators are required, which could only be obtained from a carefully designed site-level monitoring program.
The Ministry of Natural Resources and Forestry, and the Ministry of the Environment, Conservation and Parks, worked together with the University of Toronto to develop a monitoring program for the watershed based on the Vegetation Sampling Protocol. In 2017, the first broad-scale baseline sampling and assessment of natural cover in the watershed was implemented. This effort was informed by four previous years of pilot programs, sampling, research and landowner contacts throughout the watershed. In 2017, a total of 422 plots were sampled in natural areas throughout the Lake Simcoe watershed, covering 19 out of 20 subwatersheds, and exceeding the set target of 350 plots (Figure 33). Through the 2017 work, the necessary field data were collected at plots and further used for establishing the baseline condition and development of a high quality of natural cover index. We also have identified and mapped areas of high quality natural cover that are 25 hectares or greater, and data are available on Ontario's Data Catalogue.
The high quality of natural cover index is a composite measure based on several individual indicators of quality. Indicators that are included in defining 'high quality' depend on the natural cover type including aboveground biomass, floristic quality, weedless index, dead aboveground biomass, forest regeneration and vertical forest structure index.
Each of these individual indices, as well as the composite 'high quality' index, can be derived for each of the sampling locations and further used to support their modelling and mapping across the entire watershed in the future. Maps of modelled indices across the entire watershed will inform adaptive management actions and decisions to work towards achieving the plan target of 40 per cent high-quality natural vegetative cover.
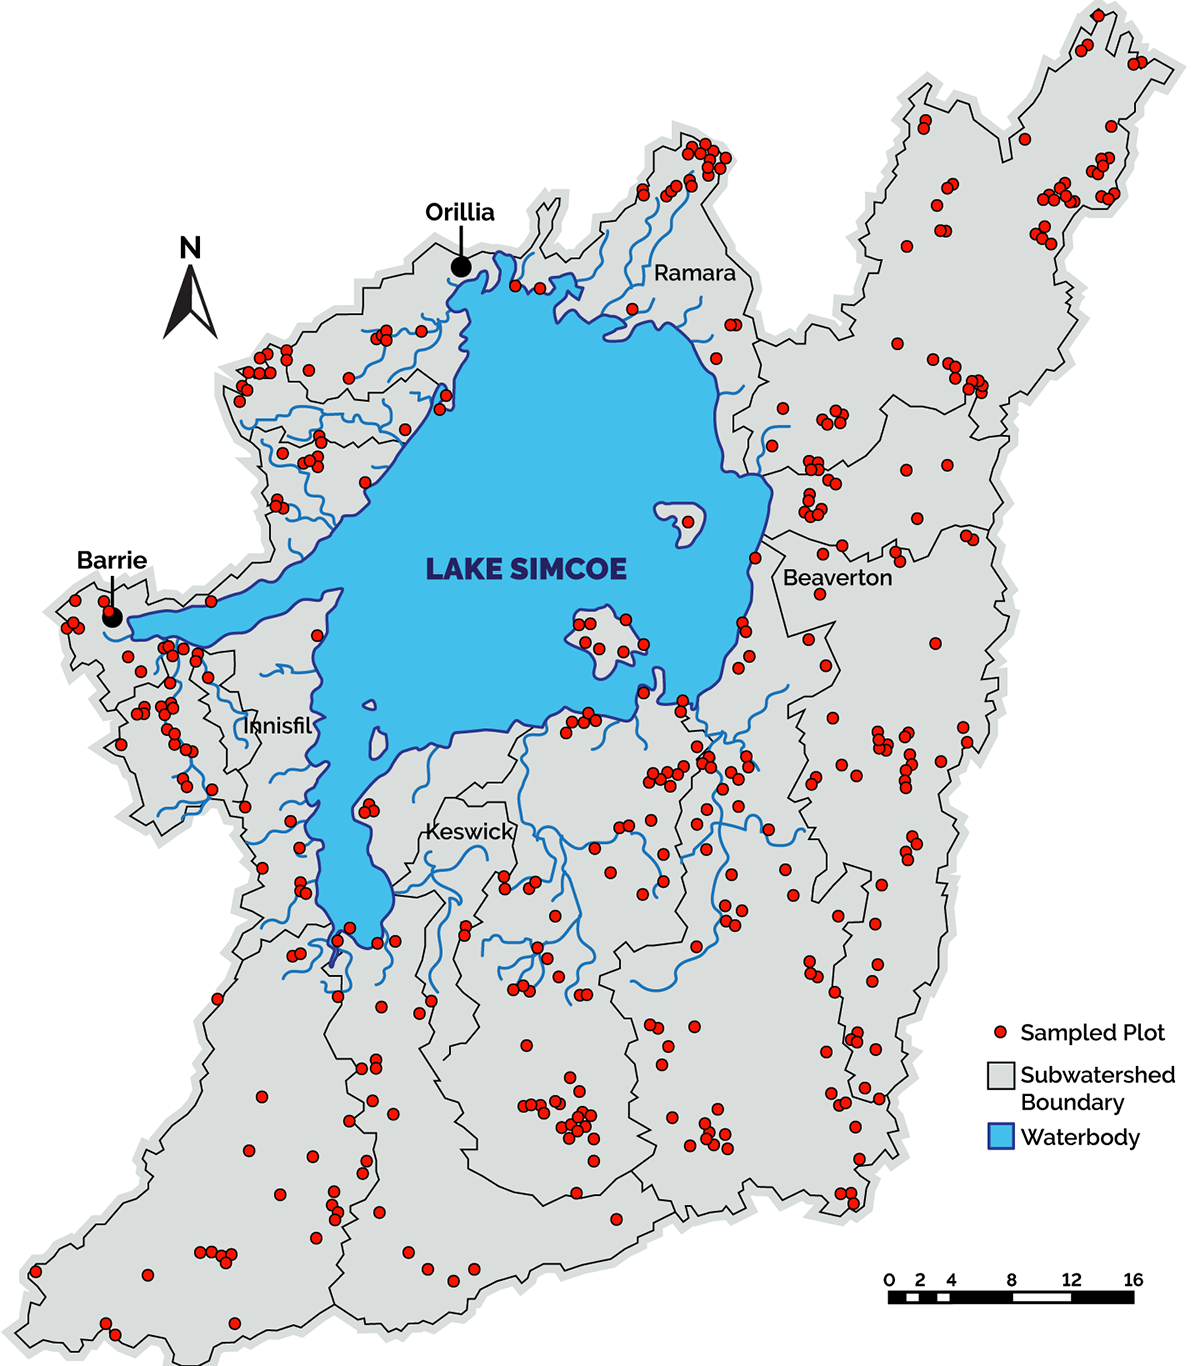
Figure 33: Vegetation Sampling Protocol (VSP) sites sampled in the Lake Simcoe watershed, between May 30 and August 28, 2017.
Biomass and carbon estimation
Forests are the predominant natural vegetation of the Lake Simcoe watershed. They represent the main building blocks of resilient and functional landscapes and are relatively low-cost options to enhance terrestrial carbon storage and help reduce greenhouse gases in the atmosphere. Forest ecosystems' productivity and their ability to support crucial ecological functions such as nutrient cycling, habitat provisioning, maintenance of the hydrological cycle, carbon sequestration and storage, can be expressed through live above-ground biomass. The aboveground forest biomass is one of the terrestrial monitoring indicators that also serves as a measure of carbon stock. By combining field data from the Vegetation Sampling Protocol project with remote sensing information, the University of Toronto, with support from the Province, created maps to estimate the amount of forest biomass and carbon across the landscape within the watershed.
These maps are an intuitive way to engage stakeholders and landowners in discussions related to carbon offset markets and climate change mitigation actions, as they are able to easily see the potential estimates of carbon stock. These maps can also serve to show significant variation in stored carbon due to forest types, age, and site productivity.
The resulting maps will allow for timely watershed management actions to be implemented informing natural heritage system design and land use planning. They will also help in identifying locations to implement response activities to mitigate the presence of invasive plants species that have been found within the watershed.
Aquatic plant communities
Monitoring by the Lake Simcoe Region Conservation Authority has shown that the aquatic plant community of Lake Simcoe has undergone marked changes since the implementation of the plan. While most aquatic plants are a natural, normal and necessary part of a healthy lake ecosystem, providing shelter for fish, slowing shoreline erosion, and allowing sediments to settle, several invasive aquatic plants are affecting species diversity and changing shallow water habitat.
The three maps in Figure 34 show the total amount of aquatic plants in the lake, based on samples from over 200 sites, with darker green indicating a higher amount of plants. Twenty-three submerged plant species have been recorded in the lake, three of which are invasive: eurasian watermilfoil (first reported in 1984), curly-leaf pondweed (1984), and starry stonewort (2009). Lake areas with higher amounts of plant growth have continued to see increases, due to suitable habitat (high light levels, shelter from wind and waves, and soft sediments for attachments) and increases in invasive species densities.
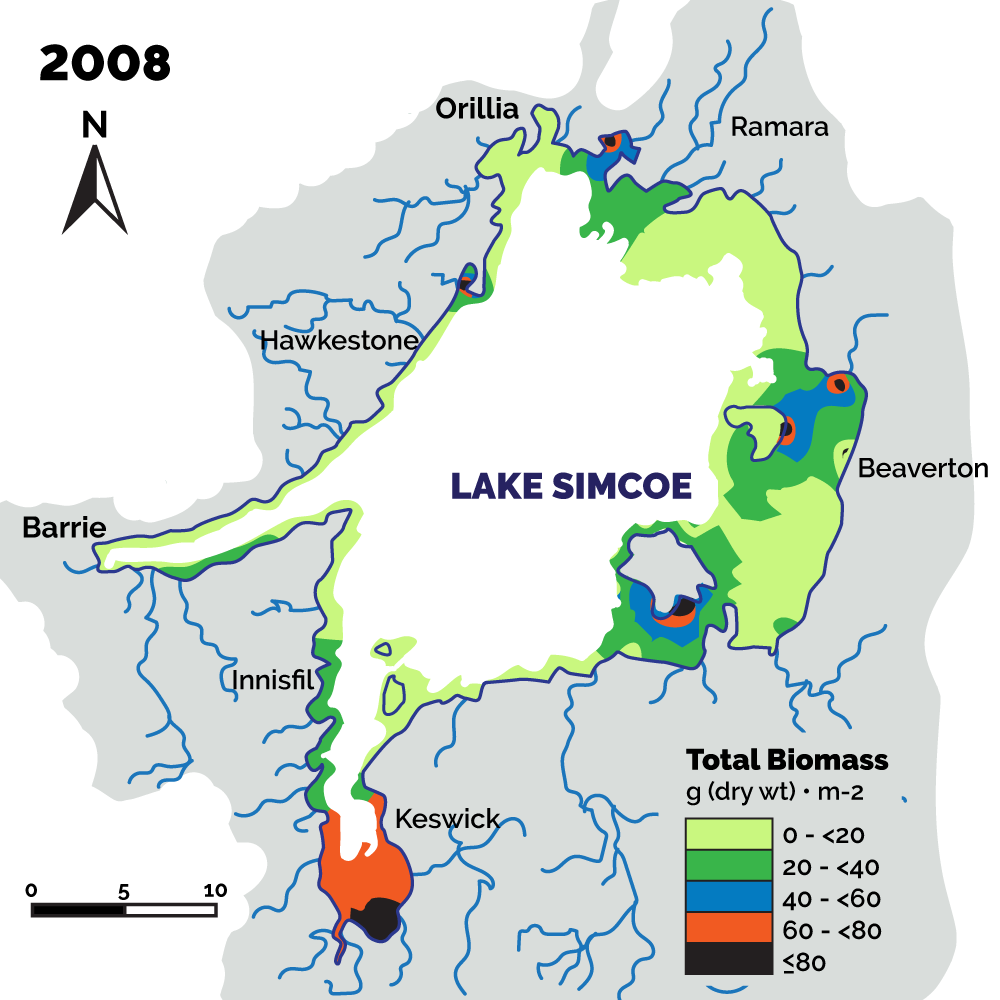
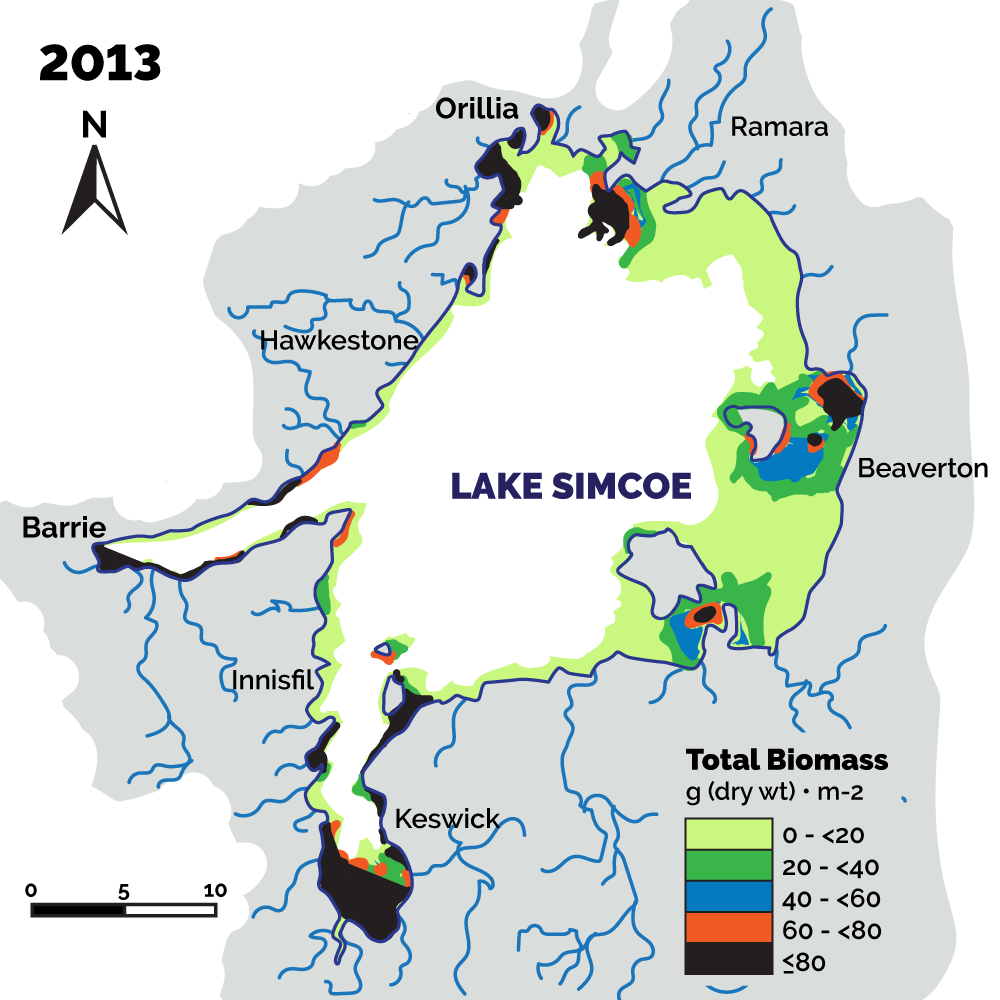
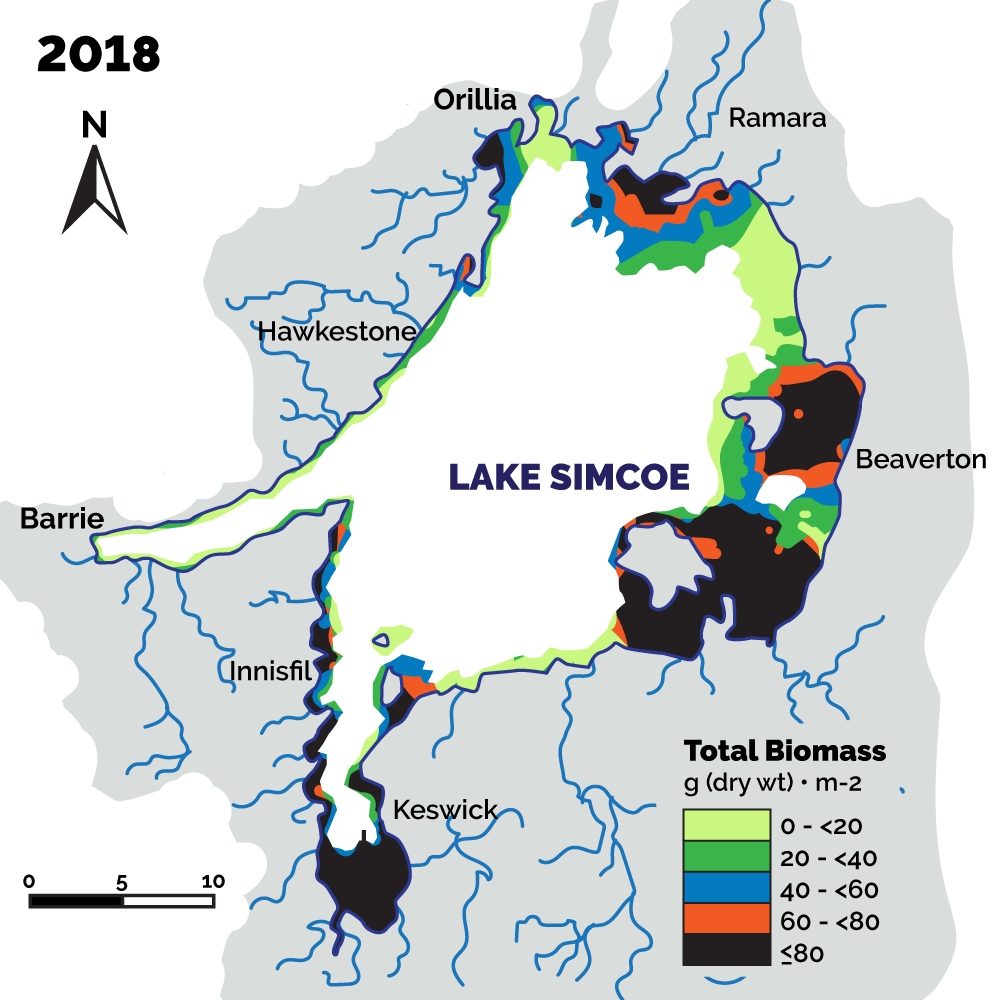
Figure 34: Aquatic plants in Lake Simcoe over time, based on samples from over 200 sites.
Plan priority: addressing invasive species
The Made-in-Ontario Environment Plan identifies invasive species as a significant environmental concern. Invasive species can impact native fish and wildlife, and are the second leading cause of global biodiversity loss. They also hurt the economy both locally and provincially. For example, starry stonewort, an aquatic invader, which grows in dense mats, can impact boating, swimming, and other recreational activities in Lake Simcoe.
Figure 35: Lake Simcoe invasive species watch list
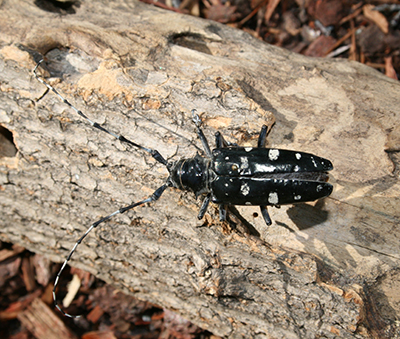
Threats to forests
- Asian Long-horned Beetle
- Hemlock Wooly Adelgid
- Kudzu
- Oak Wilt
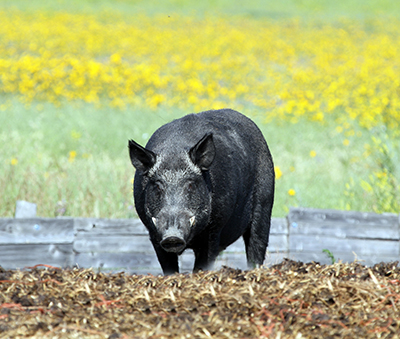
Threats to wildlife
- Wild Boar
- Chronic Wasting Disease
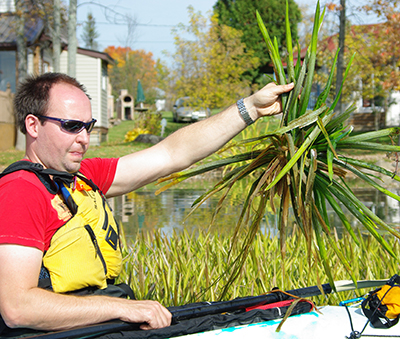
Threats to water
- Water Soldier
- Parrot's Feather
- Hydrilla
- Brazilian Elodea
- Fanwort
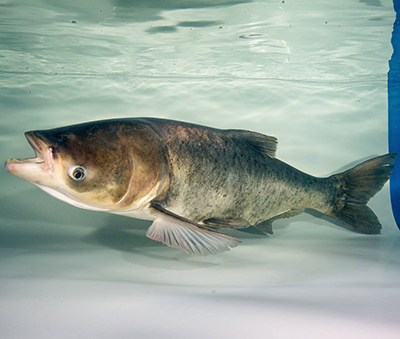
Threats to aquatic life
- Asian Carps
- Northern Snakehead
- Stone Moroko
- Yabby Crayfish
- Wels Catfish
- Tench
A recent study by the Invasive Species Centre estimated impacts of invasive species in Ontario at $3.6 billion annually with municipalities and conservation authorities spending at least $50.8 million between 2017 and 2019. Estimated annual expenditures on invasive species control and management by nine lower and upper tier municipalities, and one conservation authority occurring within the Lake Simcoe watershed were $3.73 million. Preventing invasive species from arriving and establishing themselves is the single most effective and least costly method to manage invasive species.
Ontario is working with several conservation partners in the Lake Simcoe watershed to coordinate prevention, control, research and management activities to help address this serious threat. Raising public awareness and engaging individuals in taking preventive action is key in preventing new species from arriving and surviving.
Ontario's Invasive Species Act
In 2009, regulatory tools available for addressing invasive species were limited in scope. In 2015, Ontario passed the Invasive Species Act. The legislation and accompanying regulation (Ontario Regulation 354/16) came into force in 2016. The act focuses on preventing the introduction and spread of invasive species (both terrestrial and aquatic) that threaten the natural environment of Ontario. It provides legislative tools to prohibit and restrict certain invasive species and carriers (pathways) that help invasive species spread.
Of the invasive species on the Lake Simcoe Watch List (Figure 35), 13 were regulated as prohibited species under the act in 2016. Additional invasive species may be considered for regulation under the act that could support prevention efforts to Lake Simcoe. Key pathways for invasive species introduction (e.g. recreational boating) may also be considered for regulation under the act.
Preventing invasive species in Lake Simcoe
Guided by the plan, the Ministry of Natural Resources and Forestry established a Lake Simcoe Invasive Species Watch List to focus and prioritize prevention efforts for the highest risk invasive species that threaten the Lake Simcoe watershed. Twenty-one invasive species that threaten Lake Simcoe's natural environment were identified and include those listed in Figure 35.
The Ministry of Natural Resources and Forestry and partners have led several actions to stop these harmful species from entering the watershed and becoming established. In 2016, 13 species on the Lake Simcoe Watch list were regulated as prohibited invasive species under Ontario's Invasive Species Act. Additional watch list species are also under consideration for regulation, where these species are not already effectively addressed under existing provincial or federal legislation. To further support early detection and response actions, the ministry and partners have promoted citizen reporting, through tools such as the Early Detection and Distribution Mapping System for Ontario. This has been an important tool to provide real time tracking of invasive species occurrences in Ontario. The ministry has partnered with the Ontario Federation of Anglers and Hunters and others to raise awareness and implement strong community outreach programs to engage anglers, boaters and gardeners in prevention efforts, including:
- Operation Boat Clean 2014–2017 (4000 boaters and anglers reached)
- Operation Bait Bucket 2011–2017 (6000 ice anglers reached)
- Clean Boats / Clean Tournaments 2016/2017 (10 tournaments)
- promoted the Ontario Invasive Plant Council's Grow Me Instead program, and native plant alternatives at garden centres
The use and movement of bait (i.e. baitfish, leeches) for fishing is also a potential pathway for the spread of aquatic invasive species and disease. Over the past 10 years the ministry has taken the following steps to reduce the risk of spreading aquatic invasive species in the Lake Simcoe watershed through commercial bait activities:
- Establishment of the Lake Simcoe Management Zone, which restricts the commercial movement of live and dead baitfish harvested from outside the watershed from coming into this zone.
- Restricting commercial bait operators from holding live baitfish in ponds located within the floodplain unless prescribed measures are in place to prevent the accidental escapement/release of organisms into Lake Simcoe or receiving waters.
- Restricting the holding of live baitfish in a live holding device in natural streams, rivers, ponds or lakes within the Lake Simcoe and Lake Couchiching watersheds unless the baitfish originate from those waters.
- Completing a comprehensive review of its existing bait policies and proposing a new policy framework for bait ‘Ontario's Sustainable Bait Management Strategy'. The proposed policy is intended to help reduce the ecological risks associated with the harvest, movement and use of bait while still providing flexibility for anglers and commercial bait operators.
Water Soldier
Recent success by the Ministry of Natural Resources and Forestry to control the invasive plant water soldier demonstrates the importance of efforts in place to address invasive species. Water Soldier is an aquatic plant native to Europe that was sold for water gardens prior to its regulation in 2016. Upon its detection in Black River in 2015, the ministry partnered with key stakeholders to quickly develop and implement a rapid response plan to contain and control the spread of this plant. Control efforts continued into the fall of 2016 and monitoring efforts occurred through 2017 and 2018 (Figure 36 and Figure 37). Follow-up monitoring suggests that these efforts were successful in removing the plant from the site.
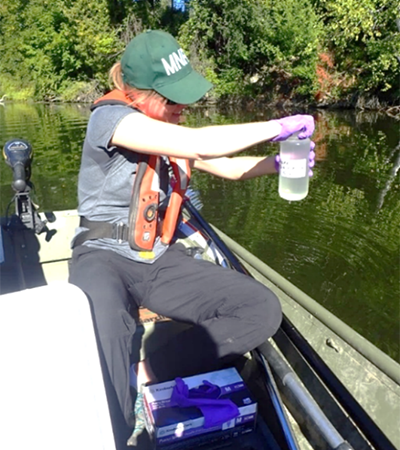
Figure 36: Ministry of Natural Resources and Forestry staff collecting eDNA sampling to monitor water soldier eradication efforts.
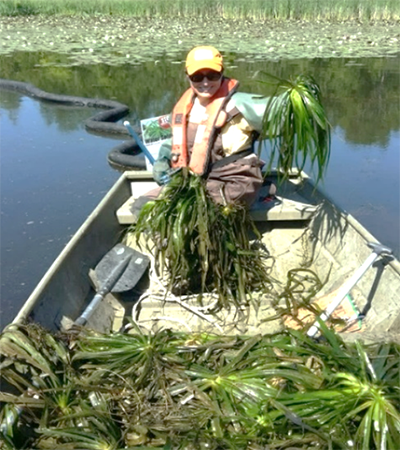
Figure 37: Ministry of Natural Resources and Forestry staff removing water soldier plants from Black River.
Zebra and Quagga Mussels
Some invasive species, such as zebra and quagga mussels, have been present in Lake Simcoe for many years and cannot be eradicated. The Lake Simcoe Region Conservation Authority carries out ongoing monitoring to track the spread and abundance of invasive mussels, and their impact to the Lake Simcoe ecosystem. They have found that the largest change in the invertebrate community that lives on the bottom of Lake Simcoe has been a shift in dominance from zebra to quagga mussels. This change occurred in Lake Simcoe around 2010 and is consistent with changes reported in other lakes where both invasive mussel species are present. Quagga mussels are outcompeting zebra mussels for food and suitable habitat. Quagga mussels, which have the advantage of being active for feeding and reproducing at lower water temperatures, can withstand longer periods of low food (algae) availability, and are able to colonize soft substrates at the lake bottom. This ability to colonize soft sediments has opened up the deeper areas of Lake Simcoe (below 20-m water depth where the lake bottom is mainly fine silt) to colonization by quagga mussels.
The maps in Figure 38 show a change in the amount of zebra and quagga mussels recorded in two surveys of over 700 sites each carried out in 2009 and 2015. The darker colours indicate higher amounts of each species. There was a large reduction in the amount of zebra mussels between 2009 and 2015, as well as an increase in quagga mussels, particularly in the deep water areas of the main basin and Kempenfelt Bay. Annual monitoring to 2017 has shown a continuation of the shift to quagga mussels at deeper depths of the lake.
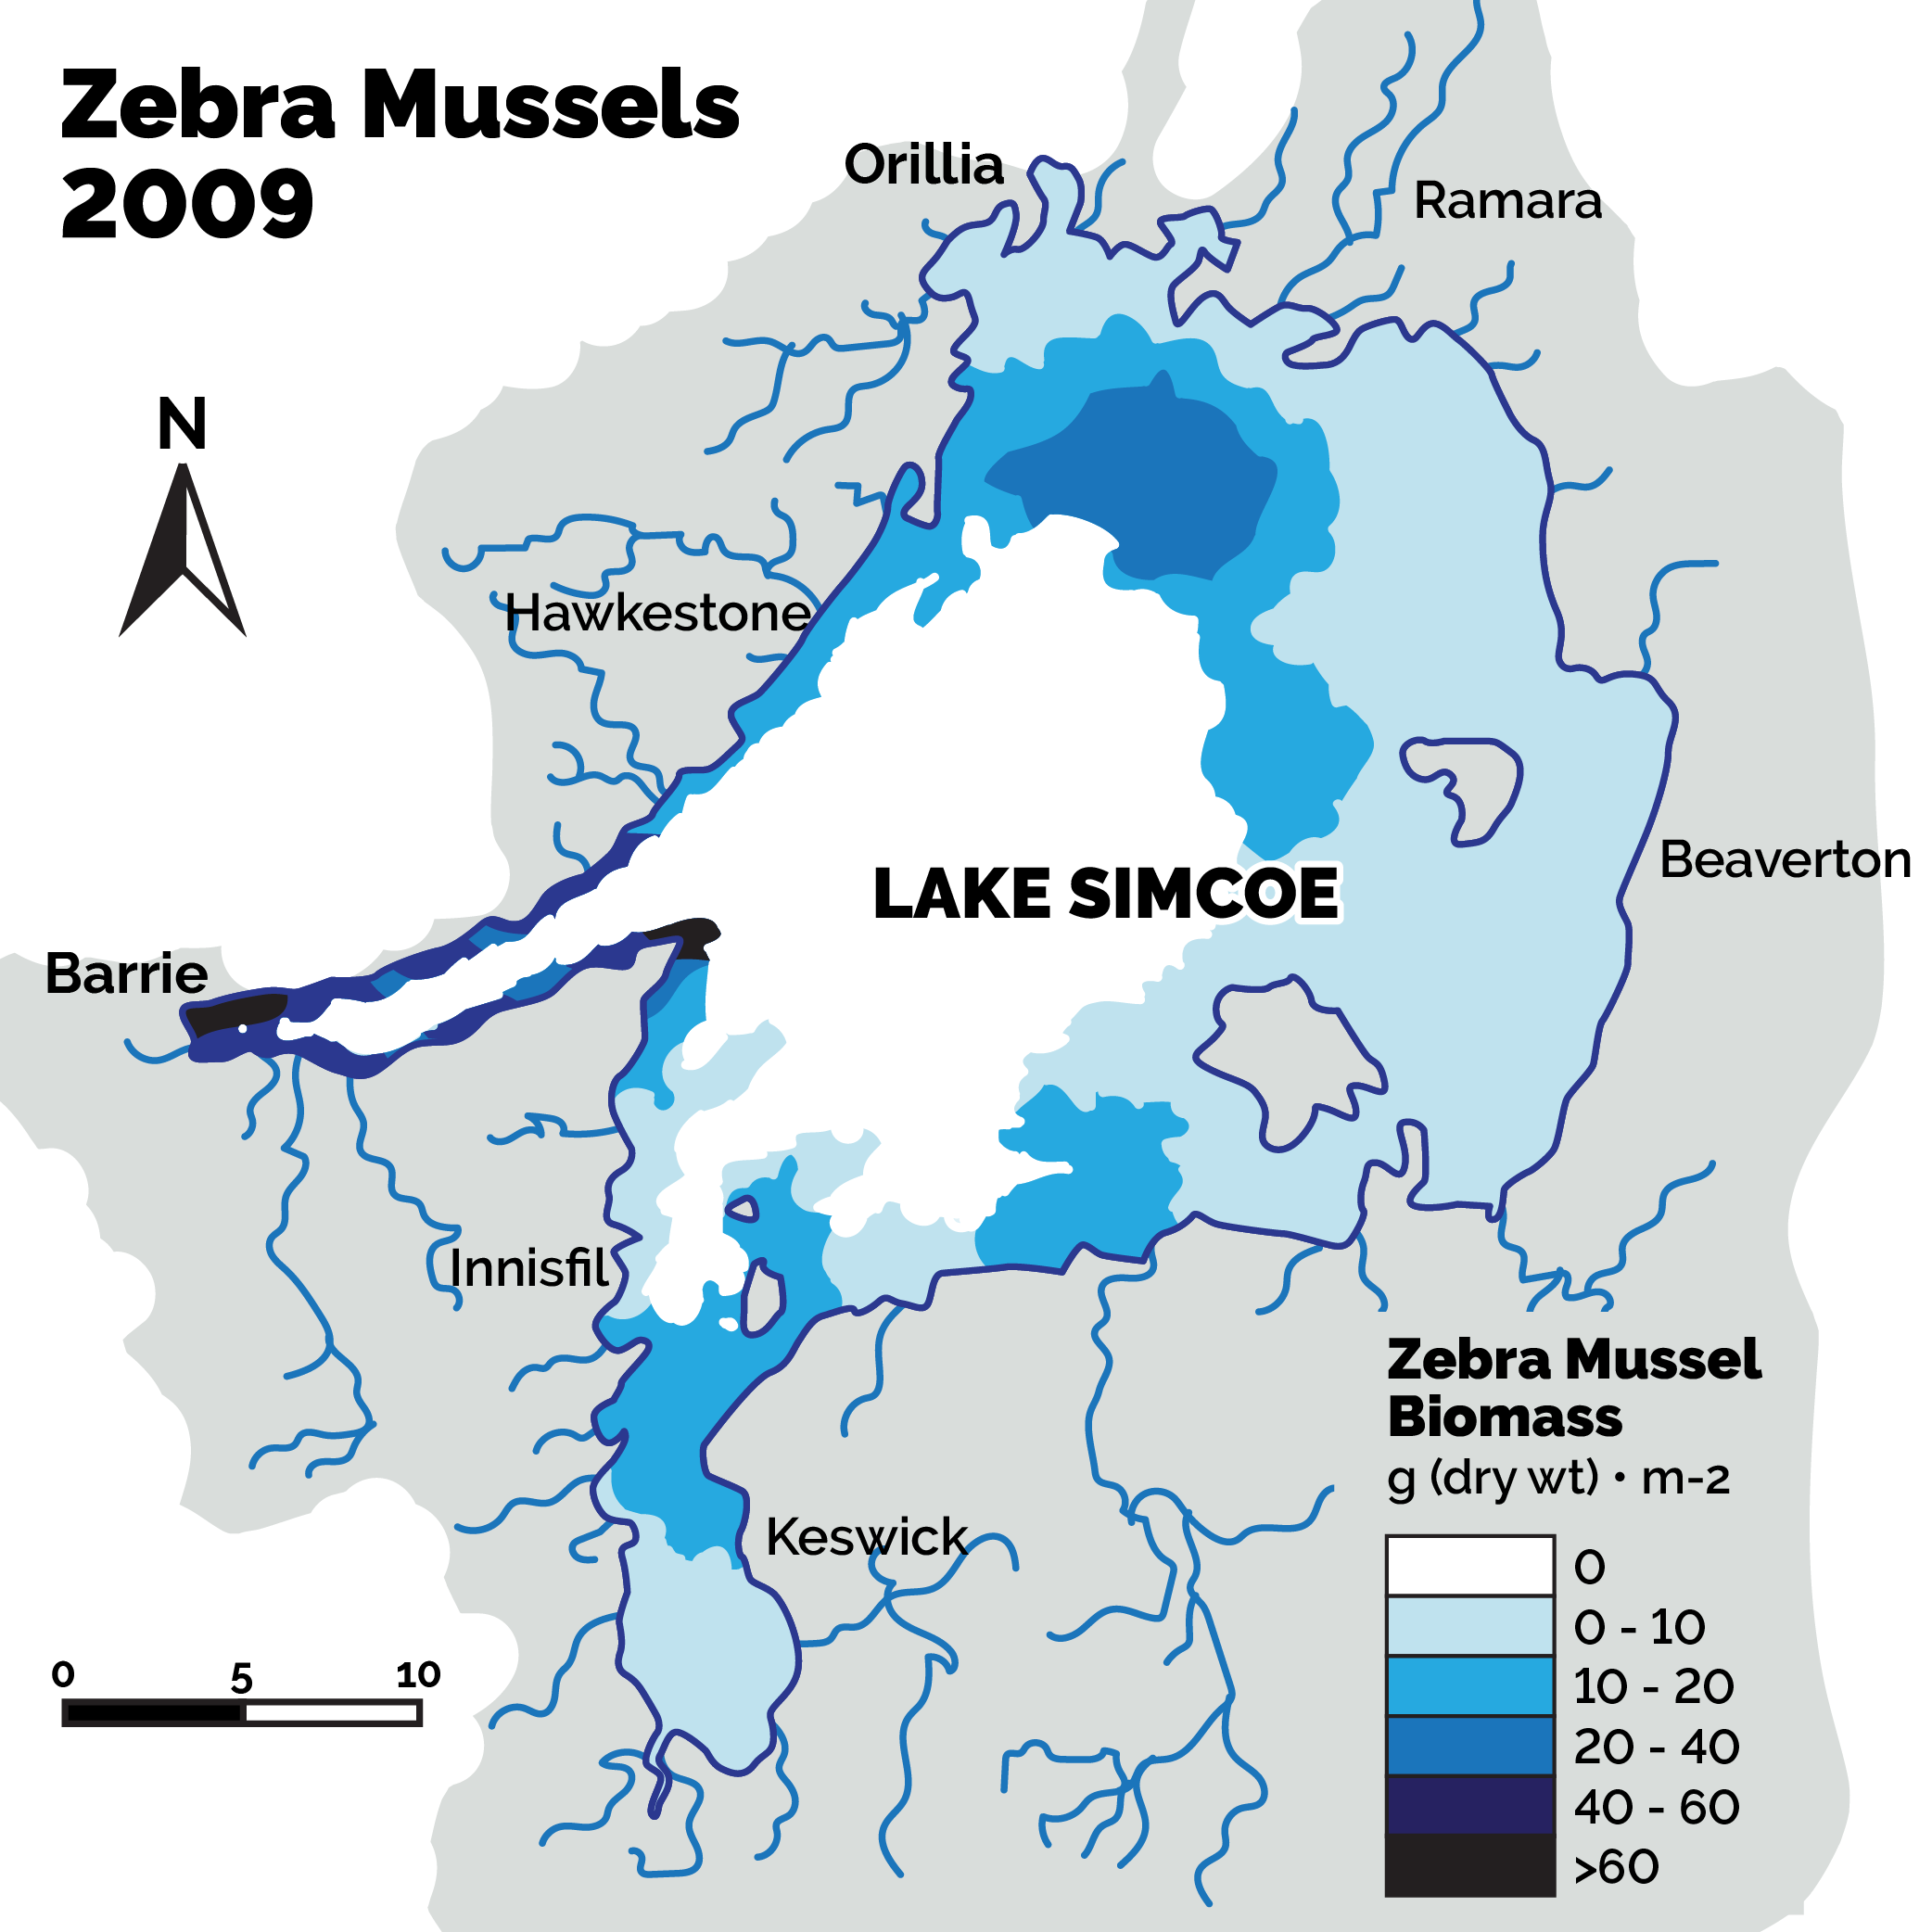
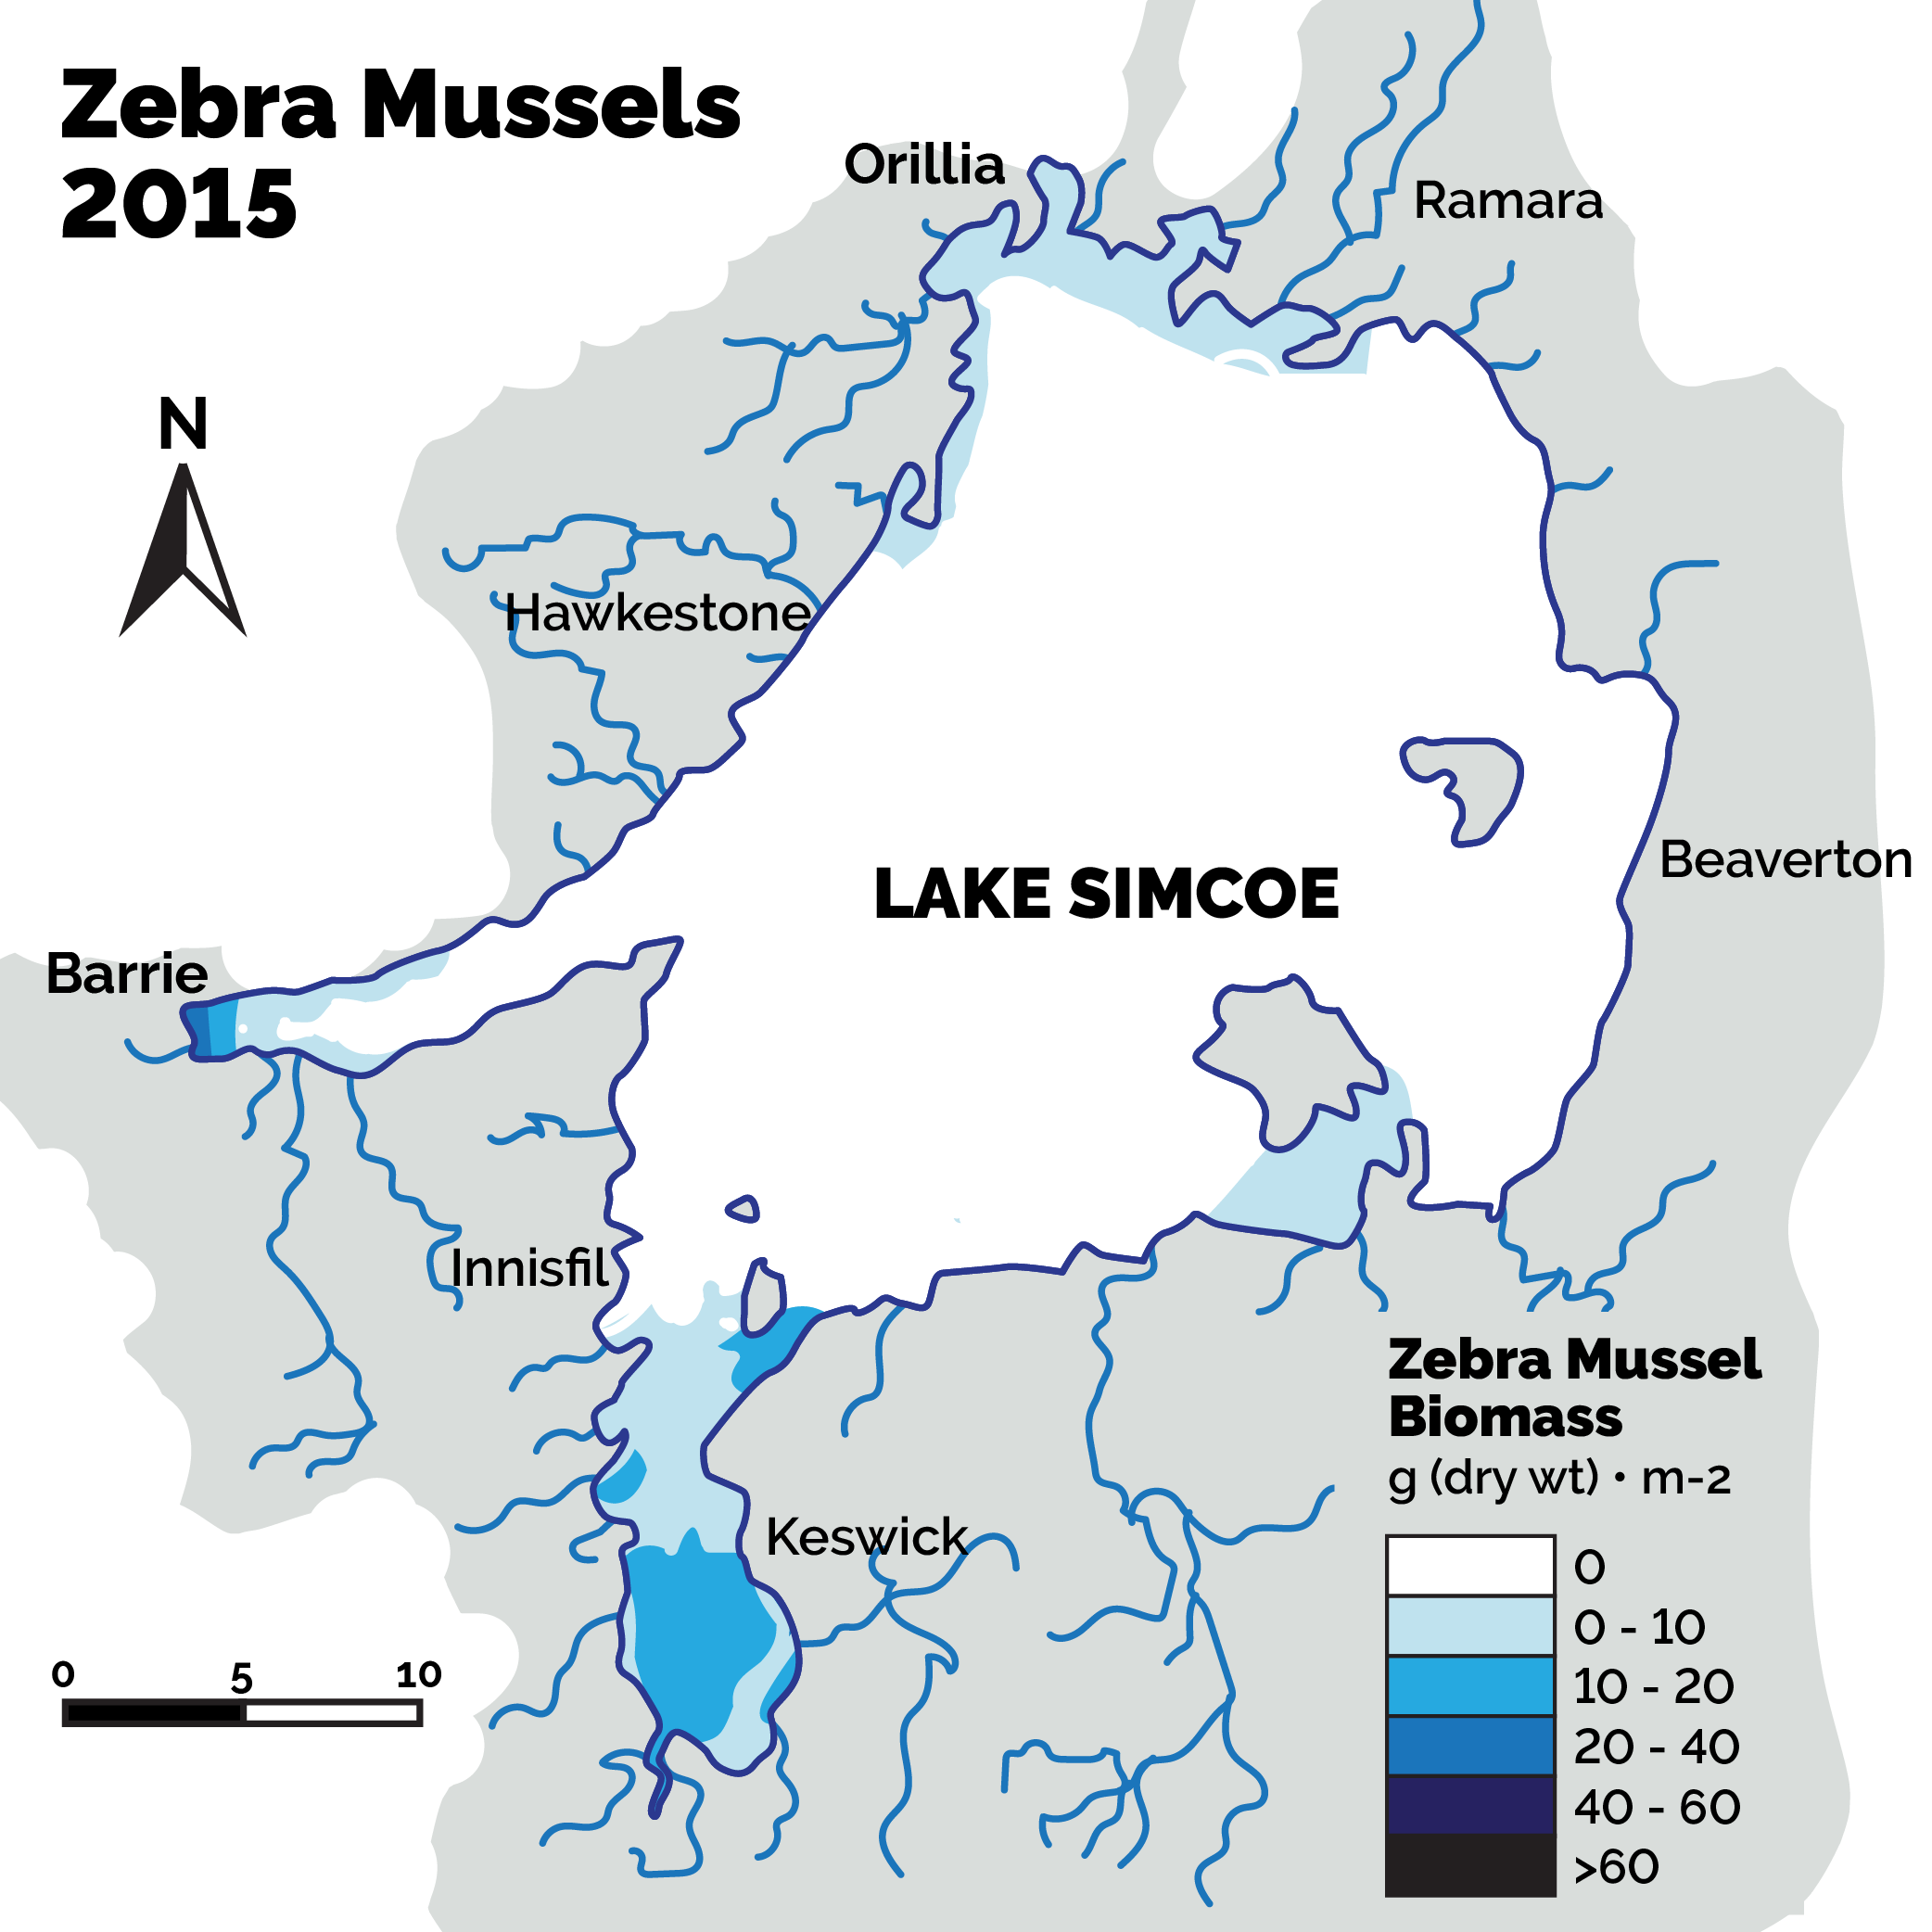
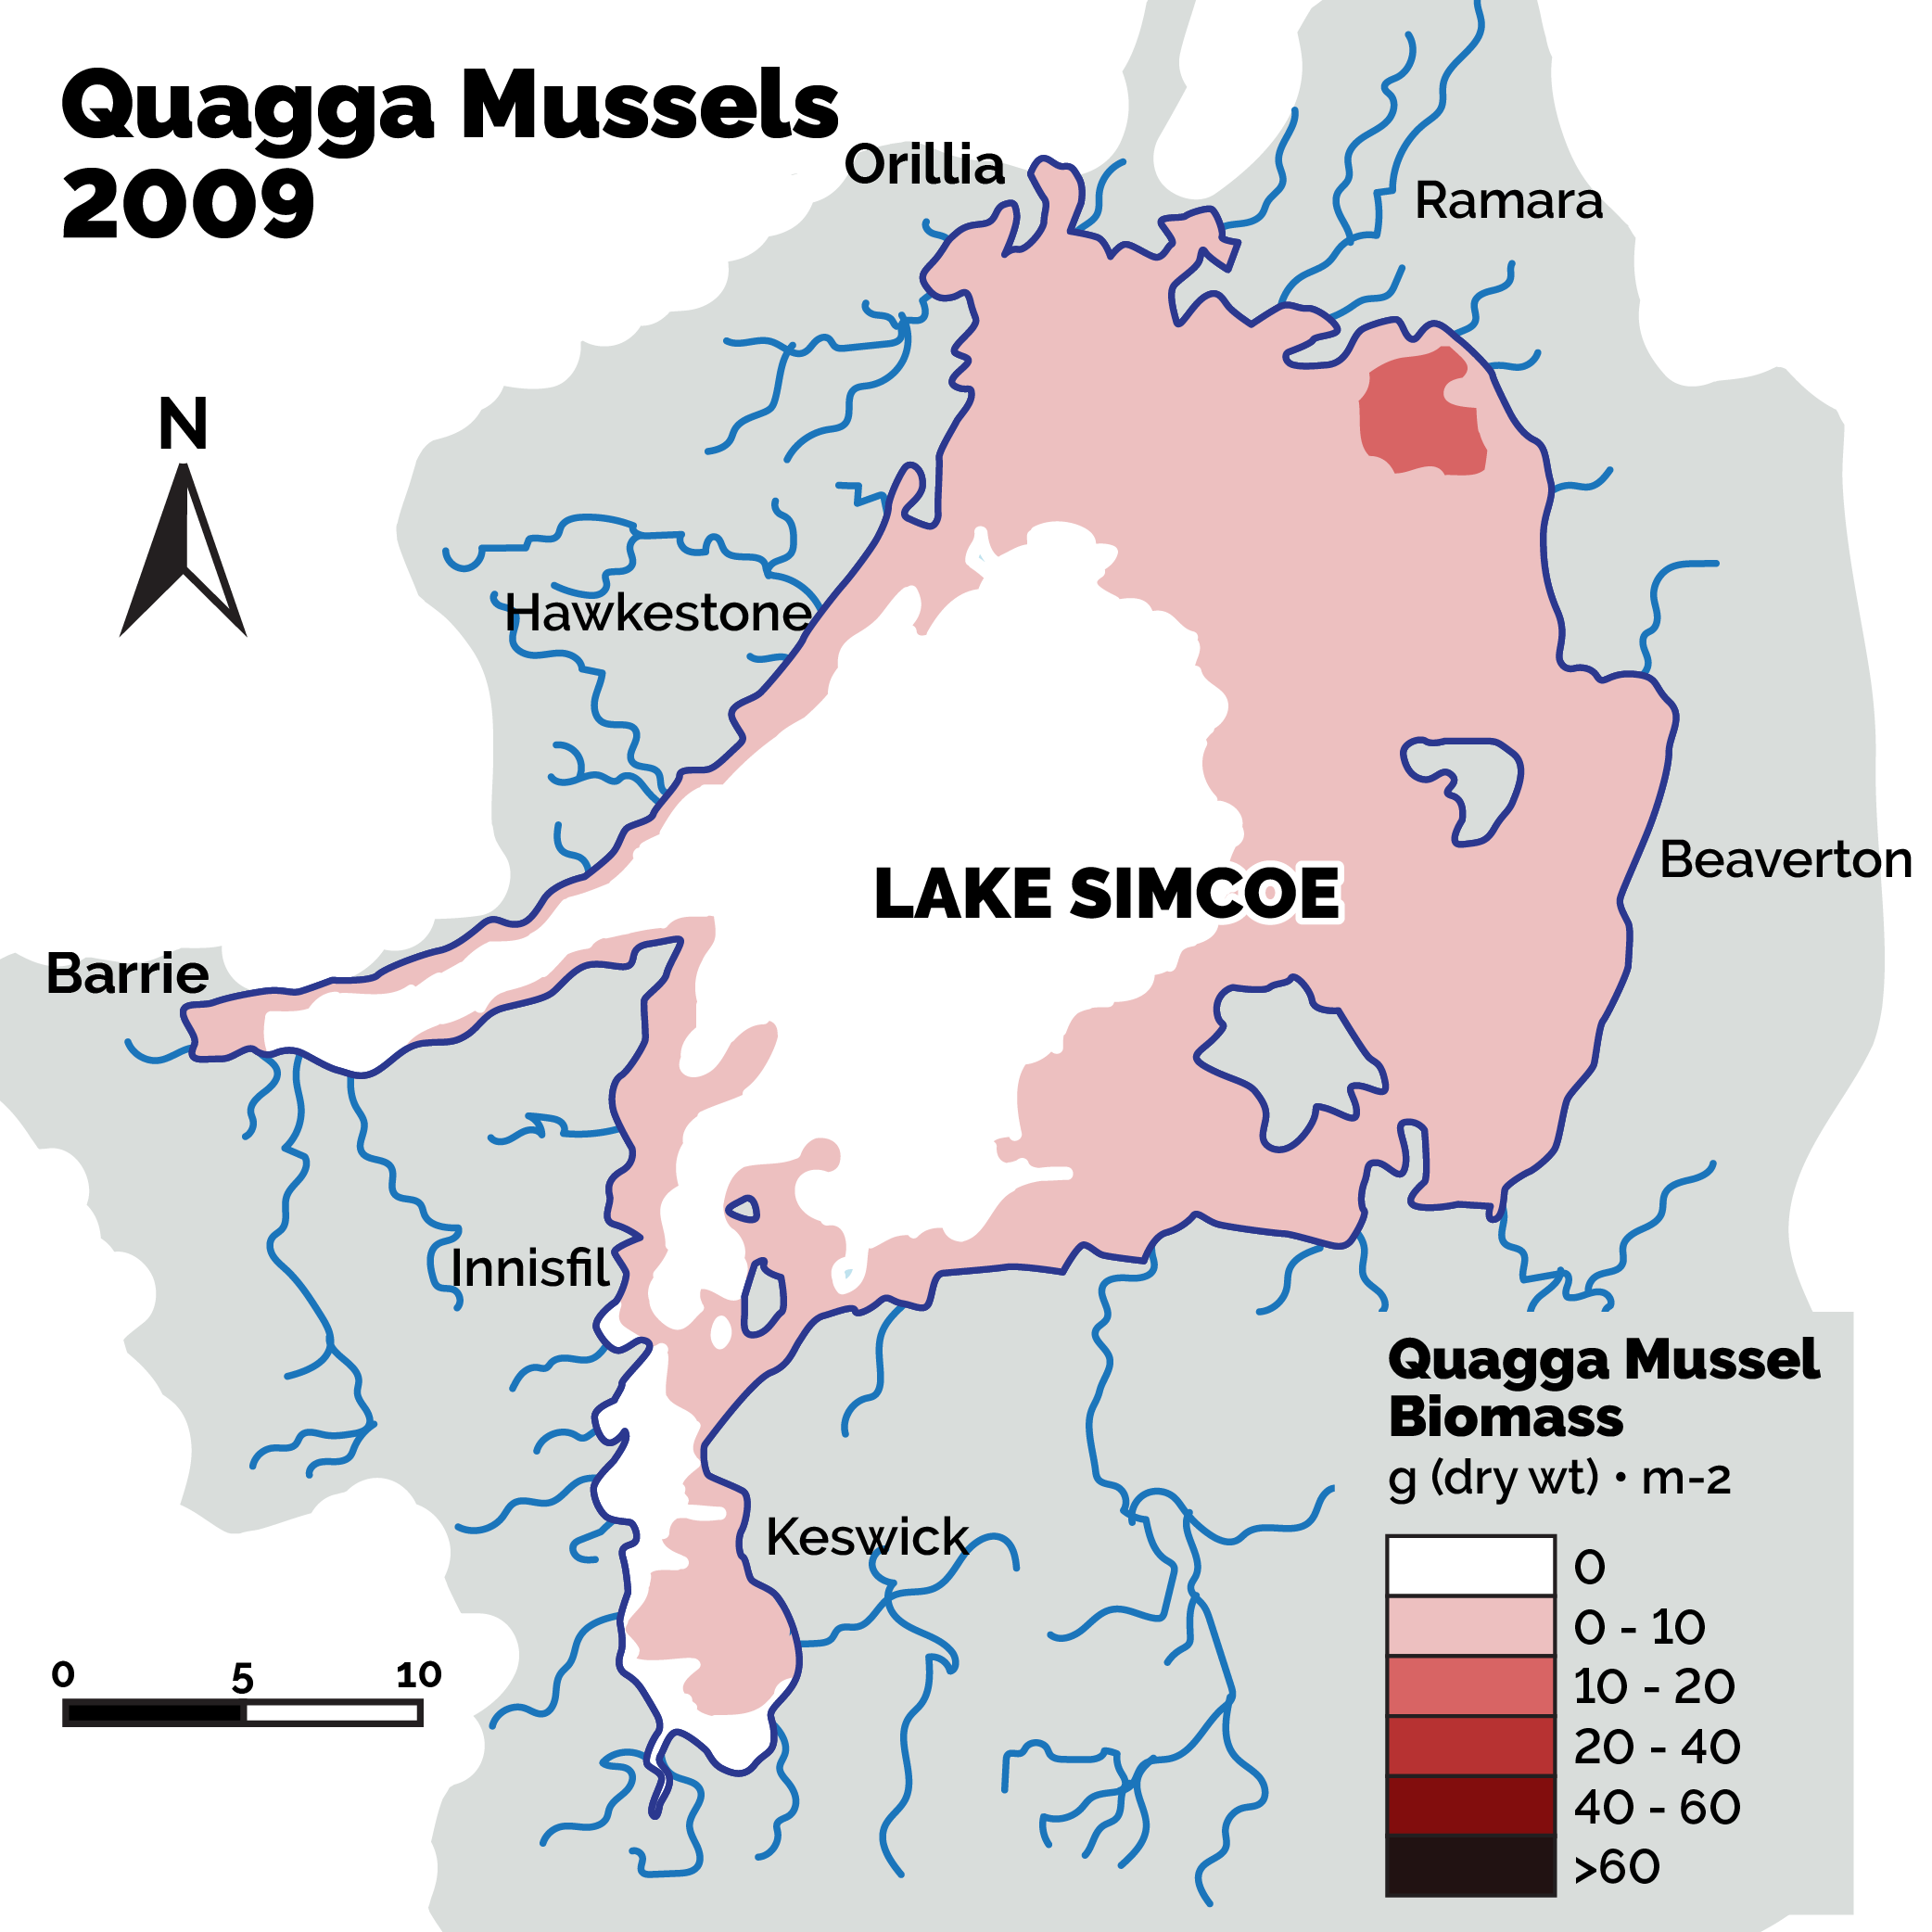

Figure 38: Shift from zebra to quagga mussels from 2009 to 2015.
A shift from zebra to quagga mussels has impacted the lake in many ways, including:
- changes to the food web and therefore the flow of energy in deep water habitats
- fouling (e.g. covering) by quagga mussels of infrastructure (e.g. intake pipes) that were previously built below 20-m depth to avoid zebra mussel colonization
- decreases in density of other invertebrates that live at the bottom of the lake. This trend is being investigated in more detail but is likely related to competition for food with quagga mussels who are more efficient at removing food from the water
Call to action
On the water, in the garden, at the cottage or on a trail, you can help stop invasive species and protect our environment. Ways you can help:
- Learn about Ontario's rules to prevent and control the spread of high risk invasive species.
- Manage invasive plants on your property. Here are some helpful tips on the best ways to remove them so they don't spread.
- Garden responsibly. Choose native or non-invasive plants for your garden and avoid relocating plants from your home to cottage or vice versa. Build water gardens away from natural waterways to prevent unwanted escapes.
- Don't let it loose! Never release aquarium plants or pets. Some pets like goldfish are an invasive species.
- Clean, drain, dry your boat and gear before going to another waterbody. Aquatic invasive plants, mussels, and other critters can hitch a ride on your boat to a new lake.
- Go fishing responsibly. Know the rules. Use local bait; collect or purchase it as close as possible to where you are planning to fish. Never dump your bait into the water or on the ice.
- Camp or cottage responsibly. Use local firewood. Firewood may carry an invasive pest or disease that could harm our forests. Avoid transporting it long distances.
- Report invaders. Contact the toll-free Invading Species Hotline at
1-800-563-7711 , or visit EDDSMapS Ontario to report a sighting.
Moving forward
The Ontario government recognizes the importance of Lake Simcoe and is committed to protecting the lake's ecosystem. As we enter the next decade of our work to protect Lake Simcoe, we will continue to be faced with several challenges. The stressors facing the Lake Simcoe watershed are complex and compounding, and climate change will continue to affect the local ecosystem. The continued pressure from urbanization and growth, and the need to control the pathways for new invasive species, will require innovative solutions.
This report demonstrates that our efforts to protect the lake are working, and we are making progress towards the objectives of the Lake Simcoe Protection Act and plan. By providing ongoing scientific research and monitoring, we can track progress and make informed decisions guided by scientific evidence. Our work to reduce pollutants and nutrients of concern entering the lake, and to promote sustainable land and water uses are driving positive change across the watershed. We are actively working to prevent new invasive species from entering the watershed and responding to the adverse effects from those that are already established. By helping communities improve their ability to respond to climate change, we are also protecting the elements that contribute to ecosystem health.
While the phosphorus load entering the lake is still higher than the long-term goal, dissolved oxygen levels are increasing, and the overall ecological health of the lake has improved. We continue to see signs of naturally reproducing cold-water species such as lake trout, lake whitefish, and cisco, which is a positive step toward restoring and sustaining a cold-water fish community. Achieving the objectives of the Lake Simcoe Protection Plan in the long term will require continued commitment from all sectors to the ongoing implementation of the plan's priority actions.
The Lake Simcoe legislation enshrined a framework to protect the health of Lake Simcoe over the long term and included the “building blocks” of our approach: monitoring, research, information sharing, management action, and supportive actions on the ground. There is a long history of partnership in the watershed, and we have high-quality data and expertise to guide our actions. The lessons learned from the past 10 years and the new information we have gathered through research and monitoring, will inform the first review of the plan. We have evidence that can support new provincial policies to compel actions, and we have new management tools are ready to be applied. We look forward to consulting with stakeholders and engaging the public on the review of the plan and on any decision to make changes. We want to make sure we have strong protections for Lake Simcoe and ensure the watershed can continue to sustain one of Ontario's fastest growing regions for generations to come.
Appendix - committee advice
Two publicly appointed committees were established in 2010 under the Lake Simcoe Protection Act – the Lake Simcoe Coordinating Committee and the Lake Simcoe Science Committee. These committees provide advice to the Minister of the Environment, Conservation and Parks on the implementation of the Lake Simcoe Protection Plan and the ecological health of the Lake Simcoe watershed.
Advice provided by the committees since the 2015 Five-Year Report, has focused on eight key areas:
- Phosphorus reduction
- Continue to focus on reducing phosphorus loads through applied and innovative practices
- Reconsider the Phosphorus Reduction Strategy's proportional reduction framework to ensure further efforts to reduce phosphorus are cost-effective
- Investigate options to support actions to further reduce atmospheric phosphorus deposition and phosphorus reduction/recovery from polders such as the Holland Marsh
- Investigate and encourage innovative funding mechanisms (e.g. the Lake Simcoe Region Conservation Authority's phosphorus offsetting program) that could generate revenue to address existing loading from uncontrolled urban areas
- Update stormwater guidelines to reflect best practices for low impact development
- Climate change planning
- Support local climate change adaptation and mitigation planning that manages risks and balances costs with benefits when setting priorities for action
- Shoreline and natural cover
- Develop and implement a plan to achieve natural cover and natural shoreline targets and monitor progress over time towards targets
- Implement a shoreline management strategy to identify best practices for shoreline protection, clarify policy on existing shoreline protections, and monitor changes in the shoreline over time
- Ensure natural heritage monitoring programs, such as the Vegetation Sampling Protocol, informs the development of policies, instruments, and programs that advance plan targets
- Indigenous engagement and meaningful consultation
- Provide information, sufficient time and financial support to build the capacity of First Nations communities to meaningfully engage in Plan implementation and review;
- Work with Indigenous communities to identify and prioritize plan policies that require more thorough First Nations involvement, input, and/or Traditional Ecological Knowledge.
- Chloride reduction
- Research and monitor the impacts of chloride contamination, identify potential barriers limiting adoption of best practices, and consider policy and practical solutions to reduce chloride contamination from the application of winter road salt.
- Other contaminants of emerging concern
- Continue to investigate and monitor other contaminants in the watershed (e.g. microplastics, pathogens, pharmaceuticals) to better understand the consequences for the lake
- Impacts of growth
- Ensure that the assimilative capacity and ecosystem health of the watershed are considered prior to any amendments to future growth projections
- Support innovative programs that can potentially mitigate the impacts of new growth (e.g. Lake Simcoe Phosphorus Offset Program, Low Impact Development treatment train tool, stormwater management guidelines) and monitor their effectiveness
- Innovation and knowledge management
- Continue research and monitoring activities to fill knowledge gaps and ensure that future management decisions and actions are both effective and efficient, and based on the best available science
- Support innovative, on-the-ground projects that are informed by research and monitoring evidence
- Continue to scale-up successful pilot projects in the watershed and across the Province and learn from other jurisdictions
- Continue to transfer scientific information to policy makers, stakeholders and the public in plain language to enhance understanding and support for progressive environmental management
This expert advice helps ensure that sound, meaningful science is being undertaken, threats to the lake are identified in a timely manner, and strategies to deal with the threats are effectively implemented. The Province values and appreciates the contribution of the committees and would like to thank all committee members for their commitment to Lake Simcoe.
Footnotes
- footnote[1] Back to paragraph Keswick has an approved Class Environmental Assessment for the expansion of the sewage treatment plant to 876 kg/yr.