This page was published under a previous government and is available for archival and research purposes.
Demand forecasts
Demand forecasts for electricity
Ontario’s investments over the past decade established a firm foundation for Ontario’s energy future. The province is in a strong position to meet the range of demands for electricity that could occur. Ontario has to prepare for a range of demands, and not one single future, because we cannot precisely predict how we will use electricity 10 or 20 years from now.
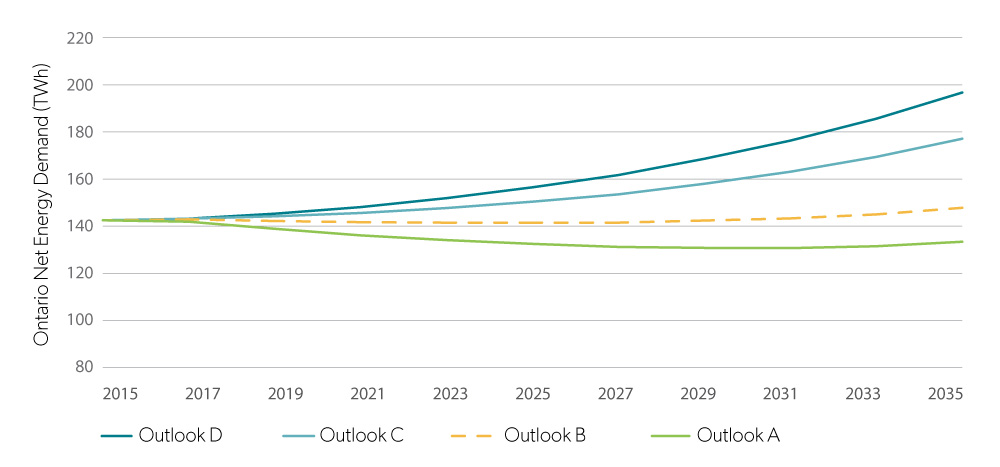
Figure 4: Electricity demand forecasts (Source: Ontario Planning Outlook)
| Year | A | B | C | D |
|---|---|---|---|---|
| 2015 | 142.5 | 142.5 | 142.5 | 142.5 |
| 2016 | 143 | 143.4 | 143.5 | 143.5 |
| 2017 | 141.9 | 142.9 | 143.2 | 143.2 |
| 2018 | 140.6 | 142.7 | 143.7 | 144.3 |
| 2019 | 138.9 | 142.2 | 144.2 | 145.3 |
| 2020 | 137.7 | 142.2 | 145.1 | 146.9 |
| 2021 | 136.1 | 141.7 | 145.6 | 148.1 |
| 2022 | 135 | 141.6 | 146.6 | 149.9 |
| 2023 | 134.1 | 141.5 | 147.7 | 151.9 |
| 2024 | 133.5 | 141.7 | 149.3 | 154.4 |
| 2025 | 132.5 | 141.5 | 150.4 | 156.5 |
| 2026 | 131.7 | 141.2 | 151.7 | 158.8 |
| 2027 | 131.2 | 141.5 | 153.5 | 161.7 |
| 2028 | 131 | 142.1 | 155.9 | 165.3 |
| 2029 | 130.8 | 142.4 | 158 | 168.6 |
| 2030 | 130.7 | 142.8 | 160.5 | 172.4 |
| 2031 | 130.7 | 143.3 | 163.1 | 176.3 |
| 2032 | 131 | 144 | 166.2 | 181 |
| 2033 | 131.5 | 145 | 169.4 | 185.6 |
| 2034 | 132.3 | 146.3 | 173.1 | 191 |
| 2035 | 133.4 | 147.8 | 177.1 | 196.7 |
In the OPO, the IESO examined four possible futures, or outlooks:
- Outlook A examines a future of low demand, with the province using less electricity than it does now. In Outlook A, Ontario would use 133 TWh of electricity annually by 2035.
- Outlook B is a continuation of the current pattern of flat growth in energy demand and would see annual electricity use of 148 TWh over the same period. This is close to the current level of 143 TWh used in 2015. With currently planned and existing resources, including conservation efforts, Ontario will have sufficient capacity to meet the needs of a flat demand future.
- Outlooks C and D examine a future with a significantly higher use of electricity due to the increased electrification of transportation and changes in the heating and cooling of homes and businesses. In these outlooks, the annual consumption of electricity could increase to between 177 TWh and 197 TWh by 2035. Ontario would need to generate more electricity than it does today to meet these higher levels of demand. The increase in demand is not expected to occur until the mid-2020s, with significant increases in supply required after 2030.
Demand forecasts for fuels
The discussion of future demands for fuels is outlined in the FTR. The report’s five scenarios are based on the same primary assumptions contained in the IESO's OPO. As such, the projections for fuel demand in the FTR are the reverse of the projections for electricity demand. For example, an OPO forecast of an increase in the number of electric vehicles would trigger a corresponding decrease in the fuels consumed within the transportation sector.
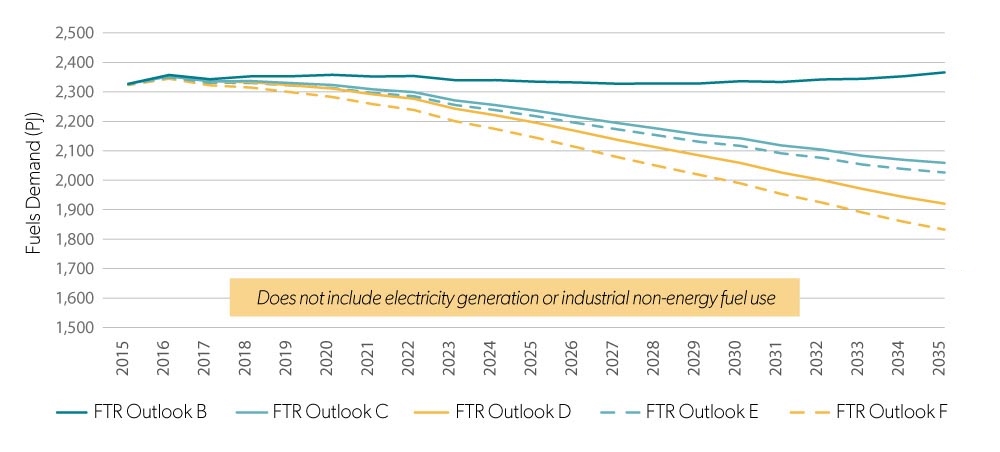
Figure 5: Fuels demand forecast (Source: Fuels Technical Report)
| Year | B | C | D | E | F |
|---|---|---|---|---|---|
| 2005 | 2377.350124 | n/a | n/a | n/a | n/a |
| 2006 | 2292.334945 | n/a | n/a | n/a | n/a |
| 2007 | 2343.292224 | n/a | n/a | n/a | n/a |
| 2008 | 2305.360249 | n/a | n/a | n/a | n/a |
| 2009 | 2170.644844 | n/a | n/a | n/a | n/a |
| 2010 | 2200.491669 | n/a | n/a | n/a | n/a |
| 2011 | 2247.561934 | n/a | n/a | n/a | n/a |
| 2012 | 2171.08314 | n/a | n/a | n/a | n/a |
| 2013 | 2289.00307 | n/a | n/a | n/a | n/a |
| 2014 | 2326.983502 | n/a | n/a | n/a | n/a |
| 2015 | 2337.993341 | 2337.616527 | 2337.616527 | 2336.058317 | 2333.645578 |
| 2016 | 2368.029733 | 2363.2648 | 2363.2648 | 2360.119369 | 2355.267143 |
| 2017 | 2353.622647 | 2346.285717 | 2346.285717 | 2341.603002 | 2332.981832 |
| 2018 | 2363.424512 | 2347.448874 | 2343.793847 | 2340.882287 | 2325.290441 |
| 2019 | 2363.686152 | 2340.550706 | 2332.965373 | 2332.103502 | 2309.371022 |
| 2020 | 2368.537841 | 2334.095203 | 2321.853316 | 2323.802934 | 2293.27452 |
| 2021 | 2362.736622 | 2319.113849 | 2302.117465 | 2307.046068 | 2268.82106 |
| 2022 | 2364.480446 | 2309.740553 | 2287.114306 | 2295.945475 | 2249.200063 |
| 2023 | 2350.450735 | 2281.659246 | 2253.574168 | 2266.242065 | 2211.3009 |
| 2024 | 2350.54698 | 2265.733034 | 2231.134669 | 2248.702189 | 2184.5178 |
| 2025 | 2345.210108 | 2246.32001 | 2205.588292 | 2227.739314 | 2154.80618 |
| 2026 | 2342.603524 | 2224.797633 | 2176.963872 | 2204.772311 | 2122.272614 |
| 2027 | 2338.230107 | 2204.670765 | 2147.352781 | 2183.176935 | 2088.71885 |
| 2028 | 2339.322995 | 2185.385466 | 2120.776751 | 2162.481785 | 2058.333656 |
| 2029 | 2339.258919 | 2165.295525 | 2094.758944 | 2141.007054 | 2028.947319 |
| 2030 | 2346.826192 | 2152.919554 | 2069.397181 | 2127.306555 | 2000.099398 |
| 2031 | 2344.192931 | 2128.89578 | 2036.998865 | 2102.061777 | 1964.271575 |
| 2032 | 2352.865371 | 2114.670556 | 2011.053137 | 2086.478798 | 1934.723908 |
| 2033 | 2354.987365 | 2093.470026 | 1980.982482 | 2063.845842 | 1900.95668 |
| 2034 | 2363.652854 | 2080.042491 | 1953.786263 | 2048.918952 | 1869.928063 |
| 2035 | 2376.768286 | 2069.66212 | 1931.132364 | 2036.947049 | 1843.187684 |
The five Outlooks in the FTR examine a series of demands for fuels, ranging from a continuation of the status quo to a future with reduced demand for fuels due to an increased use of electricity:
- The FTR's Outlook B incorporates the assumption of a flat demand for electricity in the OPO's Outlook B, and assumes that demand side management (DSM) for natural gas would continue at present levels. The proposed transportation fuel standards would also proceed as planned. Outlook B estimates a demand for fuels of 2,377 Petajoules (PJ) by 2035.
- The FTR's Outlooks C and D respond to the assumptions of a significantly higher use of electricity contained in outlooks C and D of the OPO, respectively. There is an assumption that DSM initiatives and proposed transportation fuel standards would continue as currently planned. Fuel demand in Outlooks C and D is estimated to be 2,070 PJ and 1,931 PJ, respectively, in 2035.
- The FTR's Outlooks E and F are based on the same primary assumptions as FTR Outlooks C and D, respectively. They then include greater levels of DSM and the displacement of some conventional fuels with less carbon-intensive alternatives. The demand for fuels in Outlooks E and F is estimated to be 2,037 PJ and 1,842 PJ, respectively, in 2035.
Note – Outlook A in the OPO explores the implications of a lower demand for electricity, but is not modeled in a separate Outlook in the FTR. A lower demand for fuels is explored in Outlooks C, D, E and F of the FTR.