Canadian Ambient Air Quality Standards
In May of 2013 the federal government published the Canadian Ambient Air Quality Standards (CAAQS) as non-binding objectives under the Canadian Environmental Protection Act. The CAAQS were developed under the direction of the Canadian Council of Ministers of the Environment (CCME) as outdoor air quality targets that “set the bar” for air quality actions across the country.
The CAAQS replaced the existing Canada-wide Standards (CWS) for PM2.5 and ozone in 2013 by setting stricter targets and introducing an annual standard for PM2.5. An annual standard helps protect human health from long-term or chronic exposure to fine particles. The purpose of the CAAQS is to drive continuous improvement in air quality. In 2015, provinces and territories were formally required to report ambient air quality measurements against the CAAQS. Concentrations measured at a monitoring station calculated in the statistical form of a standard are referred to as CAAQS metric values. Table 1 shows the CAAQS for PM2.5 and ozone and how their respective metrics are calculated.
| PM2.5 24h |
PM2.5 Annual |
Ozone 8h |
| 28 μg/m3 |
10 μg/m3 |
63 ppb |
New CAAQS for future reporting
In addition to the CAAQS for PM2.5 and ozone, new 2020 and 2025 CAAQS values have been established for NO2 and SO2. Reporting on the values from CAAQS designated ambient air monitoring sites in Ontario for these new CAAQS will begin in 2021 and will be based on data collected during the 2018, 2019 and 2020 calendar years. Like the CAAQS for PM2.5 and ozone, the SO2 and NO2 CAAQS have been established to protect human health and the environment and drive continuous improvements in air quality.
Meeting PM2.5 CAAQS in Ontario
The PM2.5 CAAQS metric values for the Ministry’s CAAQS designated ambient air monitoring sites for 2017 are based on a three-year average, 2015-2017 (see Table 1). The 24h and annual PM2.5 CAAQS were not exceeded in 2017. The 2017 24-hour PM2.5 CAAQS metric values ranged from 13 μg/m3, reported for both Sault Ste. Marie and Thunder Bay, to 22 μg/m3, reported for Hamilton Downtown. The 2017 annual PM2.5 CAAQS metric concentrations ranged from 5.3 μg/m3, reported for Sault Ste. Marie, to 9.0 μg/m3, reported for Hamilton Downtown. The CAAQS metric values for the 24h and annual PM2.5 are displayed in Figures 16 and 17, respectively, and in Table A19 of the Appendix.
Figure 16: 24h PM2.5 CAAQS metric values for designated sites across Ontario, 2017
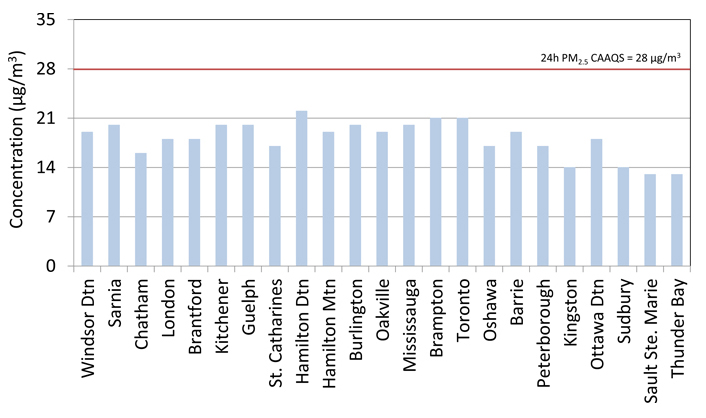
All 23 designated sites met the 24-hour Canadian Ambient Air Quality Standard for fine particulate matter.
Note:
The CAAQS for 24h PM2.5 (28 μg/m3) is based on the 98th percentile measurement annually, averaged over three consecutive years.
Sarnia's metric is based on a two-year average.
Figure 17: Annual PM2.5 CAAQS metric values for designated sites across Ontario, 2017
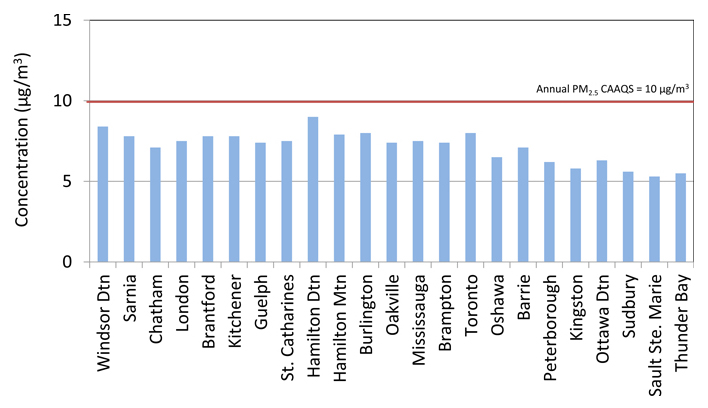
All 23 designated sites met the annual Canadian Ambient Air Quality Standard for fine particulate matter.
Note:
CAAQS for annual PM2.5 (10 μg/m3) is based on the annual mean averaged over three consecutive years.
Sarnia's metric is based on a two-year average.
Meeting ozone CAAQS in Ontario
The ozone CAAQS metric values for the Ministry’s CAAQS designated Ontario ambient air monitoring stations for 2017 are based on a three-year average, 2015-2017. The 2017 ozone CAAQS metric values ranged from 51 ppb, reported for Thunder Bay, to 70 ppb, reported for Windsor Downtown and Peterborough. Five of the 23 designated sites met the CAAQS of 63 ppb for ozone in 2017. Figure 18 shows the 2017 ozone CAAQS metric values for designated CAAQS sites across Ontario; they are also displayed in Table A19 of the Appendix. Transboundary influences, from both the U.S. and beyond, account for a significant portion of Ontario’s ozone when their levels are elevated. A Weight of Evidence (WOE) analysis demonstrates the influence of transboundary flow on days with elevated ozone concentrations and confirms that Ontario’s CAAQS reporting stations would have met the ozone CAAQS if transboundary flow days were excluded from the calculated metric. (The WOE approach consists of performing, evaluating and documenting a series of technical analyses that collectively support the conclusion that exceedances of the standard on a given day were influenced by transboundary flows or exceptional events). Emission reductions in Ontario and the U.S. have contributed to decreases in ozone concentrations. However, while ambient concentrations have improved, the province continues to experience high levels of ozone due to transboundary air pollution, increasing global background levels, and reduced scavenging effect which has contributed to exceedances of the ozone CAAQS.
Figure 18: Ozone CAAQS metric values for designated sites across Ontario, 2017
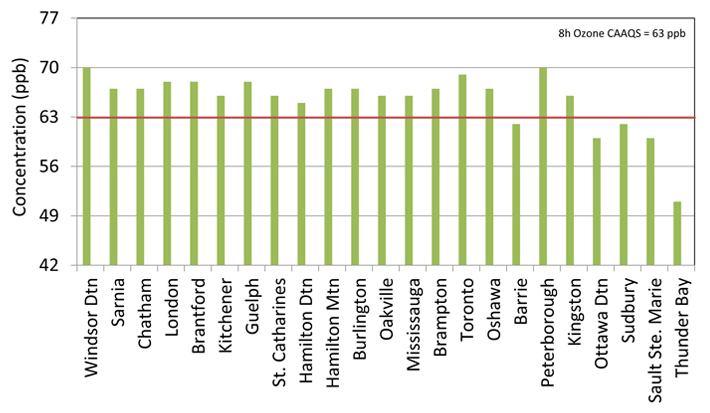
Five sites – Barrie, Ottawa Downtown, Sudbury, Sault Ste. Marie and Thunder Bay – met the ozone Canadian Ambient Air Quality Standard.
Note:
The CAAQS for ozone (63 ppb) is based on the consecutive three year average of the annual 4th highest daily maximum eight-hour running average.
Managing air quality in Ontario
Ontario aims to improve air quality in communities by creating unique solutions to address local challenges. To help accomplish this, areas in Ontario have been identified as one of three category types that have been defined by looking at factors including air emissions sources, geography/topography, population density, rural/urban considerations, existing local actions impacting air quality and pollution levels:
- Category 1 - Areas with limited pollution from either point or non-point sources or transboundary influence; where the air quality management activities are focused on maintaining good air quality.
- Category 2 - Areas under pressure from multiple sources including some or all of the following: non-point sources, smaller point sources, individual large industrial point sources, transboundary influences; where air quality management activities are focused on multiple broad-based initiatives targeting many sources.
- Category 3 - Areas with a concentration of large industrial sources; where air quality management activities are focused on the abatement of local industrial emissions as well as non-industrial sources.
The result is six areas of the province that fall into the three categories:
- Northern Ontario, excluding Sault Ste. Marie and Sudbury (Category 1)
- Southern Ontario excluding Sarnia/St. Clair Township and Hamilton (Category 2)
- Sault Ste. Marie (Category 2)
- Sudbury (Category 2)
- Sarnia/St. Clair Township (Category 3)
- Hamilton (Category 3)
Transboundary influences on Ontario’s smog
Smog related air pollutants (i.e. PM2.5, ozone and their precursors) are generated both locally and regionally, and, with winds, can travel hundreds of kilometres, affecting areas far from the source of the pollution. Long-range transport and transboundary flow of air pollutants play a significant role in Ontario’s air quality.
Elevated levels of PM2.5 and ground-level ozone are often associated with distinct weather patterns that affect air quality in the lower Great Lakes region. Such weather conditions are generally associated with slow-moving high pressure systems south of the lower Great Lakes. This results in long-range transport of smog pollutants into Ontario from neighbouring U.S. industrial and urbanized states during south to south westerly flow conditions (Yap et al, 2005).
As shown in Figure 19, during the smog season (May to September) prevailing southwesterly airflows results in the transport of smog related pollutants from U.S. (e.g., NOX emissions from electricity generators in the Ohio Valley) into Ontario.
Figure 19: 2017 NOx emissions from electricity generators located in eastern U.S. and Canada with prevailing winds during smog season
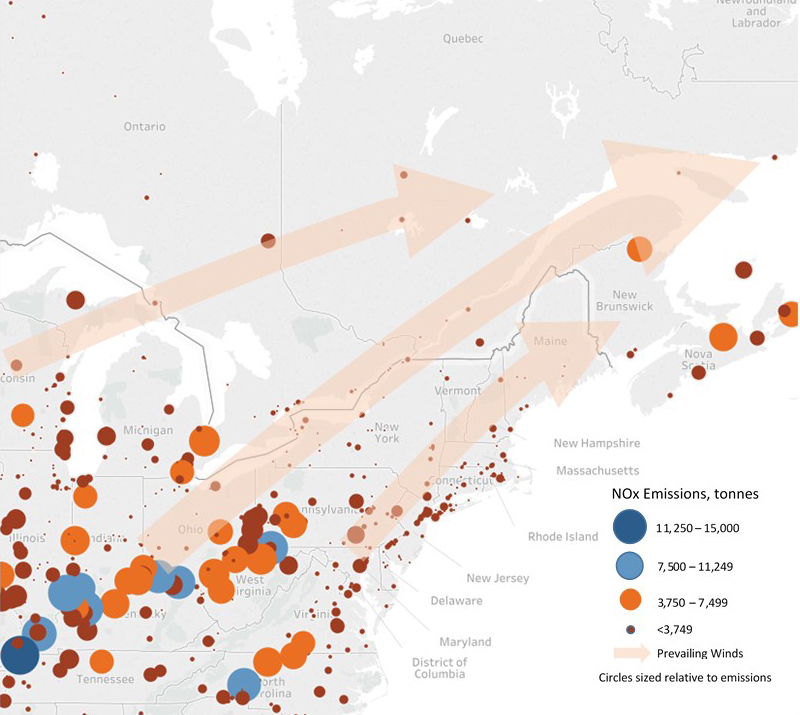
Canadian Data: National Pollutant Release Inventory, Environment and Climate Change Canada (ECCC)
U.S. Data: Air Markets Program Data, United States Environmental Protection Agency (USEPA)
The Community Multi-scale Air Quality model (CMAQ) (USEPA, 2018), developed by the U.S. Environmental Protection Agency, was used to characterize and predict the formation, transportation and transformation of smog related pollutants (e.g. ozone and PM2.5) in the atmosphere. With advances in computer technology, the accuracy of these model results is much better than earlier modelling studies for Ontario. The CMAQ model results presented in Figures 20 and 21 quantify the impact of transboundary flows of smog related pollutants into and across Ontario. Emissions of smog precursors from a region that included eastern North America was used along with meteorological conditions to assess ambient concentrations of pollutants for 2010. For the purposes of this section of the report, global background refers to transboundary influences excluding those from the United States.
Figure 20: Transboundary influences on Ontario’s annual average PM2.5 concentrations
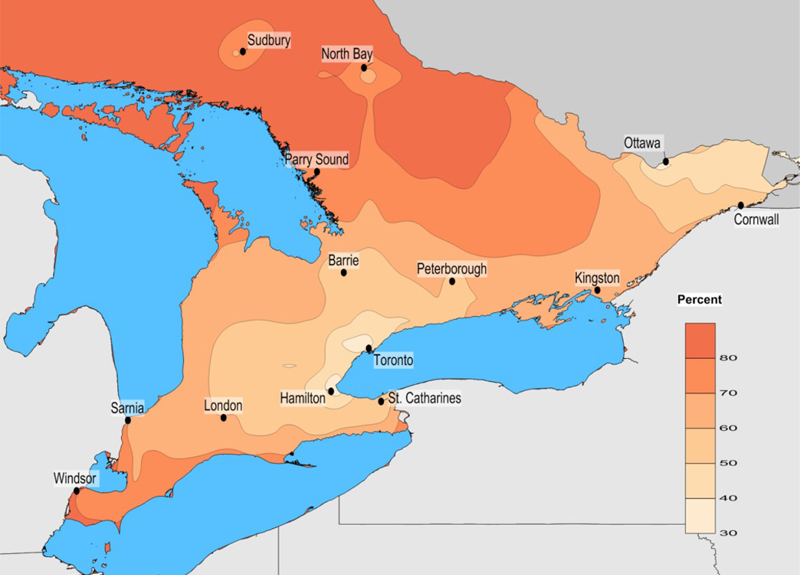
PM2.5
Transboundary contributions to Ontario’s PM2.5 concentrations are dominated by U.S. sources since global background levels of PM2.5 are relatively small.
The influence of transboundary sources on levels of PM2.5 in Ontario varies across the province, depending on whether there are significant primary local sources in the area that directly emit PM2.5 (e.g., from construction or wood burning) or if the area is mainly affected by secondary PM2.5 formation which is formed in the atmosphere through a series of complex reactions of the precursor emissions (i.e. SO2, NOX, VOCs, and ammonia) from upwind emission sources. Generally, Ontario’s secondary PM2.5 originates mainly from the U.S. and is transported into the province.
In Canada-U.S. border areas of southwestern Ontario, such as Windsor and Sarnia, transboundary sources of PM2.5 dominate, contributing to over 80% or more of the annual PM2.5 concentrations in some areas. These transboundary contributions, which are mainly due to secondary PM2.5, decrease further away from the U.S. border as shown in Figure 20.
The transboundary contributions to PM2.5 concentrations are different in the GTA where there are many more sources of directly emitted PM2.5 spread across the region and thus transboundary contributions of PM2.5 are much less (up to 40%). Outside of the GTA, transboundary influences increase in all directions. Similar patterns are found in areas around other large urban centers such as Ottawa where transboundary contributions are 30-40% on an annual basis.
Towards Kingston, transboundary contributions to PM2.5 concentrations are significant (between 60-70%) because there are few sources of directly emitted PM2.5 in this area. This area is also influenced by secondary PM2.5 resulting from Ontario precursor emission sources which are located upwind (i.e. GTA) as shown in Figure 20.
With very few local sources of PM2.5 in much of northern Ontario, the majority of the PM2.5 in this part of the province originates from mainly the U.S. (over 80%). In some areas, such as Sudbury and North Bay, where there are significant local sources of directly emitted PM2.5, transboundary influence is less, but still significant (60-70%).
In general, the U.S. contribution to PM2.5 concentrations in Ontario ranges from 30% to over 80% annually, depending on the location in the province.
Ozone
Ozone is regional in nature and not emitted directly into the atmosphere but is formed from precursor emissions including NOX and VOCs. Accordingly, transboundary sources including the U.S., as well as sources from around the globe (global background), are significant contributors to Ontario’s ozone levels. The combined influence of these transboundary sources, which varies across the province, is most significant in southwestern Ontario, and decreases moving from the southwest to northeast.
Generally, ozone concentrations in Ontario are higher between May and September, when the meteorological conditions are favourable for the formation and accumulation of ozone. During this period, a significant amount of Ontario’s ozone can originate from emission sources in the U.S.
Transboundary contributions are most notable in areas of southwestern Ontario, in close proximity to the U.S. border, and along the northern shore of Lake Erie and the eastern shore of Lake Huron/Georgian Bay. On higher concentration days, over 95% of the ozone concentrations are attributable to transboundary sources, with the U.S. contributing to as much as 40% of this as shown in Figure 21.
Global background contributions to ozone also play a significant role in Ontario’s transboundary air pollution. In general, global background contributions to ozone concentrations in Ontario on poor air quality days ranges from 60-80% depending on the location in the province. Sources which contribute to global background include long-range transport of man-made emissions from outside North America and natural emissions (e.g. the downward transport of ozone from the stratosphere or ozone produced from lighting strikes and vegetation (i.e. biogenic sources)).
Global background levels are much more significant in areas of northern and eastern Ontario where there are fewer local sources of ozone precursor emissions (e.g. NOX and VOCs) and the influence of the U.S. is relatively small. In these areas, global background accounts for, on average, over 60% of the ozone levels on higher concentration days.
Figure 21: Transboundary influences on Ontario’s ozone concentrations on high concentration days
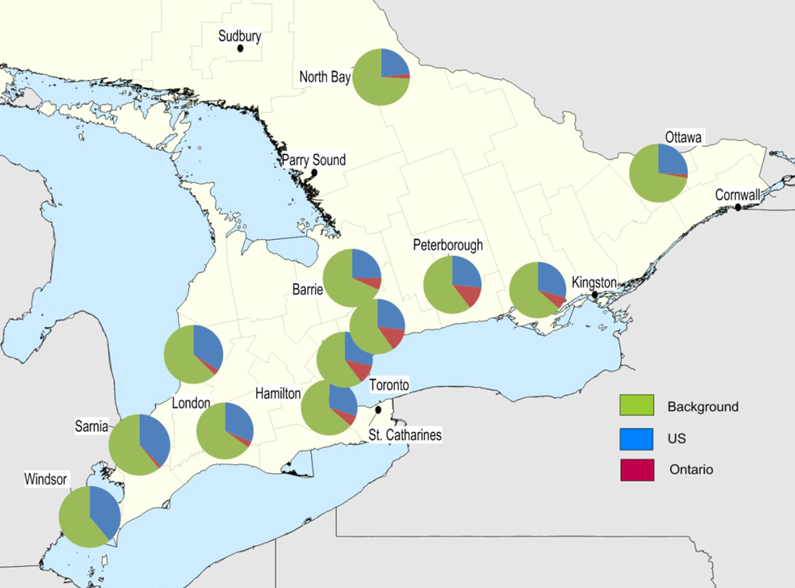
In large urban centres, generally ozone concentrations are lower, and in the downwind suburban and rural areas, higher. This occurs because ozone is depleted when it reacts with NO emissions from sources such as motor vehicles. This reaction, known as scavenging, results in reduced ozone concentrations and produces NO2 (see Figure 7). Further downwind, the NO2 reacts with volatile organic compounds in the presence of sunlight to produce ozone.
This is evidenced by the elevated ozone concentrations in the areas downwind of the province’s Greater Golden Horseshoe area, such as Belleville and Peterborough. Due to the substantial upwind scavenging impacts, the transboundary influences in these downwind areas are generally less as compared to the Greater Toronto Area (GTA).
As ozone precursor emissions continue to decrease across North America, the rising global background levels play an increasingly important role in Ontario’s air quality (Environment and Climate Change Canada, 2013).
Footnotes
- footnote[1] Back to paragraph Based on the 98th percentile 24-hour average annually, averaged over three consecutive years.
- footnote[2] Back to paragraph Based on the annual mean averaged over three consecutive years.
- footnote[3] Back to paragraph Based on the annual 4th highest daily maximum eight-hour running average, averaged over three consecutive years.