Sulphur dioxide
Sulphur dioxide is a colourless gas that smells like burnt matches. It can also be oxidized in the atmosphere to form sulphuric acid aerosols. In addition, sulphur dioxide is a precursor to sulphates, one of the main components of airborne secondary PM2.5. Major sources of SO2 include smelters, industrial processes and electric power generation.
Health effects caused by exposure to high levels of SO2 include breathing problems, respiratory illness, and the exacerbation of respiratory and cardiovascular disease. People with asthma, chronic lung disease or heart disease are the most sensitive to SO2. Sulphur dioxide damages trees and crops. Similar to NO2, SO2 is also a precursor to acid rain, which contributes to the acidification of soils, lakes and streams, accelerated corrosion of buildings, and reduced visibility.
Smelters in central Ontario are the major sources of SO2 emissions in Ontario, accounting for approximately 64% of the provincial SO2 emissions according to 2017 estimates for point, area and transportation sources (excluding emissions from open and natural sources), as shown in Figure 13. Industrial sources (e.g. petroleum refining, cement and concrete manufacturing) accounted for an additional 32%. The transportation sector and miscellaneous sources accounted for the remaining 4% of all SO2 emissions in the province (Air Pollutant Emission Inventory 1990-2017, 2019).
Figure 13: Ontario SO2 emissions by sector (2017 estimates for point/area/transportation sources)
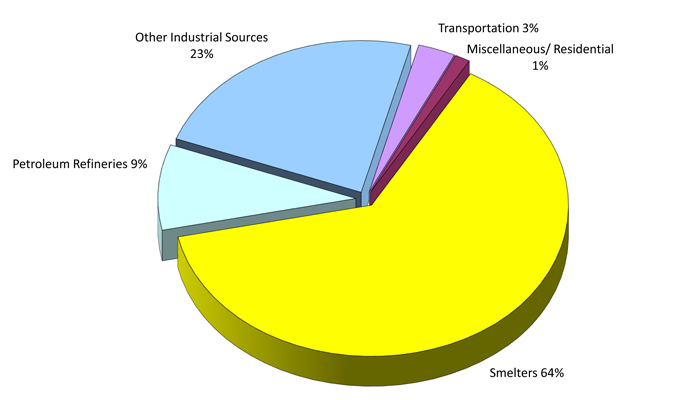
Smelters: 64%, other industrial sources: 23%, petroleum refineries: 9%, transportation: 3%, miscellaneous/residential: 1%.
Note: Excludes emissions from open and natural sources.
There were no exceedances of the provincial one-hour, 24-hour and annual AAQC for SO2 of 250 ppb, 100 ppb and 20 ppb that were in effect in 2017, respectively, at any of the Ministry’s AQHI air monitoring stations in Ontario. Hamilton Downtown recorded the highest SO2 annual mean (3.5 ppb) during 2017. Sudbury recorded the highest one-hour maximum concentration (119 ppb) and Sarnia recorded the highest 24-hour maximum concentration (26 ppb) for 2017. A summary of the 2017 SO2 annual statistics for individual AQHI air monitoring stations in Ontario are presented in Table A7 of the Appendix.
The SO2 annual mean concentrations from 2008 to 2017 show a decreasing trend of 46% across Ontario in Figure 14. SO2 10-year trends for individual AQHI air monitoring stations in Ontario are presented in Table A17 of the Appendix. Overall, provincial SO2 emissions have decreased by approximately 52% from 2008 to 2017 as shown in Figure 15 (Air Pollutant Emission Inventory 1990-2017, 2019). The reduction of SO2 emissions over the years is the result of various initiatives, which include, but are not limited to:
- establishing emissions controls at Ontario smelters through site-specific standards under O. Reg. 419/05
- banning of coal use in electricity generation
- low sulphur content in transportation fuels
Figure 14: Trend of SO2 annual means across Ontario (2008-2017)
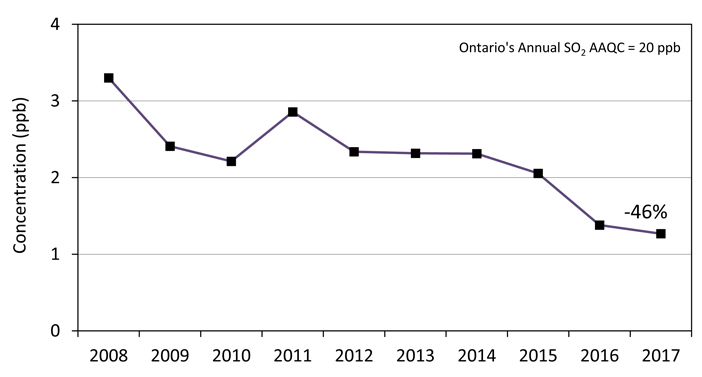
The sulphur dioxide annual mean concentrations from 2008 to 2017 show a decreasing trend of 46% across Ontario.
Note: 10-year trend based on data from 9 ambient air monitoring stations.
Figure 15: Ontario SO2 emission trend (2008-2017)
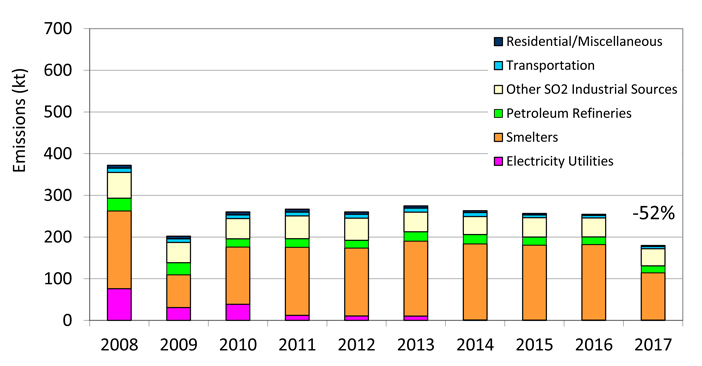
Provincial sulphur dioxide emissions have reduced by approximately 52% from 2008 to 2017.
Note: Excludes emissions from open and natural sources.