Chapter 2: Statistical overview
Collection of Data
Since its inception in 2003, a variety of data has been collected from homicide cases involving domestic violence that have been investigated by the Office of the Chief Coroner. As the committee has evolved, so too have the processes for reviewing, collecting and analyzing information that has been obtained. The DVDRC strives to provide information and analyses that are accurate, valid and useful to relevant stakeholders.
Types of Data
It is important to recognize that there are two separate and distinct sets of data relating to domestic violence homicides in Ontario:
Data relating to the actual number of homicide cases where domestic violence has been identified as an involvement factor.
In Ontario, a Coroner’s Investigation Statement (Form 3) is prepared for all cases investigated by a coroner. The Form 3 includes basic personal information (including, date of death, age, address, and so on) pertaining to the deceased, as well as a narrative that describes the circumstances surrounding the death. Investigating coroners are encouraged to identify death factors (for example, trauma – cuts-stabs, shooting – shotgun, asphyxia-hanging, and so on) and involvement factors (for example, abuse – domestic violence, alcohol involvement, Children’s Aid involvement, and so on). The Form 3 also identifies the ‘manner of death’ or ’by what means’ the death occurred. In Ontario, manner of death must be classified as one of the following: natural, accident, suicide, homicide or undetermined. Information from the Form 3, for all coroners’ investigations, is maintained within the electronic Coroner’s Information System (CIS) maintained by the Office of the Chief Coroner.
Statistics generated for the purposes of this annual report reflect a 18-year period of cases occurring from 2002–2019 where: ’homicide’ has been identified as the manner of death for at least one victim; ‘abuse – domestic violence’ has been identified and coded as an involvement; and the case meets the DVDRC’s definition of a domestic violence death. Some cases, where the manner of death is ‘undetermined’ and where there is involvement of domestic violence, are included in the data set.
It is important to note that some homicide cases identified with the ‘abuse – domestic violence’ involvement code occurring between 2002–2019 may still be pending review by the DVDRC. In many cases, DVDRC reviews have not commenced because legal or other proceedings are still underway or pending.
Data relating to the findings of cases that have been reviewed by the DVDRC.
The second set of data relates to cases that have undergone review by the DVDRC. This data would include information pertaining to risk factors, type and length of relationship and number/sex of victims and perpetrators. This data is collected in the thorough review conducted by the DVDRC.
The following statistics reflect the findings of analyses of the two different data sources.
Statistical Overview: Homicides with Domestic Violence Involvement (2002–2019)
The following statistics relate to homicides in Ontario occurring between 2002–2019 where ‘abuse – domestic violence’ has been identified as an involvement code, and that meet the DVDRC’s definition of a domestic violence death. Some of these cases may have already undergone review by the DVDRC while others are pending review upon completion of other proceedings (such as criminal trials).
Chart 1: Homicides in Ontario with Domestic Violence Involvement Code (2002–2019)
| Details | 2002 | 2003 | 2004 | 2005 | 2006 | 2007 | 2008 | 2009 | 2010 | 2011 | 2012 | 2013 | 2014 | 2015 | 2016 | 2017 | 2018 | 2019 | Totals 2002-2019 |
|---|---|---|---|---|---|---|---|---|---|---|---|---|---|---|---|---|---|---|---|
| Number of cases | 30 | 22 | 23 | 29 | 36 | 28 | 20 | 20 | 25 | 30 | 22 | 24 | 18 | 21 | 22 | 20 | 30 | 27 | 447 |
| Homicides | 19 | 18 | 14 | 21 | 29 | 18 | 15 | 15 | 19 | 22 | 13 | 19 | 11 | 14 | 16 | 17 | 20 | 20 | 320 (72%) |
| Homicide-Suicides | 11 | 4 | 9 | 8 | 7 | 10 | 5 | 5 | 6 | 8 | 9 | 5 | 7 | 7 | 6 | 3 | 10 | 7 | 127 (28%) |
| Total number of Deaths | 46 | 26 | 33 | 37 | 53 | 45 | 29 | 30 | 32 | 38 | 32 | 30 | 29 | 30 | 30 | 23 | 48 | 39 | 630 |
| Total number of Homicide Victims | 35 | 22 | 24 | 29 | 46 | 35 | 24 | 25 | 26 | 30 | 23 | 25 | 22 | 23 | 24 | 20 | 38 | 32 | 503 (80%) |
| Female (adult) | 26 | 19 | 21 | 29 | 28 | 29 | 20 | 20 | 21 | 27 | 19 | 22 | 13 | 21 | 17 | 17 | 30 | 24 | 403 (80%) |
| Female (child) | 4 | 1 | 1 | 0 | 8 | 0 | 0 | 3 | 1 | 0 | 0 | 0 | 2 | 0 | 2 | 0 | 2 | 3 | 27 (5%) |
| Male (adult) | 4 | 1 | 2 | 0 | 3 | 4 | 4 | 2 | 4 | 3 | 3 | 3 | 3 | 2 | 5 | 1 | 4 | 3 | 51 (10%) |
| Male (child) | 1 | 1 | 0 | 0 | 7 | 2 | 0 | 0 | 0 | 0 | 1 | 0 | 4 | 0 | 0 | 2 | 2 | 2 | 22 (4%) |
| Average age of Homicide Victim | 36 | 35 | 40 | 38 | 27 | 35 | 43 | 37 | 37 | 44 | 45 | 38 | 29 | 40 | 44 | 43 | 44 | 43 | 38.8 |
| Total number Perpetrator deaths (suicide or other) | 11 | 4 | 9 | 8 | 7 | 10 | 5 | 5 | 6 | 8 | 9 | 5 | 7 | 7 | 6 | 3 | 10 | 7 | 127 (20%) |
| Female (adult) | 0 | 0 | 1 | 0 | 0 | 1 | 0 | 0 | 0 | 0 | 0 | 0 | 0 | 0 | 1 | 0 | 0 | 0 | 3 (2%) |
| Male (adult) | 11 | 4 | 8 | 8 | 7 | 9 | 5 | 5 | 6 | 8 | 9 | 5 | 7 | 7 | 5 | 3 | 10 | 7 | 124 (98%) |
| Average age of Deceased Perpetrator | 49 | 46 | 42 | 45 | 51 | 45 | 44 | 60 | 45 | 51 | 60 | 41 | 47 | 58 | 43 | 68 | 50 | 53 | 49.8 |
Chart 1: Summary
- there were 447 domestic homicide and/or homicide-suicide cases that occurred in Ontario between 2002–2019 (based on cases investigated by the Office of the Chief Coroner for Ontario, where domestic violence was identified as an involvement code).
- of those 447 cases, 320 (72%) were homicides and 127 (28%) of the cases were homicide-suicides.
- the 447 cases resulted in a total of 630 deaths.
- of the 630 deaths, 503 (80%) were homicide victims and 127 (20%) were perpetrators who died by suicide or were otherwise killed (for example, shot by police).
- there was an average of 25 domestic homicide and/or homicide-suicide cases per year from 2002–2019. Some of these cases may have included multiple victims.
- there have been 503 domestic homicide victims from 2002–2019.
- there was an average of 28 domestic homicide victim deaths per year from 2002–2019.
- of the 503 homicide victims, 403 (80%) were adult females, 49 (9%) were children and 51 (10%) were adult males.
- of the 127 perpetrator deaths, 124 (98%) were adult males.
- the average age of homicide victims was 38.8 years.
- the average age of perpetrators who died was 49.8 years.
Graph 1: Number of DV Cases Based on Year (2002–2019) in Ontario – Based on Cases with DV Involvement Code in Coroner’s Information System
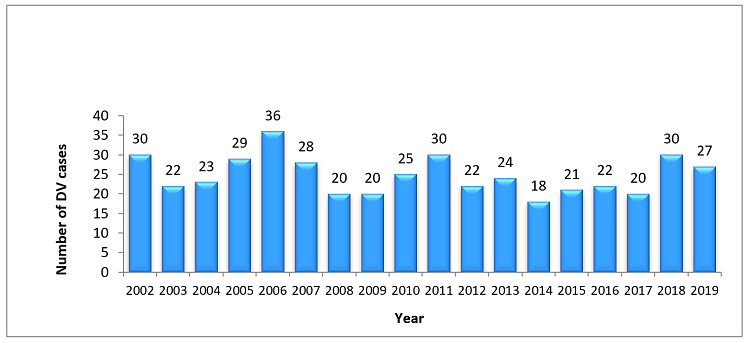
Graph 1 shows the number of domestic violence cases that occurred per year from 2002–2019. The number of case occurrences per year has varied from 18 cases in 2014 to 36 cases in 2006. Some cases may involve multiple victims. There was an average of 25 domestic homicide and/or homicide-suicide cases per year from 2002–2018.
Graph 2: Number of DV Homicide Victims (2002–2019)
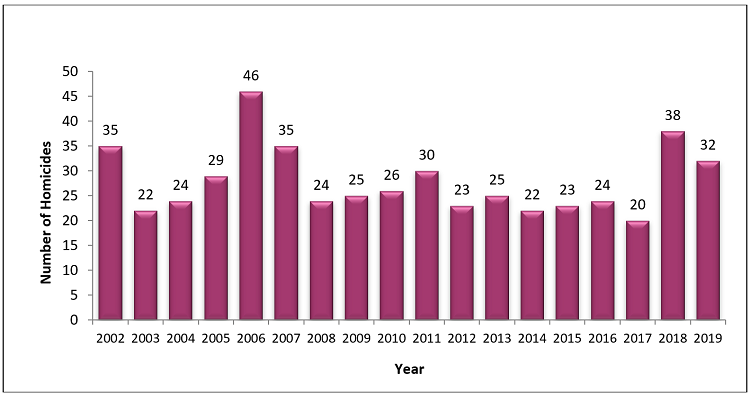
Graph 2 shows the number of domestic violence homicide victims per year from 2002-2019. The number of homicide victims per year has varied from 20 in 2017 to 46 in 2006. There was an average of 28 domestic homicide victim deaths per year from 2002–2019.
Death Factors
Death factors are utilized within the Coroner’s Information System (CIS) to assist with data retrieval/extraction and analysis. Death factors describe the underlying mechanism or force responsible for non-natural deaths (for example, trauma – motor vehicle collision) or the anatomical area or system involved for natural deaths (for example, cardiovascular system, central nervous system). Coroners are encouraged to identify the death factor most appropriate to the circumstances of the situation, and which lead to the fatal injuries sustained by the victim.
Chart 2 illustrates the death factors most commonly cited in domestic violence deaths (homicides and perpetrator deaths) identified in the CIS from 2002–2019.
Chart 2: Top Death Factors in Domestic Violence Deaths (2002–2019) based on CIS data
| Death Factor | 2002 | 2003 | 2004 | 2005 | 2006 | 2007 | 2008 | 2009 | 2010 | 2011 | 2012 | 2013 | 2014 | 2015 | 2016 | 2017 | 2018 | 2019 | Total DV Deaths (2002-2019) | % of Total DV Deaths (2002-2019) |
|---|---|---|---|---|---|---|---|---|---|---|---|---|---|---|---|---|---|---|---|---|
| Trauma - cuts, stabs | 15 | 8 | 11 | 9 | 21 | 14 | 8 | 11 | 16 | 15 | 6 | 12 | 13 | 9 | 8 | 7 | 9 | 19 | 211 | 33% |
| Trauma - beating, assault | 5 | 4 | 4 | 5 | 6 | 2 | 0 | 0 | 3 | 3 | 2 | 4 | 0 | 3 | 0 | 3 | 4 | 3 | 51 | 8% |
| Shooting - handgun | 8 | 5 | 2 | 4 | 1 | 9 | 1 | 3 | 3 | 1 | 6 | 4 | 2 | 2 | 7 | 6 | 7 | 0 | 71 | 11% |
| Shooting - rifle | 2 | 0 | 3 | 5 | 5 | 3 | 3 | 2 | 1 | 2 | 0 | 0 | 0 | 5 | 3 | 0 | 9 | 2 | 45 | 7% |
| Shooting - shotgun | 7 | 1 | 2 | 2 | 2 | 2 | 1 | 2 | 6 | 0 | 5 | 6 | 2 | 4 | 0 | 1 | 9 | 2 | 54 | 9% |
| Shooting - weapon (not spec.) | 0 | 0 | 1 | 0 | 0 | 0 | 1 | 0 | 0 | 0 | 0 | 0 | 0 | 0 | 0 | 0 | 0 | 2 | 0% | |
| Asphyxia - airway obstruction | 0 | 1 | 1 | 0 | 0 | 1 | 0 | 1 | 1 | 2 | 1 | 0 | 0 | 3 | 0 | 1 | 0 | 0 | 12 | 2% |
| Asphyxia - strangulation | 0 | 3 | 5 | 5 | 6 | 4 | 4 | 0 | 0 | 3 | 3 | 1 | 1 | 1 | 1 | 1 | 2 | 1 | 41 | 7% |
| Asphyxia - neck compression | 0 | 0 | 0 | 1 | 2 | 0 | 2 | 3 | 0 | 0 | 0 | 1 | 1 | 0 | 1 | 0 | 1 | 2 | 14 | 2% |
| Other | 9 | 4 | 4 | 6 | 10 | 10 | 9 | 8 | 2 | 12 | 9 | 2 | 10 | 3 | 10 | 4 | 7 | 10 | 129 | 20% |
| Total | 46 | 26 | 33 | 37 | 53 | 45 | 29 | 30 | 32 | 38 | 32 | 30 | 29 | 30 | 30 | 23 | 48 | 39 | 630 | Not applicable |
Note: Percentages are rounded off. Chart includes all deaths, including perpetrator suicides.
Summary of Chart 2: Top Death Factors in Domestic Violence Deaths (2002–2019)
- trauma (meaning cuts/stabs and beating/assault) was a death factor in 42% of the deaths.
- shooting (meaning handgun, rifle, shotgun or gun not specified) was a death factor in 27% of the deaths.
- asphyxia (meaning airway obstruction, strangulation and/or neck compression) was a death factor in 11% of the deaths.
- other death factors such as: trauma by motor vehicle, train/vehicle or blunt force, asphyxia from hanging, anoxic environment and carbon monoxide, drug toxicity, jump/fall, fire with smoke inhalation or thermal injury, and burns–thermal drowning, were present in 20% of the deaths.
Statistical Overview: Cases Reviewed by the DVDRC (2003–2020)
From 2003–2020, the DVDRC has reviewed 364 cases that involved a total of 515 deaths. Reviews are conducted by the DVDRC only after all other investigations and proceedings – including criminal trials and appeals – have been completed. As such, DVDRC reviews often take place several years after the actual incident.
The following statistics relate to all cases reviewed by the DVDRC from 2003–2020 inclusive.
Chart 3: Number of Cases Reviewed by the DVDRC (2003–2020)
| Year | Number of cases reviewed | Number of deaths involved | Number of recs | Case type: Homicides | Case type: Homicide -Suicides |
|---|---|---|---|---|---|
| 2003 | 11 | 24 | 18 | 3 | 8 |
| 2004 | 9 | 11 | 29 | 5 | 4 |
| 2005 | 14 | 19 | 10 | 5 | 9 |
| 2006 | 13 | 21 | 35 | 4 | 9 |
| 2007 | 15 | 25 | 33 | 7 | 8 |
| 2008 | 15 | 17 | 33 | 13 | 2 |
| 2009 | 16 | 25 | 11 | 6 | 10 |
| 2010 | 18 | 36 | 14 | 6 | 12 |
| 2011 | 33 | 41 | 31 | 27 | 6 |
| 2012 | 20 | 32 | 18 | 14 | 6 |
| 2013 | 19 | 22 | 9 | 17 | 2 |
| 2014 | 14 | 15 | 25 | 13 | 1 |
| 2015 - full review | 21 | 29 | 28 | 12 | 9 |
| 2015 - executive review | 49 | 57 | no data | 46 | 3 |
| 2016 | 22 | 36 | 23 | 11 | 11 |
| 2017 | 22 | 35 | 33 | 12 | 10 |
| 2018 | 18 | 25 | 28 | 15 | 3 |
| 2019 full review | 20 | 24 | 32 | 17 | 3 |
| 2019 executive review | 2 | 2 | no data | 2 | 0 |
| 2020 | 13 | 19 | 27 | 9 | 4 |
| Total | 364 | 515 | 437 | 244 | 120 |
Note: In 2015, a dedicated effort was made to address the accumulation of pending cases awaiting review by the DVDRC. All of the pending cases (49 in total), underwent “executive review” by a core team of representatives of the DVDRC. The executive review included a thorough analysis of the circumstances surrounding the deaths and compilation of risk factors identified in each case. None of the executive reviews resulted in recommendations.
Note: In 2019, executive reviews were conducted on cases where the relationship between the victim and perpetrator was not clearly established and where the intimate partner was the unintended victim.
Summary of Chart 3: Number of Cases Reviewed by the DVDRC (2003–2020)
- in the period between 2003 and 2020, the DVDRC reviewed 364 cases, involving 515 deaths (including perpetrator suicides).
- of the 364 cases, 244 (67%) were homicides and 120 (33%) were homicide-suicides.
Analysis of Risk Factors: Common Risk Factors
Based on extensive research, the DVDRC has created a list of risk factors that indicate the potential for lethality within the relationship examined. For a number of years, 40 risk factors were assessed. In 2017, the additional risk factor of victim vulnerability was added to make 41 risk factors. The recognition of multiple risk factors within a relationship potentially allows for enhanced risk assessment, safety planning and possible prevention of future deaths related to domestic violence through appropriate interventions by criminal justice system and healthcare partners, including high risk case identification and management.
A complete list of all risk factors analyzed, as well as the definition of each, is included in Appendix B.
When reviewing a case, the DVDRC identifies which, if any, of the 41 risk factors were present in the relationship between the victim and the perpetrator. The victim is considered the primary target of the perpetrator’s abusive/maltreating/violent actions. In some cases, the person(s) killed may not have been the intended victims.
Graph 3: Frequency of Common Risk Factors in DVDRC Cases Reviewed (2003–2020)
Note: Graph includes all reviews, including executive reviews in 2015 and 2019. Victim vulnerability was added as a risk factor in 2017.
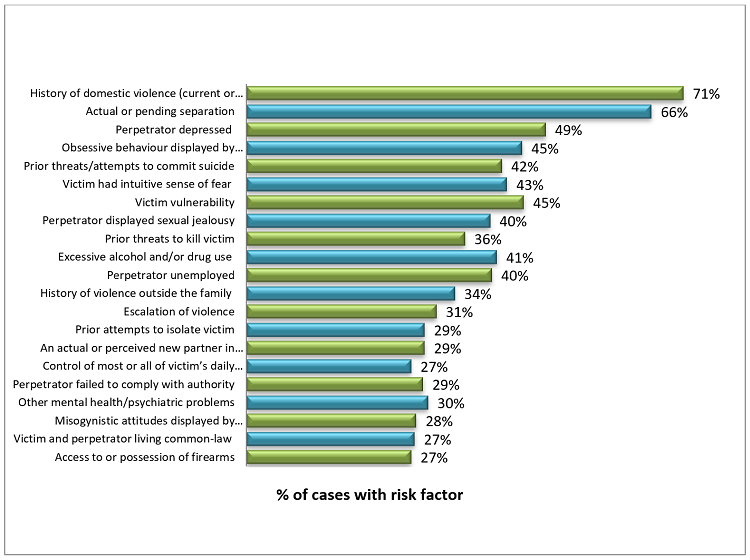
Summary of Graph 3: Frequency of Common Risk Factors in DVDRC Cases Reviewed (2003–2020)
- when reviewing a case, the DVDRC identifies which of the 41 established risk factors were present in the relationship between the perpetrator and the victim.
- in 71% of all cases reviewed from 2003–2020, there was a history of domestic violence (past or present).
- in 66% of the cases, the couple had an actual or pending separation.
- in 49% of the cases, the perpetrator was depressed (diagnosed and/or undiagnosed).
- in 45% of the cases, obsessive behaviour was displayed by the perpetrator.
- in 45% of the cases
footnote 1 , victim vulnerability was identified as a risk factor. - in 42% of the cases, the perpetrator had threatened or attempted at suicide.
- in 43% of the cases, the victims had an intuitive sense of fear.
- in 40% of the cases, the perpetrator displayed sexual jealousy.
- in 36% of the cases, there were prior threats to kill the victim.
- in 41% of the cases, excessive alcohol and/or drug use was involved.
- in 40% of the cases, the perpetrator was unemployed.
- in 34% of the cases, there was a history of violence outside of the family.
- in 31% of the cases, there was an escalation of violence.
- in 29% of the cases there was an attempt to isolate the victim.
- in 29% of the cases there was an actual or perceived new partner in the victim’s life.
Analysis of Risk Factors: Number of Risk Factors per Case
Chart 4: Number of Risk Factors per Case – All DVDRC cases reviewed (2003–2020), demonstrates that 70% of all cases reviewed by the DVDRC had seven or more risk factors identified. The significance of this finding is that many domestic homicides may have been predicted and prevented with earlier recognition and action towards identified risk factors for future lethality.
Chart 4: Number of Risk Factors per Case – All DVDRC Cases Reviewed (2003–2020)
| Number of risk factors per case | 2003–2019 (n-351) | 2020 (n=13) | 2003–2020 (n=364) | Percent of total cases |
|---|---|---|---|---|
| no factors | 5 | 0 | 5 | 1% |
| 1 to 3 factors | 47 | 1 | 48 | 13% |
| 4 to 6 factors | 53 | 0 | 53 | 15% |
| 7 or more factors | 246 | 11 | 257 | 71% |
The percentage of total cases based on number of risk factors is shown in a pie graph in Graph 4: Percent (%) of cases based on number of risk factors per case – All DVDRC cases reviewed (2003–2020).
Graph 4: Percent (%) of Cases Based on Number of Risk Factors Per Case – All DVDRC Cases Reviewed (2003–2020)
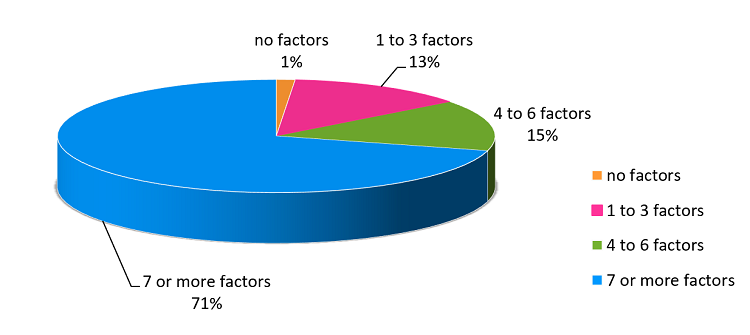
Summary of Chart 4 and Graph 4: Number of Risk Factors per Case – All DVDRC cases reviewed (2003–2020)
- in 71% of the cases reviewed from 2003–2020, seven or more risk factors were identified.
- in 15% of the cases reviewed from 2003–2020, four to six risk factors were identified.
- the combined proportion of cases with four or more risk factors was 86%.
- in 13% of the cases reviewed from 2003–2020, one to three risk factors were identified.
- in 1% of the cases reviewed from 2003–2020, no risk factors were identified.
- the recognition of multiple risk factors within a relationship allows for enhanced risk assessment, safety planning and possible prevention of future deaths related to domestic violence.
Statistical Overview: Cases Reviewed by the DVDRC in 2019 and 2020
The DVDRC conducted 20 full case reviews and two executive review in 2019. This included 19 homicide and three homicide-suicide cases, resulting in a total of 26 deaths (23 homicide victims and three perpetrator suicides).
In 2020, the DVDRC reviewed 13 cases. This included nine homicides and four homicide-suicides, resulting in 19 deaths (15 homicides and four perpetrator suicides).
A detailed summary, including the type of case (meaning homicide or homicide-suicide) age and sex of victims and perpetrators, number of risk factors and relevant themes for each, is included in Appendix C.
A brief narrative on the circumstances surrounding the death(s), as well as recommendations towards the prevention of future similar deaths, is included in Appendix D.
Full, redacted versions of individual cases reviewed by the DVDRC in 2019 may be requested directly from the Executive Lead, Committee Management at the Office of the Chief Coroner: occ.inquiries@ontario.ca
Chart 5 – Summary of Cases reviewed in 2019
Total number of cases reviewed: 22
Number of homicide cases: 19
#Number of homicide-suicide cases: 3
Total number of deaths reviewed: 26
Homicide deaths: 23
- Female (adult): 18
- Female (child): 1
- Male (adult): 4
- Male (child): 0
- Average age of victim: 39
Suicide deaths: 3
- Female: 0
- Male: 3
- Average age of all perpetrators: 40
- # of male perpetrators
footnote 2 : 18 - # of female perpetrators: 4
Number of cases with less than 7 risk factors: 7
Number of cases with 7 or more risk factors: 15
Average number of risk factors: 9
Number of cases involving age 65 or older: 3
Homicide-suicides w/elderly:: 1
Number of recommendations made: 32
Chart 5 – Summary of Cases reviewed in 2019, demonstrates that:
- There were 22 case reviews conducted by the DVDRC in 2019. This included 19 homicide cases and three homicide-suicide cases, resulting in 26 deaths (23 homicide victims and three perpetrator suicides).
- As a result of these reviews, there were 31 recommendations made towards the prevention of future similar deaths.
- Of the 23 homicide victims in the cases reviewed, 18 (78%) were adult females, four (17%) were adult males and one (4%) was a female child.
- Of the 22 cases, 18 (82%) involved male perpetrators and four (18%) involved a female perpetrator.
- In 15 (68%) of the cases, seven or more risk factors were identified.
- The average number of risk factors identified in cases reviewed in 2019 was 10.
Further analysis of the cases reviewed in 2019 demonstrated that:
- the victims ranged in age from six to 70 years.
- the average age of victims was 39 years.
- the perpetrators ranged in age from 19 to 71 years.
- the average age of perpetrators (deceased and living) was 40 years.
- the number of risk factors for individual cases ranged from zero to 21 (out of 41).
Analysis of Risk Factors: Number of Risk Factors per Case
The data in Chart 6: Number of Risk Factors Identified in Cases Reviewed (2019), are consistent with the findings with all cases reviewed by the DVDRC from 2003–2019 which clearly demonstrates that the vast majority of cases resulting in domestic homicide or homicide-suicide, had a significant number of risk factors (that is seven or more) and therefore were potentially predictable and preventable. It is important to again stress that the recognition of multiple risk factors within a relationship allows for enhanced risk assessment, safety planning and possible prevention of future deaths related to domestic violence. The number of risk factors for cases reviewed in 2019 ranged from zero to 20.
For a number of years, 40 risk factors were assessed for each case reviewed. In 2017, the additional risk factor of victim vulnerability was added to make 41 risk factors.
A complete list of all risk factors analyzed, as well as the definition of each, is included in Appendix B.
Chart 6: Number of Risk Factors Identified in Cases Reviewed (2019)
| Number and percent of risk factors per case | 2019 Reviews (n=22) | Total Reviews 2003–2019 (n=351) |
|---|---|---|
| no factors | 1 (5%) | 5 (1%) |
| 1 to 3 factors | 3 (14%) | 47 (13%) |
| 4 to 6 factors | 3 (14%) | 53 (15%) |
| 7 or more factors | 15 (68%) | 246 (70%) |
Chart 6 breaks down the number of identified risk factors in the cases reviewed in 2019 and compares them to the number of risk factors for all cases reviewed from 2003–2019.
The chart indicates that:
- in 2019, one case (5%) had no risk factors identified. This compares to 1% of all cases reviewed from 2003-2019.
- in 2019, three (14%) cases reviewed had one to three risk factors identified. This compares to 13% of all cases reviewed from 2003-2019.
- in 2019, three (14%) cases reviewed had four to six risk factors identified. This compares to 15% of all cases reviewed from 2003-2019.
- in 2019, 15 (68%) of cases reviewed had seven or more risk factors identified. This compares to 70% of all cases reviewed from 2003–2019.
- the risk factor findings for cases reviewed in 2019 is consistent with the findings shown in Chart Four and Graph Four which indicate that the majority of all cases reviewed from 2003-2019 have seven or more risk factors.
Analysis of Death Factors
Chart 7: Death factors for cases reviewed in 2019 shows that 54% of the cases involved some type of trauma (including cuts, stabs, beatings, assaults). Of the cases reviewed, 27% involved the use of a firearm, 8% were due to asphyxia (meaning hanging, airway obstruction, strangulation or neck compression) and 11% were from fire-related injuries, drug toxicity or undetermined.
Chart 7: Death Factors for Cases Reviewed in 2019
| Death Factor | Victim | Perp | Total |
|---|---|---|---|
| Trauma - cuts, stabs | 9 | 0 | 9 |
| Trauma - beating, assault | 4 | 0 | 4 |
| Trauma - blunt force | 1 | 0 | 1 |
| Shooting – handgun, rifle or shotgun | 5 | 2 | 7 |
| Asphyxia – strangulation/airway obstruction | 1 | 0 | 1 |
| Asphyxia - hanging | 0 | 1 | 1 |
| Other or undetermined | 3 | 0 | 3 |
| Total Deaths | 23 | 3 | 26 |
Recommendations made from 2019 Case Reviews
In 2019, 31 recommendations were made from reviews conducted by the DVDRC.
In addition to new recommendations made, when appropriate, the DVDRC referenced previous recommendations that were relevant to the circumstances of the case under review.
Recommendations focused on:
- awareness and training on risk factors for intimate partner homicide by physicians, nurses, mental health care providers, addiction counsellors, family law lawyers, crown attorneys and probation officers
- access to information by victims/families regarding history of intimate partner violence
- lessons learned case reviews for organizations involved
- public education campaigns and culturally appropriate intervention programs
- management of high-risk offenders.
A summary of all recommendations made in 2019 is included in Appendix D.
Discussion and Significant Findings for Cases Reviewed in 2019
The findings from reviews conducted in 2019 are consistent with the overall results from all reviews conducted from 2003–2019. Specifically:
- the majority of domestic violence homicide victims were female.
- the age range of victims is broad. In 2019, the range was from six to 70 years.
- the age range for perpetrators is also broad. In 2019, the range was from 19 to 71 years.
- the majority of cases reviewed had seven or more risk factors identified. The implication of numerous risk factors associated with these cases is that there was likely significant opportunity to predict (and prevent) future lethality in these cases.
- trauma (such as stabs, beating, blunt force injury) was the top death factor (54%), followed by shooting (27%), asphyxia (8%), other (11%).
Footnotes
- footnote[1] Back to paragraph Victim vulnerability was added as a risk factor in 2017. This percentage is based on cases reviewed from 2017–2019.
- footnote[2] Back to paragraph Three cases were reviewed that involved the same male perpetrator.