This page was published under a previous government and is available for archival and research purposes.
Module 3: Emissions Outlook
Emissions Outlook
The following slides provide additional detail on the greenhouse gas (GHG) emissions outlook discussed in the Fuels Technical Report (FTR).
Total GHG emissions from CO2, CH4 and N2O are presented in megatonnes (MT) of carbon dioxide equivalent (CO2e) for each demand outlook and sector.
All graphs are accompanied by the data supporting them.
Note: The GHG emissions outlook does not include emissions from electricity generation, which are addressed in the IESO’s Ontario Planning Outlook, or from industrial non-energy fuels demand.
Fuels combustion GHG emissions outlook
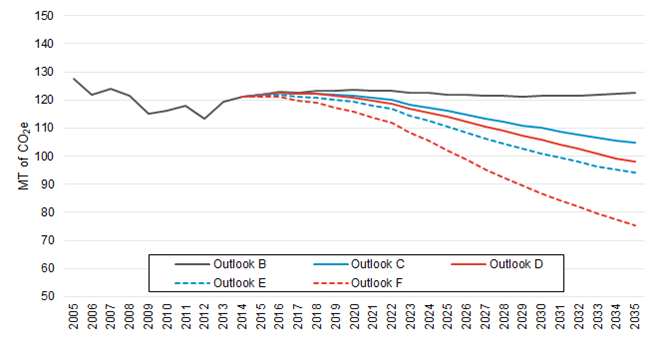
GHG Emissions Outlook. Downward trend in total GHG emissions for Ontario Planning Outlooks B, C, D, E and F measured in megatonnes. 2015 to 2035.
Fuels combustion GHG emissions outlook, MT of CO2e
| Year | B | C | D | E | F |
|---|---|---|---|---|---|
| 2015 | 122 | 122 | 122 | 121 | 121 |
| 2016 | 123 | 123 | 123 | 122 | 121 |
| 2017 | 123 | 122 | 122 | 121 | 120 |
| 2018 | 123 | 122 | 122 | 121 | 119 |
| 2019 | 123 | 122 | 121 | 120 | 117 |
| 2020 | 124 | 122 | 121 | 119 | 116 |
| 2021 | 123 | 121 | 120 | 118 | 114 |
| 2022 | 123 | 120 | 119 | 117 | 112 |
| 2023 | 123 | 118 | 117 | 114 | 108 |
| 2024 | 122 | 117 | 116 | 113 | 106 |
| 2025 | 122 | 116 | 114 | 110 | 102 |
| 2026 | 122 | 115 | 112 | 108 | 99 |
| 2027 | 121 | 113 | 111 | 106 | 95 |
| 2028 | 121 | 112 | 109 | 104 | 92 |
| 2029 | 121 | 111 | 107 | 103 | 90 |
| 2030 | 122 | 110 | 106 | 101 | 87 |
| 2031 | 122 | 109 | 104 | 99 | 84 |
| 2032 | 122 | 108 | 103 | 98 | 82 |
| 2033 | 122 | 106 | 101 | 96 | 80 |
| 2034 | 122 | 106 | 99 | 95 | 77 |
| 2035 | 123 | 105 | 98 | 94 | 75 |
Emissions relative to 2014 levels
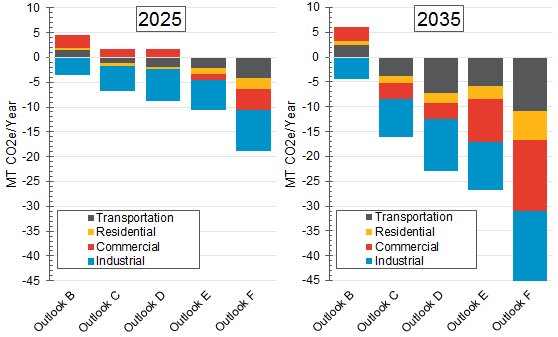
| MT CO2e/Year | B 2025 | C 2025 | D 2025 | E 2025 | F 2025 | B 2035 | C 2035 | D 2035 | E 2035 | F 2035 |
|---|---|---|---|---|---|---|---|---|---|---|
| Transportation | 1 | -1 | -2 | -2 | -4 | 2 | -4 | -7 | -6 | -11 |
| Residential | 0 | -1 | -1 | -1 | -2 | 1 | -1 | -2 | -3 | -6 |
| Commercial | 3 | 2 | 2 | -1 | -4 | 3 | -3 | -3 | -9 | -14 |
| Industrial | -4 | -5 | -6 | -6 | -8 | -4 | -8 | -11 | -10 | -15 |
Residential Fuels combustion GHG emissions outlook, MT of CO2e
| Year | B | C | D | E | F |
|---|---|---|---|---|---|
| 2015 | 21 | 21 | 21 | 21 | 21 |
| 2016 | 21 | 21 | 21 | 21 | 21 |
| 2017 | 21 | 21 | 21 | 21 | 21 |
| 2018 | 22 | 21 | 21 | 21 | 21 |
| 2019 | 22 | 21 | 21 | 21 | 21 |
| 2020 | 22 | 21 | 21 | 21 | 20 |
| 2021 | 22 | 21 | 20 | 20 | 20 |
| 2022 | 22 | 20 | 20 | 20 | 19 |
| 2023 | 22 | 20 | 20 | 20 | 18 |
| 2024 | 22 | 20 | 19 | 19 | 18 |
| 2025 | 22 | 20 | 19 | 19 | 17 |
| 2026 | 22 | 19 | 18 | 18 | 16 |
| 2027 | 22 | 19 | 18 | 17 | 15 |
| 2028 | 22 | 19 | 17 | 17 | 14 |
| 2029 | 22 | 18 | 17 | 16 | 13 |
| 2030 | 23 | 18 | 16 | 16 | 12 |
| 2031 | 23 | 18 | 16 | 16 | 12 |
| 2032 | 23 | 18 | 15 | 16 | 11 |
| 2033 | 23 | 17 | 15 | 15 | 11 |
| 2034 | 23 | 17 | 14 | 15 | 10 |
| 2035 | 23 | 17 | 13 | 15 | 10 |
Commercial Fuels combustion GHG emissions outlook, MT of CO2e
| Year | B | C | D | E | F |
|---|---|---|---|---|---|
| 2015 | 11 | 11 | 11 | 11 | 11 |
| 2016 | 11 | 11 | 11 | 11 | 11 |
| 2017 | 11 | 11 | 11 | 11 | 11 |
| 2018 | 11 | 11 | 11 | 11 | 10 |
| 2019 | 11 | 11 | 11 | 11 | 10 |
| 2020 | 11 | 11 | 11 | 10 | 10 |
| 2021 | 11 | 10 | 10 | 10 | 10 |
| 2022 | 11 | 10 | 10 | 10 | 10 |
| 2023 | 11 | 10 | 10 | 10 | 9 |
| 2024 | 11 | 10 | 10 | 10 | 9 |
| 2025 | 11 | 10 | 10 | 10 | 9 |
| 2026 | 11 | 10 | 10 | 9 | 8 |
| 2027 | 11 | 10 | 10 | 9 | 8 |
| 2028 | 11 | 10 | 10 | 9 | 7 |
| 2029 | 11 | 10 | 10 | 9 | 7 |
| 2030 | 11 | 10 | 10 | 9 | 7 |
| 2031 | 12 | 10 | 10 | 9 | 6 |
| 2032 | 12 | 10 | 10 | 9 | 6 |
| 2033 | 12 | 10 | 9 | 9 | 6 |
| 2034 | 12 | 10 | 9 | 8 | 5 |
| 2035 | 12 | 10 | 9 | 8 | 5 |
Industrial Fuels combustion GHG emissions outlook, MT of CO2e
| Year | B | C | D | E | F |
|---|---|---|---|---|---|
| 2015 | 29 | 29 | 29 | 29 | 29 |
| 2016 | 29 | 29 | 29 | 29 | 29 |
| 2017 | 28 | 28 | 28 | 28 | 28 |
| 2018 | 28 | 27 | 27 | 27 | 27 |
| 2019 | 27 | 27 | 26 | 27 | 26 |
| 2020 | 27 | 26 | 26 | 26 | 25 |
| 2021 | 27 | 26 | 25 | 26 | 24 |
| 2022 | 26 | 26 | 25 | 25 | 24 |
| 2023 | 26 | 25 | 24 | 24 | 23 |
| 2024 | 25 | 24 | 23 | 23 | 22 |
| 2025 | 25 | 24 | 22 | 23 | 21 |
| 2026 | 25 | 23 | 22 | 22 | 19 |
| 2027 | 25 | 23 | 21 | 22 | 19 |
| 2028 | 24 | 22 | 21 | 21 | 18 |
| 2029 | 24 | 22 | 20 | 21 | 17 |
| 2030 | 24 | 22 | 20 | 20 | 16 |
| 2031 | 24 | 22 | 19 | 20 | 16 |
| 2032 | 24 | 21 | 19 | 19 | 15 |
| 2033 | 24 | 21 | 18 | 19 | 15 |
| 2034 | 24 | 21 | 18 | 19 | 14 |
| 2035 | 24 | 21 | 18 | 19 | 14 |
Note: Does not include emissions from industrial non-energy fuels demand.
Transportation Fuels combustion GHG emissions outlook, MT of CO2e
| Year | B | C | D | E | F |
|---|---|---|---|---|---|
| 2015 | 61 | 61 | 61 | 61 | 61 |
| 2016 | 62 | 62 | 62 | 61 | 61 |
| 2017 | 62 | 62 | 62 | 62 | 61 |
| 2018 | 63 | 63 | 63 | 62 | 61 |
| 2019 | 63 | 63 | 63 | 62 | 61 |
| 2020 | 64 | 64 | 64 | 62 | 60 |
| 2021 | 64 | 64 | 64 | 62 | 60 |
| 2022 | 64 | 63 | 63 | 61 | 59 |
| 2023 | 64 | 63 | 63 | 61 | 58 |
| 2024 | 64 | 63 | 63 | 60 | 57 |
| 2025 | 63 | 62 | 62 | 59 | 56 |
| 2026 | 63 | 62 | 62 | 59 | 55 |
| 2027 | 63 | 61 | 61 | 58 | 54 |
| 2028 | 63 | 61 | 61 | 57 | 53 |
| 2029 | 63 | 60 | 60 | 56 | 52 |
| 2030 | 63 | 60 | 60 | 56 | 52 |
| 2031 | 63 | 60 | 60 | 55 | 51 |
| 2032 | 63 | 59 | 59 | 54 | 49 |
| 2033 | 63 | 58 | 58 | 53 | 48 |
| 2034 | 63 | 58 | 58 | 53 | 47 |
| 2035 | 64 | 58 | 58 | 52 | 47 |