This page was published under a previous government and is available for archival and research purposes.
The State of the System: 10-Year Review
1.1 Overview
Notes to this Report
Units of Measure: To compare fuels on an equivalent basis, all energy is reported as units of energy content in gigajoules (GJ) and petajoules (PJ). These measures can be characterized as follows:
- A PJ is a million GJ
- A house uses about 100 GJ of energy in a year
- 100 litres of gasoline provides about 3.5 GJ
- A kilowatt-hour is 0.0036 GJ
- A terawatt-hour is 3.6 PJ
- Burning 50,000 tonnes of wood produces 1 PJ
Historic Data: Historical modeled data are derived primarily from data published by Natural Resources Canada and Statistics Canada. Actual data is typically reported one to three years later than real time. Values presented for 2014 and 2015 may therefore represent modeled projections or estimates, rather than actual values.
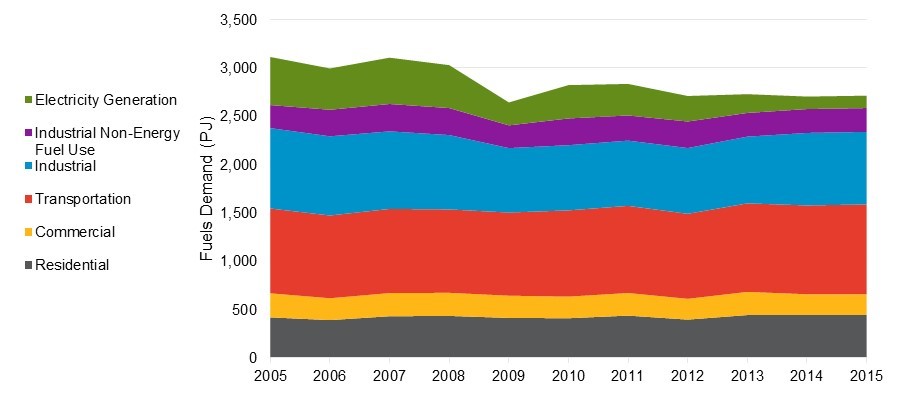
In 2015, Ontario consumed approximately 2,500 PJ of fuel for energy purposes. This is a decline from approximately 2,900 PJ in 2005, reflecting the phase out of coal use for electricity generation, improving efficiency and conservation efforts and changes in economic activity. The majority of the energy consumed in Ontario continues to be derived from the fuels discussed in this technical report. Since 2010, approximately 500 PJ of electric energy have been consumed annually, approximately one-fifth of the provincial fuels energy use.
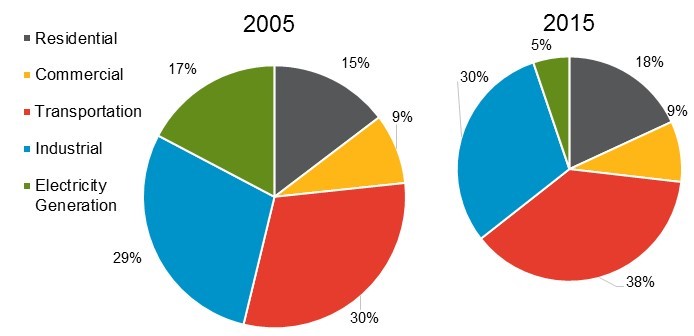
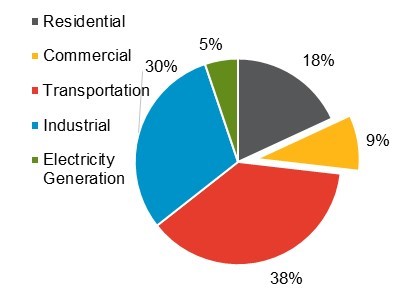
Since 2005, sectoral shares of total energy have changed. The most significant, and visible, change is the amount of fuels energy used for electricity generation, which has declined by three-quarters relative to 2005. The residential and transportation sectors have both experienced modest growth in fuels use in this period, and the commercial and industrial sectors have experienced a small decline in fuels use.
Figure 1: Total Ontario Fuels Energy Demand
Accessible data table for Figure 1
Source: CanESS, 2016
Figure 2: Fuels Energy Demand by Sector 2005 and 2015
Accessible data table for Figure 2
Source: CanESS, 2016
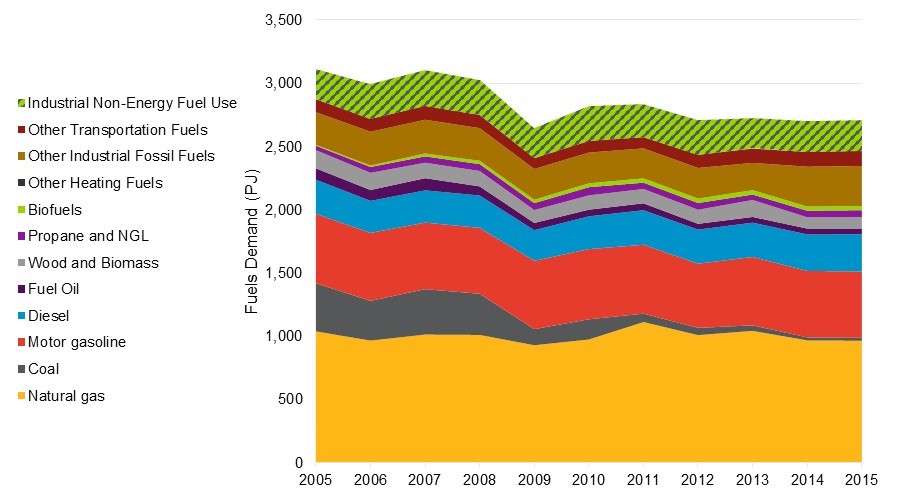
The Ontario fuels sector is comprised of numerous different fuel types with a variety of diverse applications. Although a small number of fuels (i.e., natural gas, gasoline and diesel) account for the majority of fuels energy use in the province, many, many more fuels also exist to service quasi-niche needs. Propane, wood and biomass, kerosene, aviation fuel, biofuels, petroleum coke and others all serve a variety of end-uses in the residential, commercial, industrial and transportation sectors.
Figure 3: Fuels Energy Demand by Fuel Type
Accessible data table for Figure 3
Source: CanESS, 2016
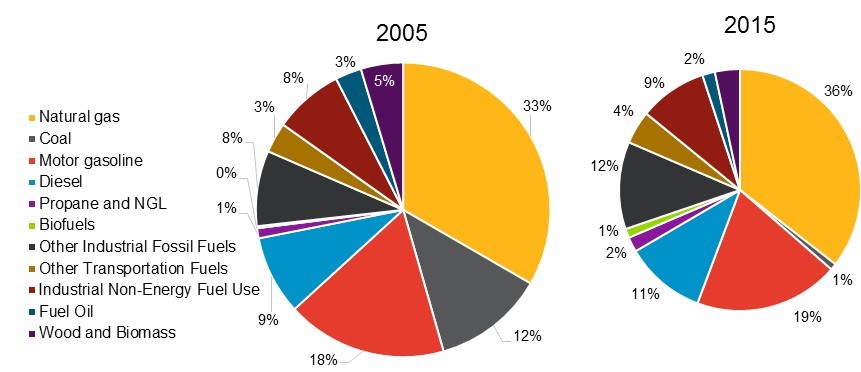
Since 2005, the most substantial shift in fuel consumption has been the reduction in coal use, from 12% of fuels energy to less than 1%, used nearly exclusively by the industrial sector. This is principally due to the retirement of the provincial coal-fired electricity generation fleet. The other most significant change in the distribution of fuels use in Ontario is the growth in the use of biofuels, principally ethanol, over the period. Since 2005, ethanol use (mostly for blending with gasoline) has nearly tripled in Ontario.
Figure 4: Fuels Demand by Fuel Type 2005 and 2015
Accessible data table for Figure 4
Source: CanESS, 2016
1.2 Natural Gas
Natural gas is found deep beneath the earth’s surface. Natural gas consists mainly of methane, although other liquid hydrocarbons (called natural gas liquids or NGLs) can be entrained in natural gas supply.
In Ontario, natural gas is commonly used as a fuel for space and water heating in the residential and commercial sectors. It also has important applications in industry, as a fuel source for energy-intensive operations (e.g., process heat) and non-energy uses (i.e., to make materials and chemicals). In 2015, natural gas generation accounted for about 10% of Ontario’s electricity production and 25% of the province’s installed electricity generating capacity.
Natural gas is delivered to Ontario via a complex system of high volume transmission pipelines. Historically, much of Ontario’s natural gas supply was sourced from Western Canada. However, U.S. gas production has increased in recent years - especially in areas proximate to Ontario (such as Pennsylvania) - resulting in Ontario meeting more of its requirements from U.S. production. Ontario produces minimal quantities of natural gas within its borders (i.e., less than 1% of demand).
Figure 5: Natural Gas Delivery

Source: Canadian Energy Pipeline Association (CEPA), 2016.
Ontario uses storage infrastructure in southwestern Ontario (near Sarnia) called the Dawn Hub to help manage seasonal demand, by storing gas during the summer and providing it during the winter. Figure 6 below illustrates the seasonal demand at Dawn. The Dawn Hub is one the largest storage facilities in North America and is used to manage natural gas demand by end-users in Ontario, Quebec and the eastern U.S.
Figure 6: Dawn Storage 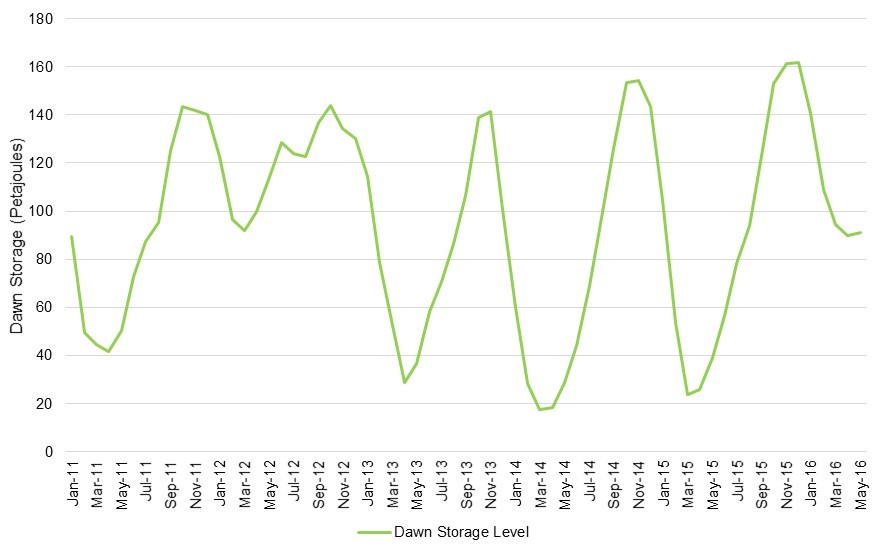
Accessible data table for Figure 6
Source: Velocity Suite, 2016. SNL Natural Gas Prices, 2016.
Within Ontario, natural gas is delivered to end-users by a network of transmission and distribution pipelines. These pipeline systems are operated by local distribution companies (LDCs). In Ontario, delivery charges by LDCs are rate regulated by the Ontario Energy Board (OEB) through a public and transparent review process. The OEB regulates rates to protect ratepayers while ensuring that the LDCs cover their delivery costs and earn a fair return.
Ontario gas customers have a choice of buying the natural gas commodity from the LDCs or through independent marketers. The commodity component supplied by the LDCs is regulated on a “pass through” basis and its price fluctuates quarterly as gas market conditions change. The LDC earns no return on the sale of the gas commodity. The gas commodity provided by independent marketers is not regulated. Independent marketers may offer fixed price contracts or attributes such as renewable natural gas. The LDCs and marketers acquire the natural gas supply in an unregulated, integrated North American market. To attract supply to the province, Ontario gas users must pay the market price (i.e., Ontario is a price taker).
1.3 Propane
Propane is a natural gas liquid (NGL) that is extracted at natural gas processing facilities. Propane is also a by-product of the petroleum refining process.
In Ontario, propane is commonly used as a home heating fuel, predominantly in rural areas and communities without access to natural gas. Other propane uses include: water heating, barbeques, portable heating, agricultural (e.g., crop drying, greenhouse and livestock facility heating), transportation (i.e., propane vehicles) and non-energy uses (e.g., feedstock to make plastics).
Since propane is extracted from natural gas, significant quantities are imported into Ontario from Western Canada and other continental sources by rail. However, unlike natural gas, Ontario does have domestic propane production sources. Ontario’s four petroleum refineries produce propane and an industrial facility in Sarnia-Lambton (called a "fractionator") processes a pipeline delivered NGL-mix into on-specification products (i.e., propane, butane and ethane) for the Ontario and regional market.
Within Ontario, propane is delivered to end users by truck. About 140 large propane distribution facilities are located in Ontario. These facilities may be supplied by truck or (for larger facilities) by rail and have above-ground propane storage tanks.
Figure 7: The Canadian Propane Industry Supply Chain
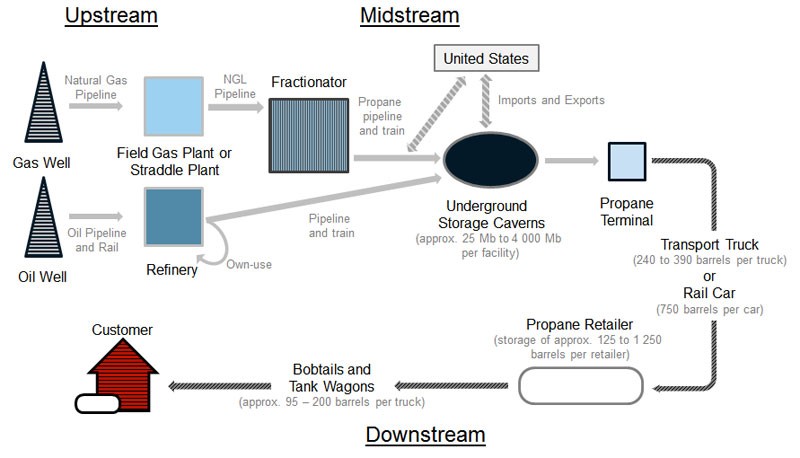
Source: NRCan
Propane can also be stored underground in salt caverns and depleted production wells. Typically, propane is injected into storage in summer months and withdrawn from storage in winter months. Ontario uses storage infrastructure in the Sarnia-area to manage seasonal demand. The Sarnia area is a key storage propane hub in eastern North America and is used to manage propane demand by end-users in Ontario, Quebec and the eastern U.S.
Wholesale propane commodity prices are determined in an unregulated, integrated North American market. In Ontario, propane distributors compete to supply end-users and end-user prices are not regulated.
1.4 Oil Products
Oil products are produced at petroleum refineries. Petroleum refineries are industrial facilities that process crude oil into finished fuels like gasoline, diesel, jet fuel and fuel oil; and non-energy products like petrochemical feedstocks and asphalt. Crude oil is a fossil fuel, and it exists as a mixture of hydrocarbons in liquid form in underground pools or reservoirs, in tiny spaces within sedimentary rocks, and near the surface in oil sands.
In Ontario, oil products are predominantly used in the transportation sector to fuel cars, trucks, buses and planes. Fuel oil (or heating oil) is also used to provide space heating in rural areas and remote communities without access to natural gas. Diesel can also be used to generate electricity in remote communities or as backup generation. Important industrial uses of oil products include use as feedstock for the chemical sector. Another significant non-energy use of oil products is asphalt for road construction.
Four fuel refineries are located in Ontario, in Sarnia and Nanticoke. These facilities, which have a crude oil processing capacity of 393,000 barrels per day, supply a significant portion of Ontario’s oil product demand. Ontario also imports oil products by pipeline (via the Trans Northern pipeline from Quebec, which supplies Eastern Ontario and the Toronto area), rail and marine (during the Great Lakes / Seaway shipping season). As with natural gas, Ontario has minimal crude oil production within its borders and relies on oil pipelines to deliver crude oil to the fuel refineries located in the province.
Within Ontario, oil products are delivered to distribution terminals by pipeline, rail, marine and truck. Southern Ontario terminals are typically supplied by pipeline while more remote terminals are supplied by other modes. Ultimately, most oil products used in transportation and in the residential and commercial sectors are delivered to their final point of distribution (or use) by truck.
Figure 8: Crude Oil Delivery
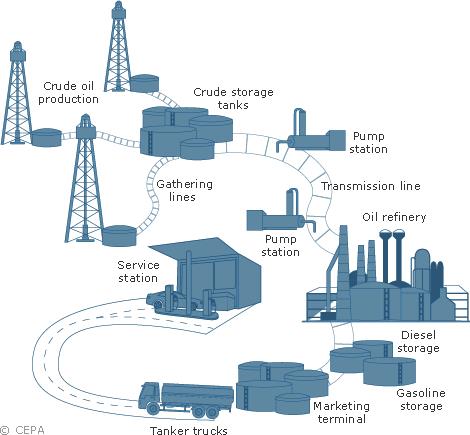
Source: Canadian Energy Pipeline Association (CEPA), 2016.
Oil products are typically stored at refineries and distribution terminals. Oil product storage is typically used to manage day-to-day or week-to-week fluctuations in demand. As oil product demand is less seasonal than for natural gas or propane, there is less long-term storage infrastructure for oil products than for some other fuels.
Both crude oil and petroleum product prices are determined in an unregulated, integrated North American market. Consequently, to attract supply to the province, Ontario crude oil and oil product users must pay the market price (i.e., Ontario is a price taker).
1.5 Wood and Biomass
Biomass and wood are renewable resources (e.g., forest or agricultural materials) that are used in a variety of fuel applications.
Biomass and wood resources are used as energy sources in industry, especially in the forestry sector. Biomass is used as the fuel for electricity generation at converted coal stations (e.g., Atikokan Generating Station) as well as at combined heat and power facilities. For space heating, wood stoves are a common secondary heat source in rural and remote communities and are the primary heat source in some areas. Wood pellets can be used to provide space heating in larger businesses (commercial businesses, hospitals, schools, etc.) - although this usage is not yet widespread in Ontario.
As illustrated in Figure 9, the biomass supply chain consists of harvesting, processing, baling, transportation and conversion. Harvesting of biomass can be performed using manual or mechanized techniques, depending on size and cost. Processing biomass involves converting the harvested timber into smaller pieces. Wood chip and pellet baling compact the wood for ease of transport. Biomass relies on transportation and distribution by truck.
Figure 9: Biomass Delivery
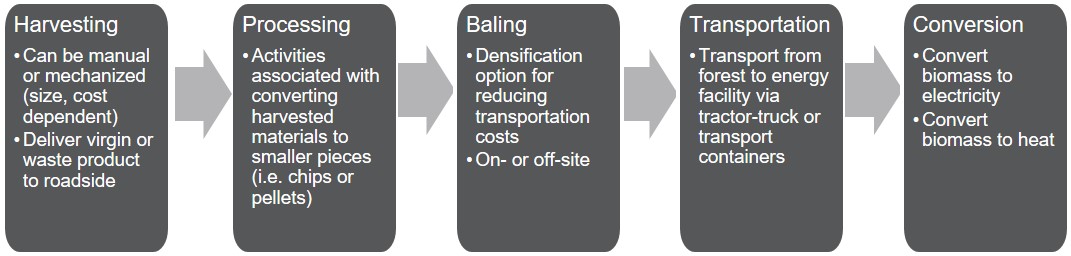
- Harvesting
- Can be manual or mechanized (size, cost dependent)
- Deliver virgin or waste product to roadside
- Processing
- Activities associated with converting harvested materials to smaller pieces (i.e. chips or pellets)
- Bailing
- Densification option for reducing transportation costs
- On- or off-site
- Transportation
- Transport from forest to energy facility via tractor-truck or transport containers
- Conversion
- Convert biomass to electricity
- Convert biomass to heat
Ontario has substantial forestry resources and biomass more generally. Ontario’s forest management guides and standards are regularly updated - this ensures that new uses of Crown forest resources, like bioenergy, occur in a sustainable way.
Current pricing of biomass is largely based on costs of acquisition and distribution.
1.6 Alternative Fuels
Alternative fuels currently available in Ontario consist of three distinct fuels: ethanol, biodiesel / renewable diesel and renewable natural gas.
Ethanol
Ethanol is a renewable fuel. It is a clear, colorless alcohol made from the sugars found in grains, such as corn, sorghum, and barley, as well as potato skins, rice, sugar cane, sugar beets and yard clippings.
In Ontario, ethanol is primarily used to fuel automobiles. Since 2007, Ontario regulations have required that fuel suppliers' sales of gasoline contain at least 5% ethanol content (calculated on an annual average basis). Some ethanol produced in Ontario is used in the beverage sector and in industrial applications (e.g., paints/solvents, base chemicals, disinfectants, etc.).
Ontario has six manufacturing facilities in the province. All of the Ontario facilities use corn as the feedstock to produce ethanol. Corn is delivered to ethanol facilities by truck; corn used at Ontario ethanol facilities is mostly domestically produced although there are some imports. Ontario also imports ethanol by truck and rail.
Ethanol is delivered to petroleum distribution terminals by truck and rail, where it is blended with a gasoline-blendstock to produce an on-specification finished fuel.
Similar to oil products, there is limited on-site storage for ethanol at production facilities and distribution terminals.
The ethanol delivery network is illustrated in Figure 10 below.
Figure 10: Ethanol Delivery Network
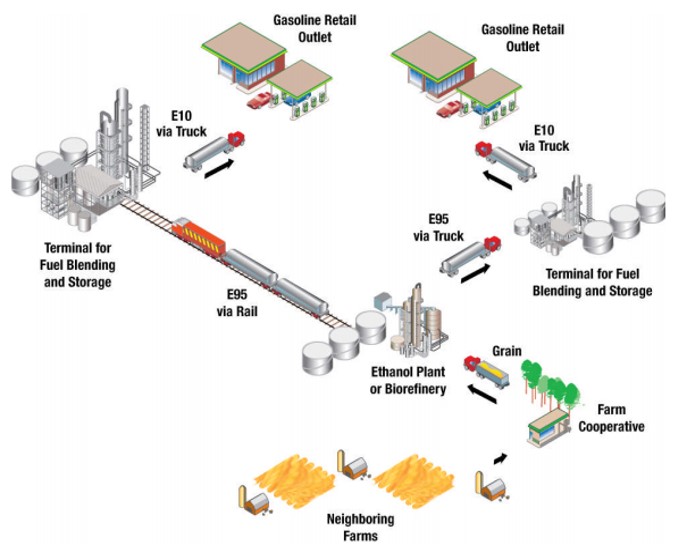
Source: National Bioenergy Center, National Renewable Energy Laboratory
Wholesale ethanol commodity prices are determined in an unregulated, integrated North American market.
Biodiesel / Renewable Diesel
Biodiesel is a renewable fuel that can be used instead of diesel fuel made from petroleum. Biodiesel can be made from vegetable oils (e.g., soybean oil) and animal fats. Renewable diesel can be made from the same feedstocks as biodiesel; however, it is processed in a way that the product is chemically similar to petroleum diesel.
Biodiesel and renewable diesel are used as petroleum diesel replacements and additives in the transportation sector. Since 2014, Ontario has required fuel suppliers to have bio-based content in their diesel supplies. By 2017, the blending requirement will be 4%.
Ontario has five biodiesel manufacturing facilities. Some biodiesel is used in Ontario; however, some production is exported to capture lucrative U.S. incentives. Biodiesel is typically transported by rail and truck. Renewable diesel is only produced at a few facilities globally - none in Ontario.
Biodiesel distribution within Ontario is primarily by truck and rail. As with ethanol, biodiesel is blended with diesel at petroleum distribution terminals (Note: One biodiesel producer in Ontario is located adjacent to a petroleum distribution terminal and connects to that terminal by pipeline).
Similar to ethanol and petroleum products, there is limited on-site storage for biodiesel.
Wholesale biodiesel commodity prices are determined in an unregulated, integrated North American market. The biodiesel delivery network is illustrated in Figure 11 below.
Figure 11: Biodiesel Delivery Network
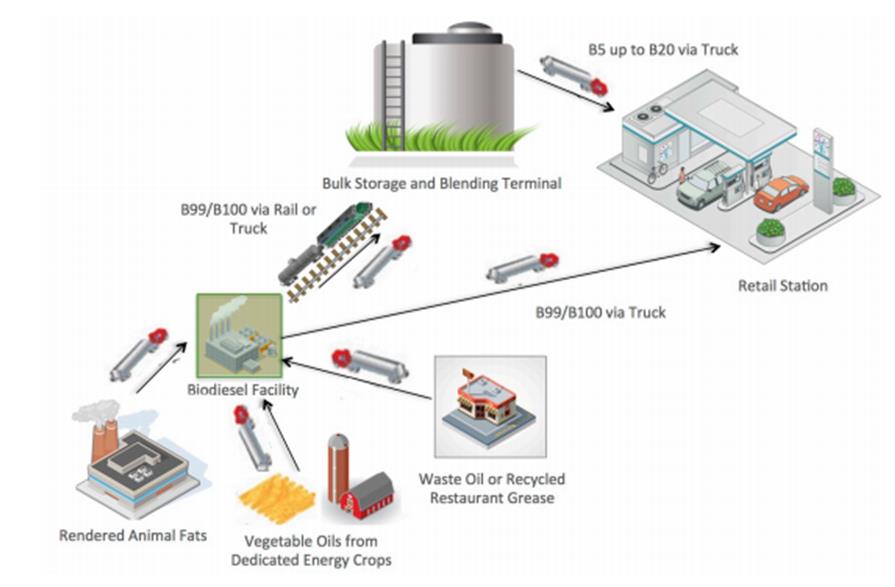
Source: Stillwater Associates LLC
Renewable Natural Gas
Renewable natural gas (RNG) is the methane component of biogas, which is produced from the decomposition of organic matter. Biogas can be derived from landfills, livestock operations, farms, wastewater treatment plants or waste from industrial facilities (e.g., food processors). Once processed to remove impurities, the resulting RNG can be injected into the natural gas pipeline system and is fully interchangeable with conventional natural gas.
In 2013, there were 37 operating biogas facilities in Ontario. However, production volumes from these facilities were quite small, relative to the size of the province’s natural gas system. RNG production requires connections to the province’s natural gas system as well as equipment to process the RNG to ensure quality standards are met.
RNG can use existing storage resources of the natural gas system. Currently, RNG is procured on a site-by-site basis, typically under long-term contracts.
Figure 12 below illustrates the renewable natural gas production process.
Figure 12: Renewable Natural Gas Production Process
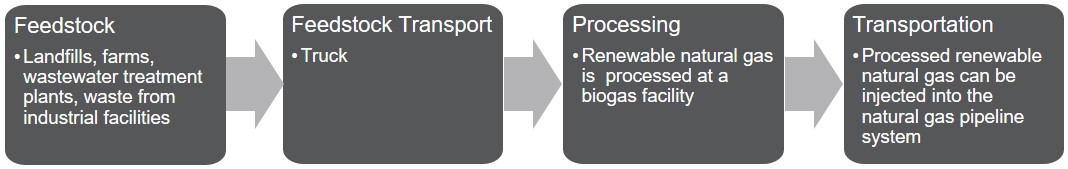
- Feedstock
- Landfills, farms, wastewater treatment plants, waste from industrial facilities
- Feedstock Transport
- Truck
- Processing
- Renewable natural gas is processed at a biogas facility
- Transportation
- Processed renewable natural gas can be injected into the natural gas pipeline system
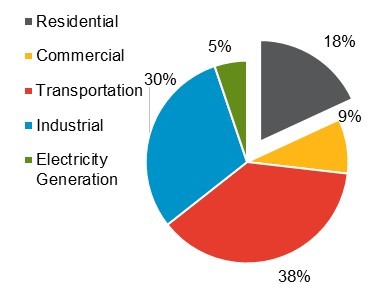
1.7 Demand
This section of Chapter 1 provides additional detail regarding the fuels energy by four sectors: residential, commercial, industrial, and transportation. Readers interested in the electricity generation sector may refer to the Independent System Operator (IESO) Ontario Planning Outlook (OPO) report.
1.7.1 Residential
The residential sector consumes approximately 18% of Ontario’s fuels energy.
Figure 13: Ontario Residential Fuels Demand - 2015
Accessible data table for Figure 13
Source: CanESS, 2016
Natural gas is the main fuel used in the residential sector, used for space and water-heating. Natural gas supplied over 80% of the total fuel energy used in the sector in 2015. Fuel demand in the residential sector is dominated by space heating. In Ontario, approximately 75% of total fuels energy demand in the home is used for space heating.
The demand for space heating results in year to year changes in residential fuel demand, reflecting milder and colder heating seasons.
Figure 14 illustrates this year over year variability.
Figure 14: Residential Demand by Fuel Type: 2005-2015
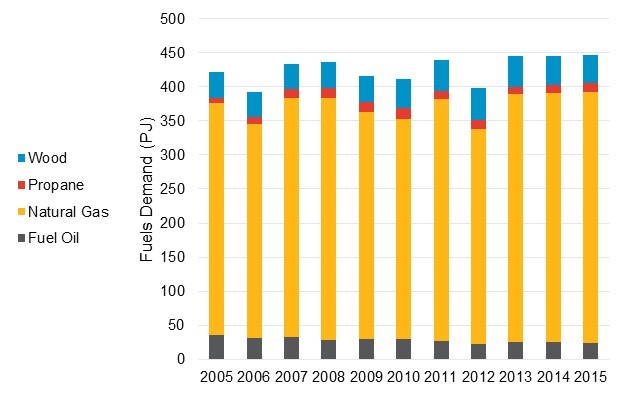
Accessible data table for Figure 14
Source: CanESS, 2016
From 2005 to 2015, overall fuels energy use per square metre in the residential sector decreased by 11%. This reflects total efficiency gains in the sector. Over the period, improved energy efficiency in heating equipment, conservation efforts, more stringent building codes, tighter building envelopes for new construction and increasing urbanization and housing density have contributed to a reduction in energy use of 0.08 GJ per square metre as shown in Figure 15, below.
Figure 15: Residential Fuels Energy Use Per Square Metre of Floor-Space
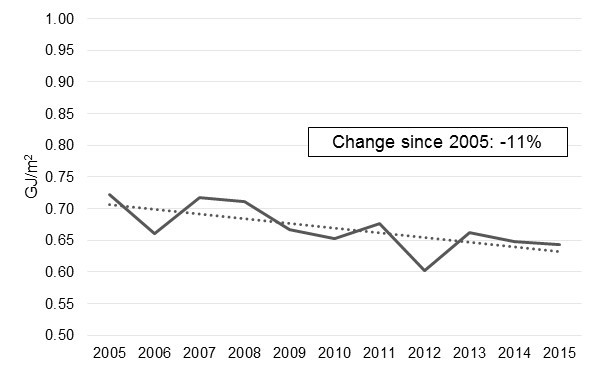
Accessible data table for Figure 15
Source: CanESS, 2016
1.7.2 Commercial
The commercial sector consumes approximately 9% of Ontario’s fuels energy.
Figure 16: Commercial Fuel Demand - 2015
Accessible data table for Figure 16
Source: CanESS, 2016
Natural gas is the main fuel used in the commercial sector, used principally for space and water-heating. Natural gas supplied more than 90% of the total fuel energy used in the sector in 2015. Fuel demand in the commercial sector is dominated by space heating. In Ontario, approximately 85% of total fuels energy demand in commercial buildings is used for space heating.
Although the commercial sector’s fuels use is quite sensitive to annual weather trends, it is more sensitive than the residential sector to changes in the economy.
Figure 17: Commercial Demand by Fuel Type: 2005-2015
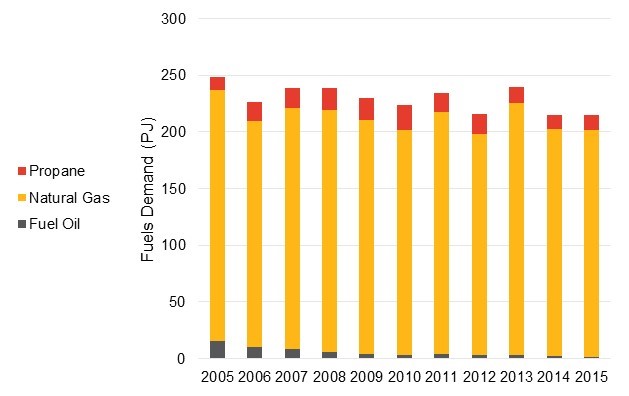
Accessible data table for Figure 17
Source: CanESS, 2016
From 2005 to 2015, overall fuels energy use per square metre in the commercial sector decreased by 26%. This reflects total efficiency gains in the sector. Over the time period, improved energy efficiency in heating equipment, conservation efforts, more stringent building codes, tighter building envelopes for new construction and trends in commercial activities have contributed to a reduction in energy use of 0.26 GJ per square metre as shown in Figure 18, below.
Figure 18: Commercial Fuels Energy Use Per Square Metre of Floor-Space
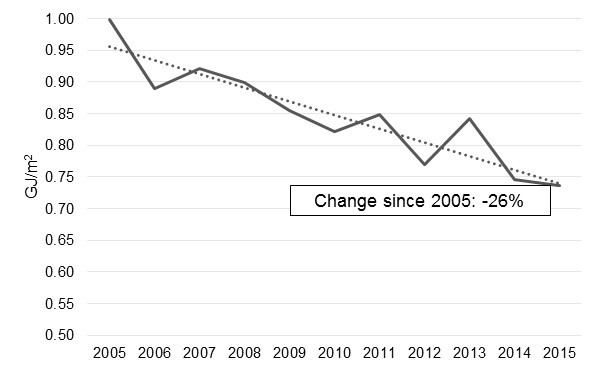
Accessible data table for Figure 18
Source: CanESS, 2016
1.7.3 Industrial
The industrial sector consumes approximately 30% of Ontario’s fuels energy. In addition to this fuel used for energy (approximately 750 PJ in 2015), the industrial sector used an additional approximately 250 PJ of fuels in 2015 for non-energy purposes (e.g., as feedstock for down-stream products).
Figure 19: Industrial Fuel Demand - 2015
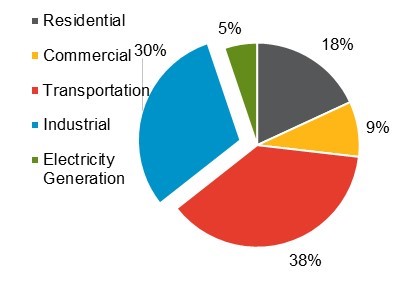
Accessible data table for Figure 19
Source: CanESS, 2016
In contrast to the residential and commercial sectors, the industrial sector makes use of a wide variety of fuels for energy use. Like in the residential and commercial sectors, natural gas is the most common fuel used, however it represents less than 40% of total fuel energy use. Coal, coke and coke gas represent approximately a third of all industrial energy use, with other fuels such as kerosene, propane (and other natural gas liquids) and biomass serving important industrial niches.
Macroeconomic fluctuations and other drivers of industrial production are the principal drivers of fuels consumption variability, rather than weather.
Figure 20: Industrial Energy Demand by Fuel Type: 2005-2015
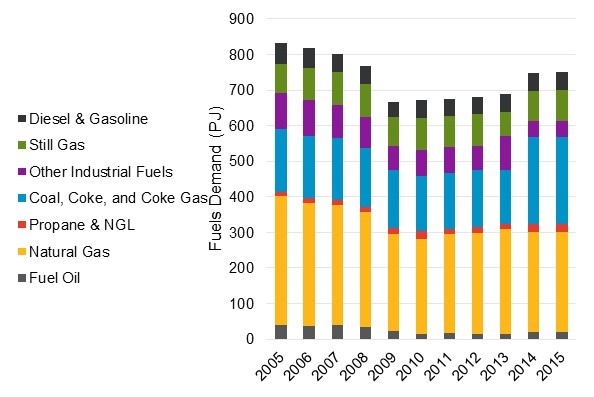
Accessible data table for Figure 20
Source: CanESS, 2016
In addition to energy and combustion-related demand, a substantial amount of fuels product is used in non-energy processes as a raw material feedstock. For example, natural gas is used as an input to produce hydrogen, petroleum products are used in the production of asphalt, pesticides and plastics and a number of fuels products can be used to develop lubricants and greases. Non-energy related fuels consumption is illustrated in Figure 21 below. Note: The “Coal, Coke and Coke Gas” category shown below includes petroleum coke.
Figure 21: Non-Energy Industrial Demand by Type: 2005-2015
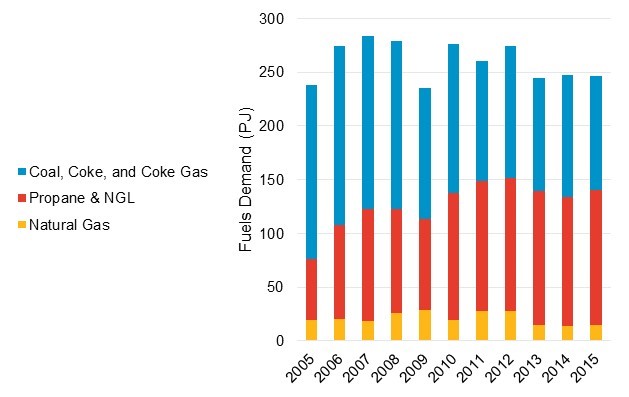
Accessible data table for Figure 21
Source: CanESS, 2016
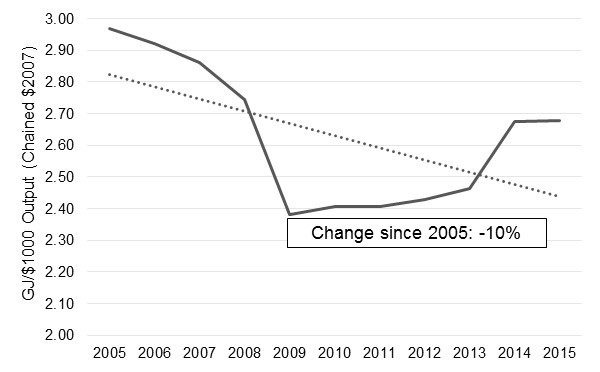
From 2005 to 2015, overall fuels energy used per $1,000 of economic output decreased by 10%. This reflects efficiency gains in the sector, and may also reflect production utilization. Over the time period, improved energy efficiency in industrial processes, conservation efforts, the impact of macroeconomic trends on industrial output, and other trends in activity towards less energy intensive industries, have contributed to a reduction in energy use of 0.29 GJ per $1,000 of output as shown in Figure 22, below.
Figure 22: Industrial Fuels Energy Use Per $1,000 of Economic Output
Accessible data table for Figure 22
Source: CanESS, 2016
1.7.4 Transportation
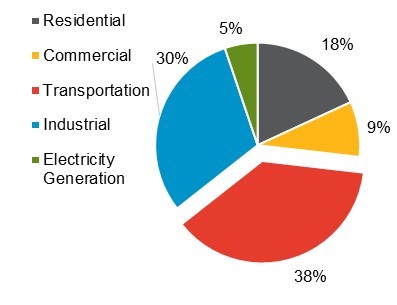
The transportation sector consumes approximately 38% of Ontario’s fuels energy.
Figure 23: Transportation Energy Fuel Demand - 2015
Accessible data table for Figure 23
Source: CanESS, 2016
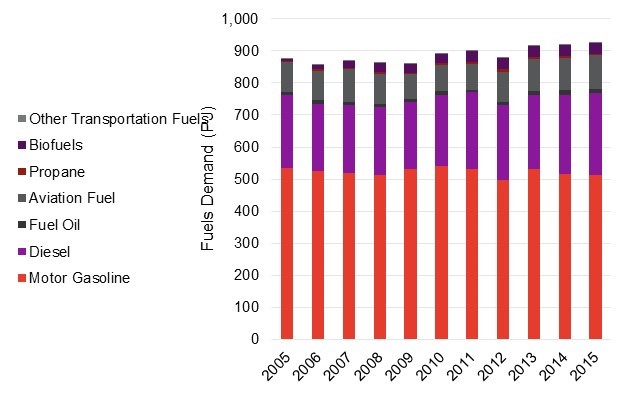
Gasoline and diesel dominate transportation fuels use, representing nearly 85% of total transportation fuels use in 2015. Most gasoline and diesel fuel is used by road transportation. Biofuels (ethanol and bio-based diesels) have grown substantially in relative importance, from less than 1% of transportation fuels energy use in 2005 to nearly 3% in 2015. Biofuels are typically blended with their corresponding conventional fossil fuel in order to meet existing green fuel mandates. Other fuels include fuel oil (typically in marine applications), aviation fuel, and other, more niche fuels, including propane and compressed natural gas.
Propane is typically used for high-usage short-range vehicles (taxis and delivery vans), and compressed natural gas is typically used in more heavy-duty applications, notably for urban transit buses. Transportation fuels use is less variable than fuels use in any of the other sectors considered in this report.
Figure 24: Transportation Demand by Fuel Type: 2005-2015
Accessible data table for Figure 24
Source: CanESS, 2016
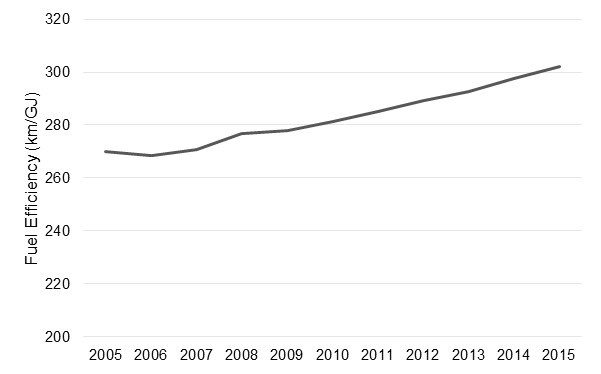
Improving efficiency standards and market pressures have substantially improved the efficiency of many vehicles since 2005. An intuitive example of this is the clear improvement in fuel efficiency of light duty road vehicles (cars and light trucks used for personal and commercial purposes). The efficiency of these vehicles has on average improved from 270 km/GJ (9.2 km/litre or 21.7 miles per gallon) in 2005 to 302 km/GJ (10.3 km/litre or 24.3 miles per gallon) in 2015.
Figure 25: Light Duty Vehicle Efficiency Improvements – 2005 to 2015
Accessible data table for Figure 25
Source: CanESS, 2016
1.8 Historical GHG Emissions
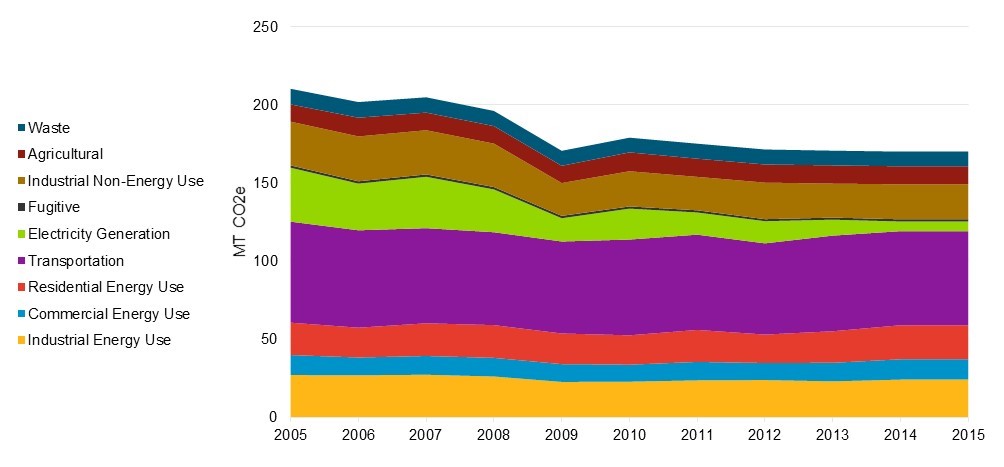
Ontario’s greenhouse gas (GHG) emissions have declined significantly over the past 10 years from 211 megatonnes (MT) of carbon dioxide equivalent (CO2e) in 2005 to approximately 170 MT in 2015.
Approximately two-thirds of this reduction is attributable to the electricity generation sector’s phase out of coal as a fuel source. The remainder is primarily attributable to changes in industrial non-energy use, transportation efficiency improvements and total industrial energy requirements.
Historical GHG emissions are illustrated in Figure 26 below. Both combustion and non-combustion emissions are illustrated in this figure. Fuel use for electricity generation is also shown to provide the overall trend in energy-related GHG emissions. This chart is provided to demonstrate the proportion of total GHGs relevant to the Fuels Technical Report: Residential, Commercial, Industrial and Transportation energy use (the bottom four areas of the graph). As of 2015, these comprise approximately 70% of provincial GHG emissions.
Figure 26: Historical Ontario GHG Emissions
Accessible data table for Figure 26
Source: Environment Canada
Footnotes
- footnote[1] Back to paragraph Values for 2014 and 2015 are, in some cases, projections or estimates rather than actuals.
- footnote[2] Back to paragraph Canadian Energy Pipeline Association, the Natural Gas Delivery Network. Accessed June, 2016.
- footnote[3] Back to paragraph National Energy Board, Propane Market Review: 2016 Update – Energy Briefing Note, May 2016
- footnote[4] Back to paragraph Canadian Energy Pipeline Association, the Crude Oil Delivery Network. Accessed June, 2016.
- footnote[5] Back to paragraph As cited in: United States Department of Agriculture, Agricultural Marketing Services (USDA-AMS), Ethanol transportation backgrounder: expansion of U.S. corn-based ethanol from the agricultural transportation perspective, September 2007.
- footnote[6] Back to paragraph Stillwater Associates LLC, Petroleum and Renewable Fuels Supply Chain, February 2016.
- footnote[7] Back to paragraph Independent Electricity System Operator, Ontario Planning Outlook, September 2016
- footnote[8] Back to paragraph In 2013, the combined energy use for residential non-electric space-heating was approximately 320 PJ. The total non-electric fuel use by the residential sector in the same year was approximately 428 PJ. Natural Resources Canada, Comprehensive Energy Use Database: Residential Sector, Accessed July 2016 Table 1 and Table 5
- footnote[9] Back to paragraph In 2013, the combined energy use for residential non-electric space-heating was approximately 202 PJ. The total non-electric fuel use by the commercial sector in the same year was approximately 235 PJ. Natural Resources Canada, Comprehensive Energy Use Database: Commercial Sector, Accessed July 2016 Table 1 and Table 24
- footnote[10] Back to paragraph Environment Canada, Environment Canada Data Catalogue, National and Provincial/Territorial Greenhouse Gas Emission Tables, Accessed July 2016 Table A11-12