This page is no longer current and is provided for archival and research purposes.
Sector Quick Facts
Mining and quarrying (except oil and gas) – NAICS 212
Industries in this subsector primarily engage in mining, mine site development, and beneficiating (preparing) metallic minerals and non-metallic metals, including coal. It does not include support services required for mining or quarrying minerals or metals.
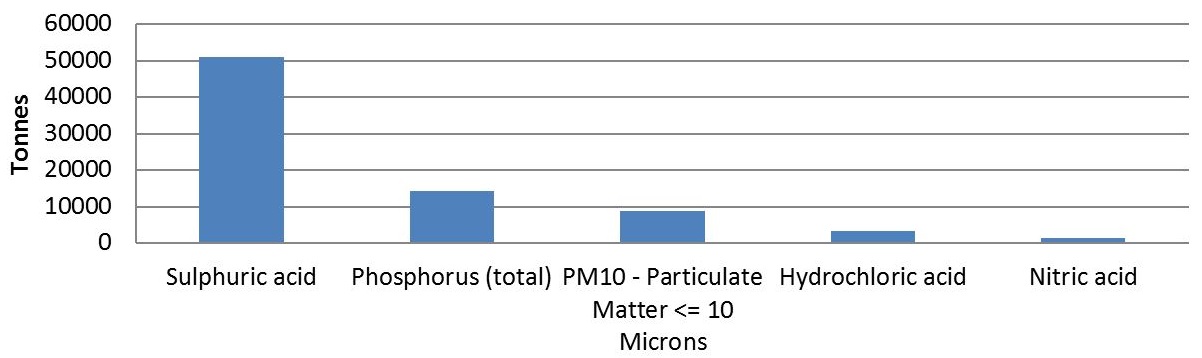
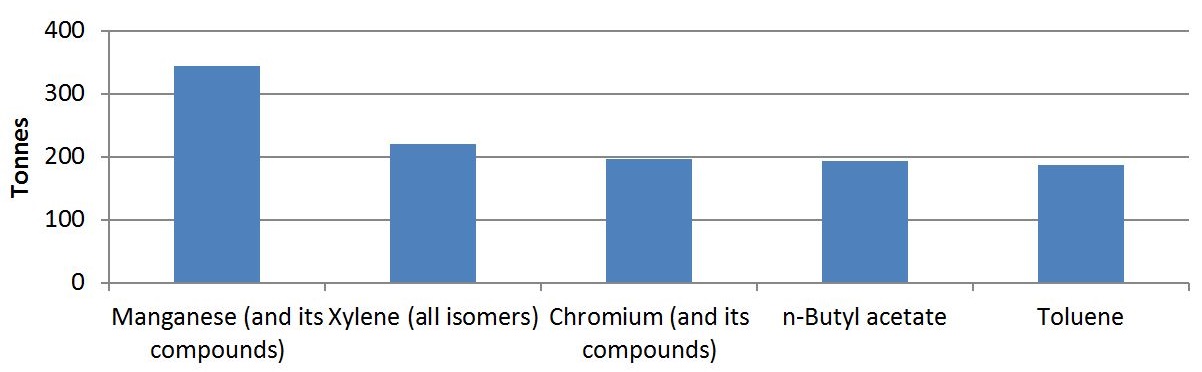
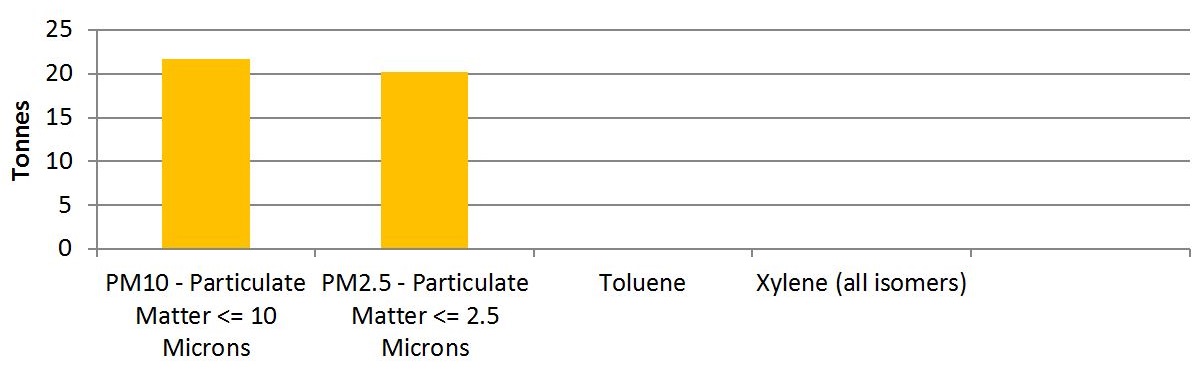
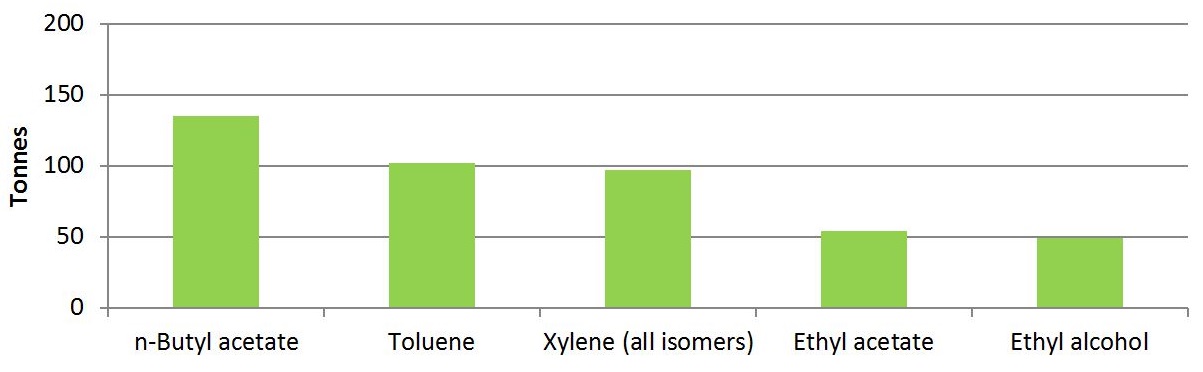
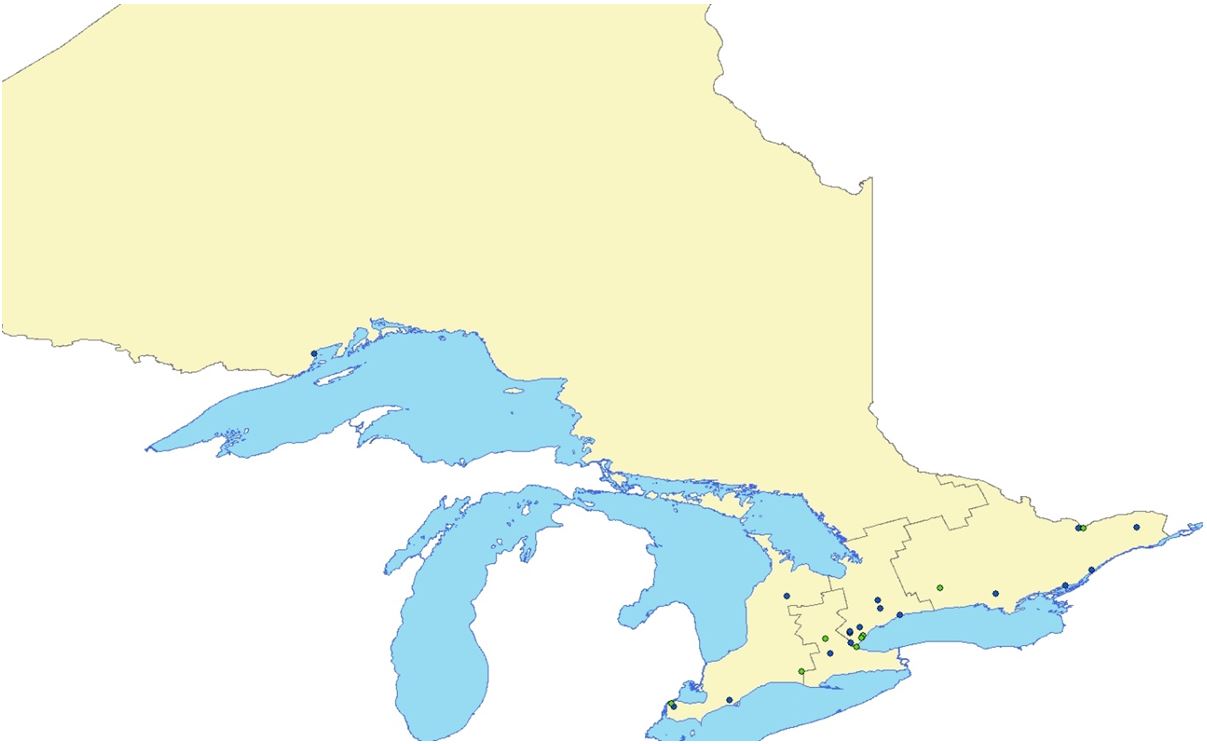
Number of facilities in 2015: 20
Range in number of substances reported in 2015: 2-35
Percent of facilities that intend on implementing: 27.3%
| Used | Created | Released | |
|---|---|---|---|
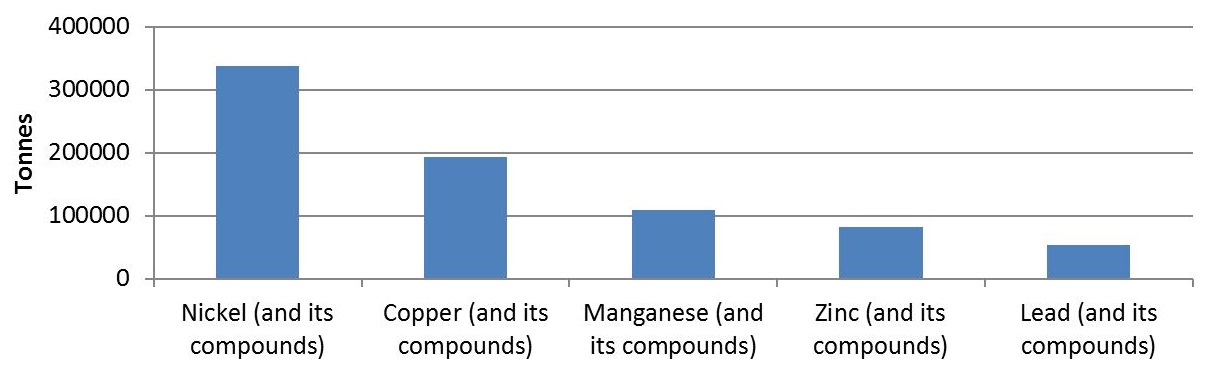
| Total amounts (tonnes) | 488,273 | 16,072 | 13,810 |
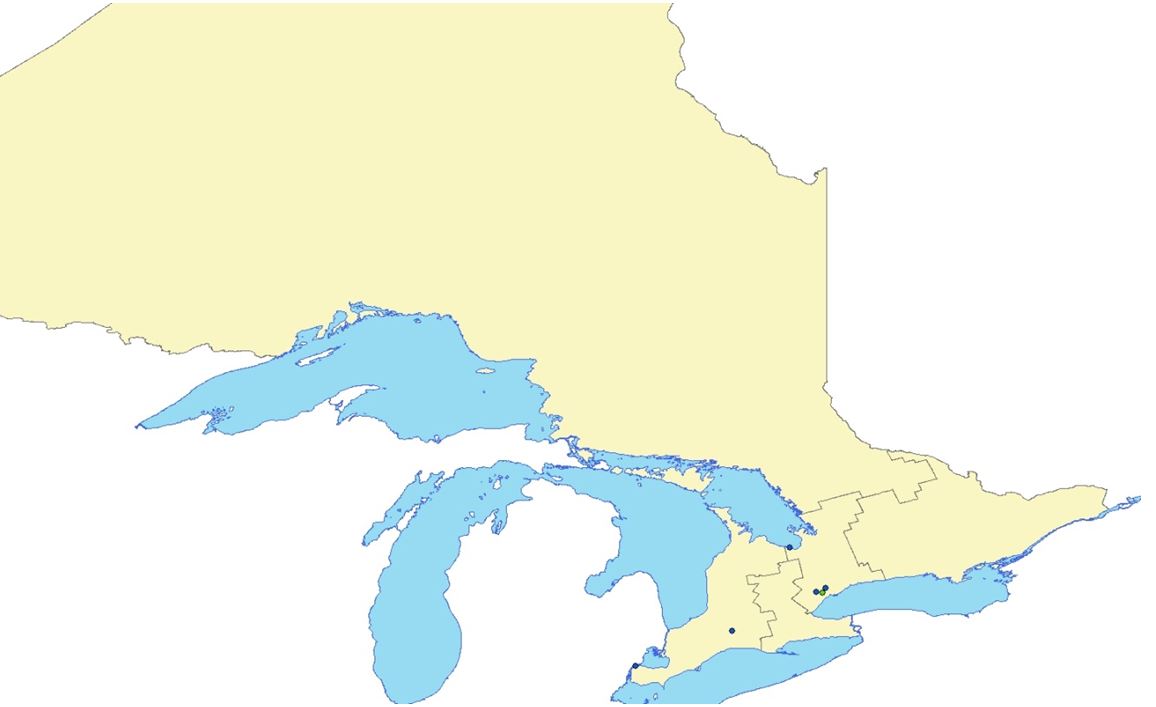
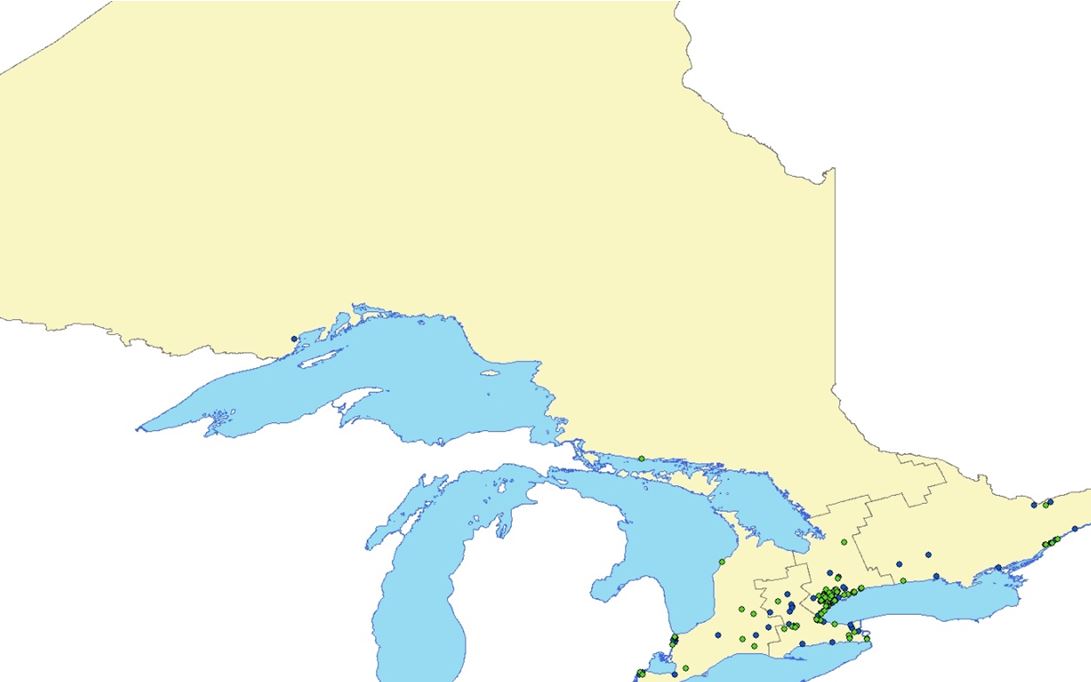
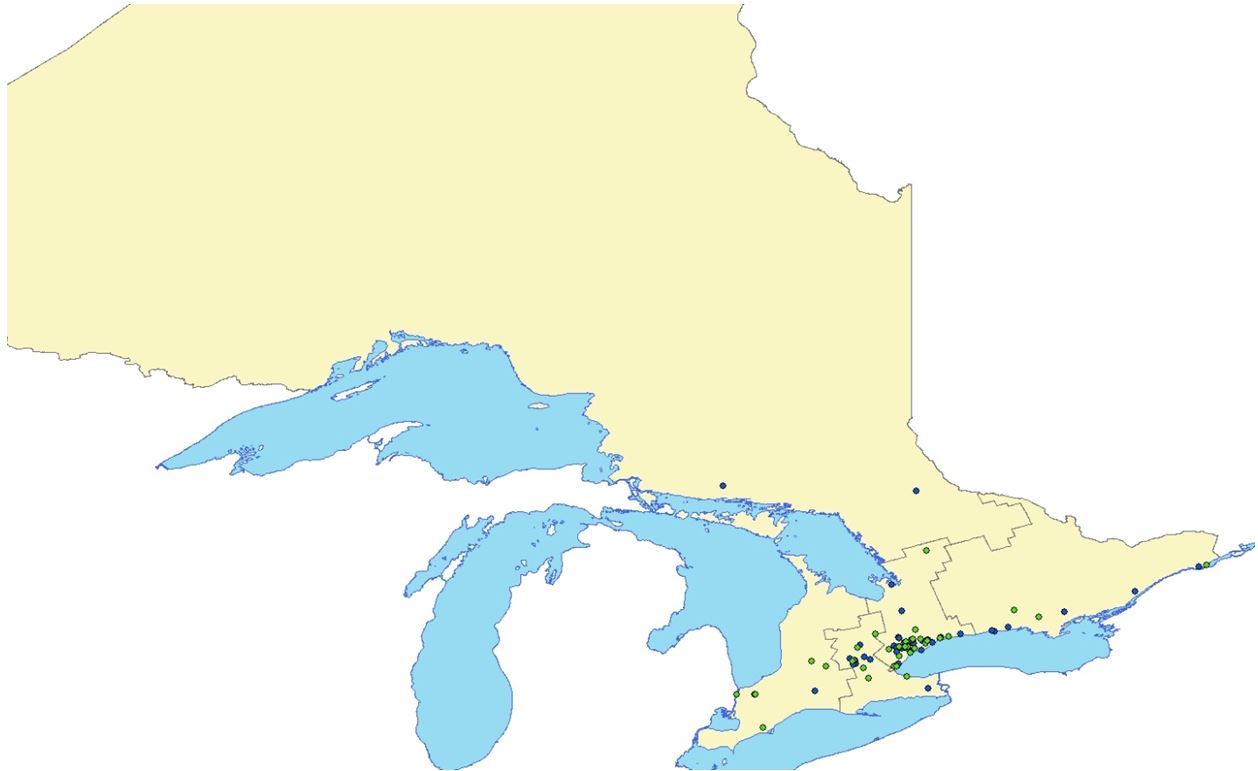
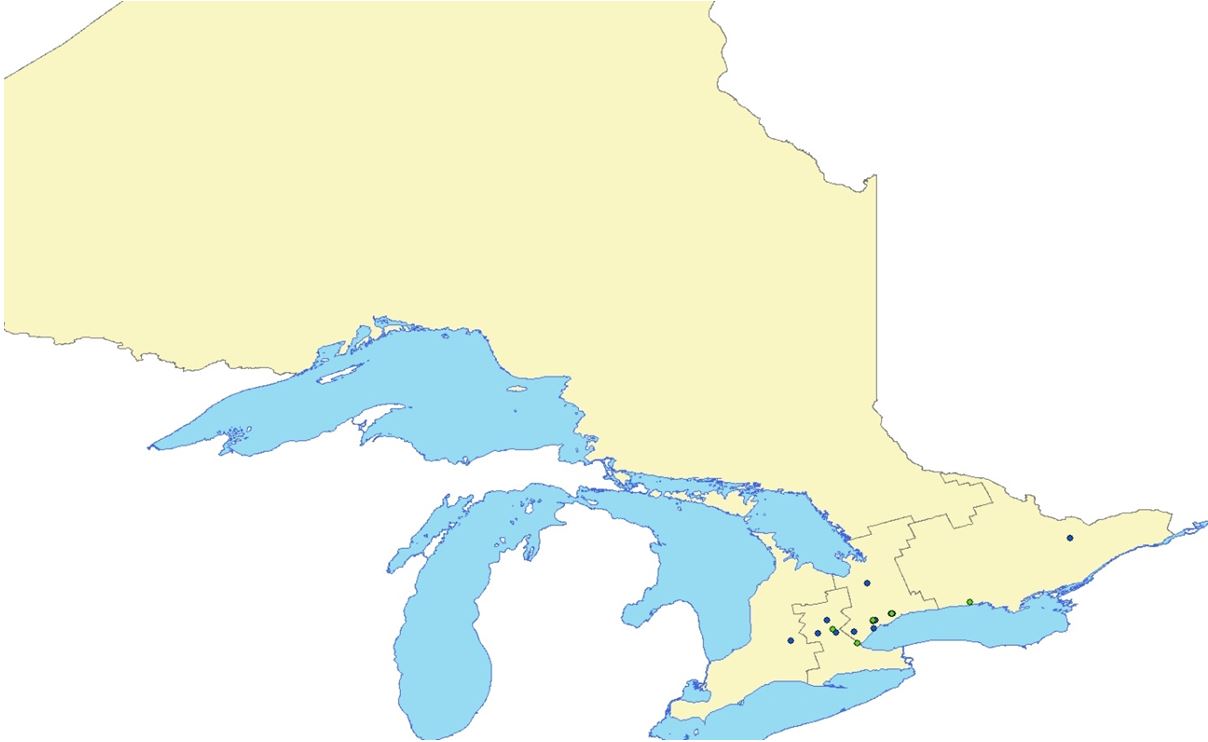
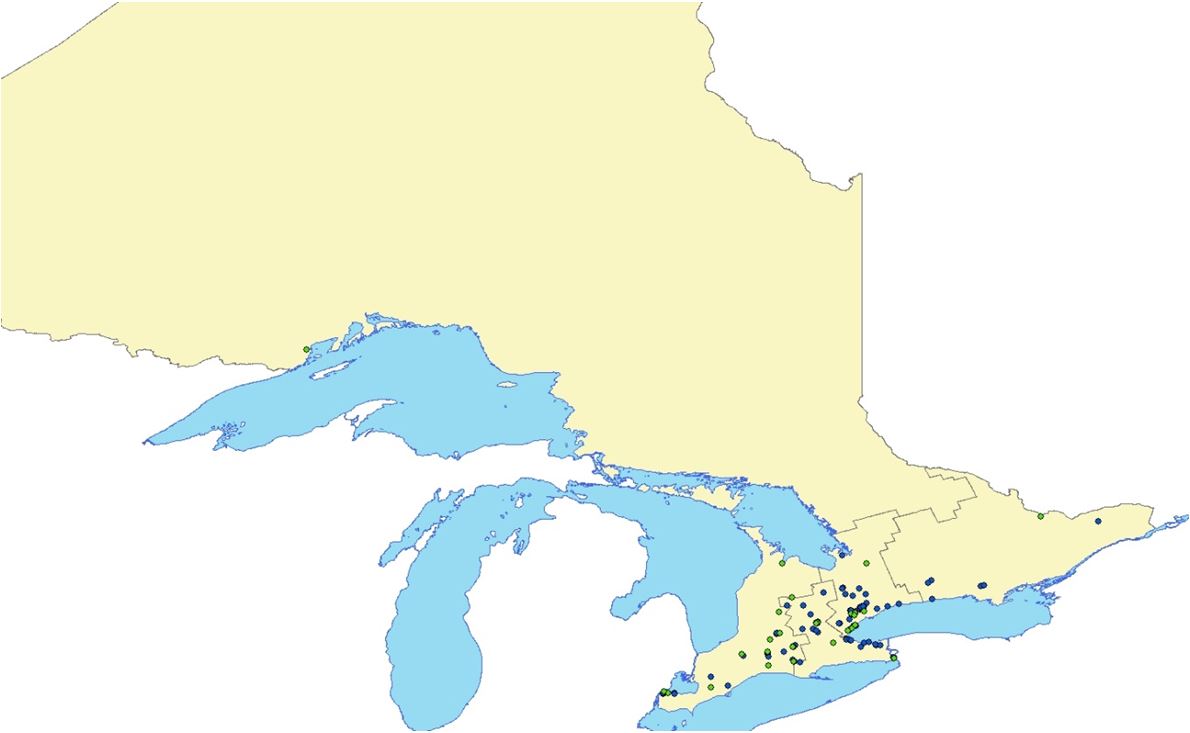
Map: Location of mining and quarrying facilities reporting under the Toxics Reduction Act in 2015

*Green dots indicate facilities that intend on implementing a plan to reduce at least one substance.
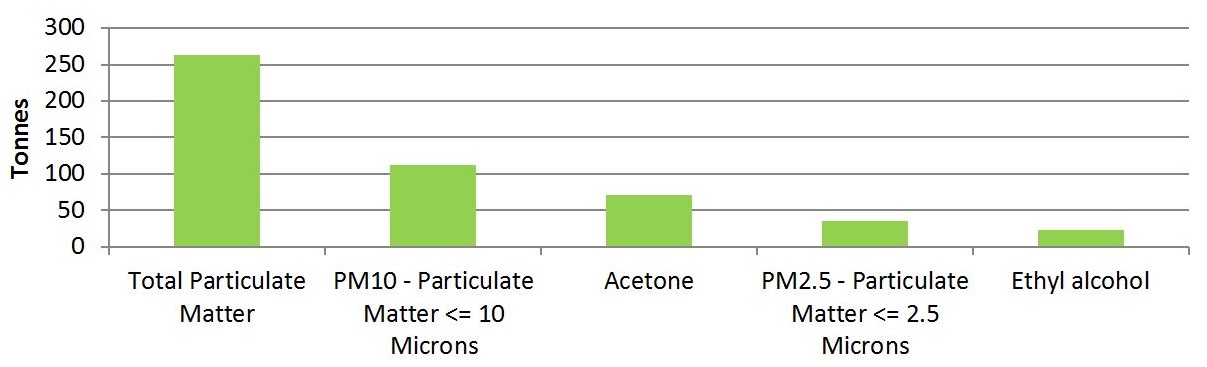
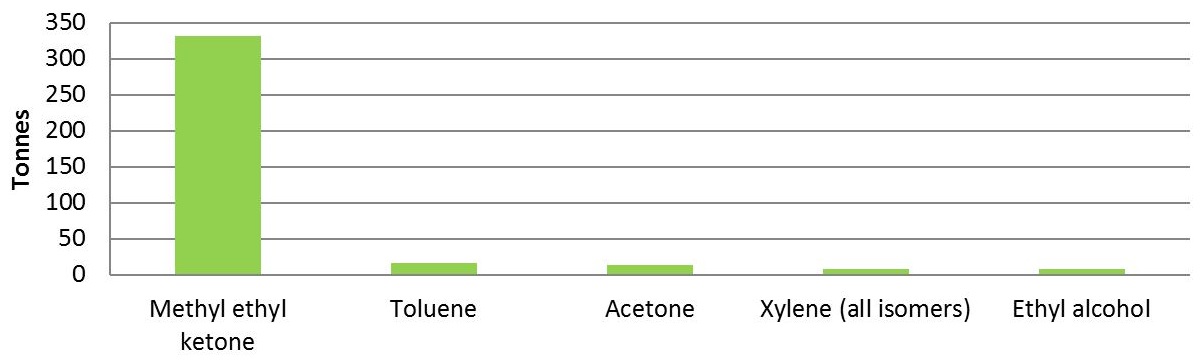
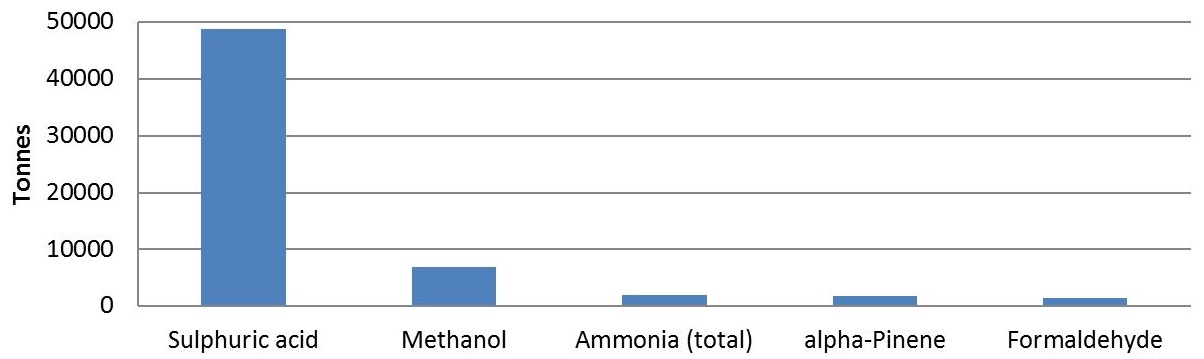
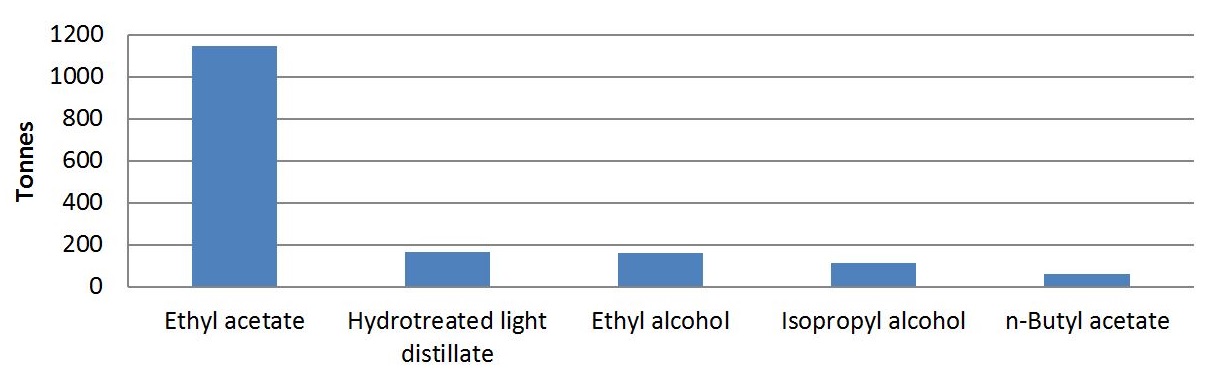
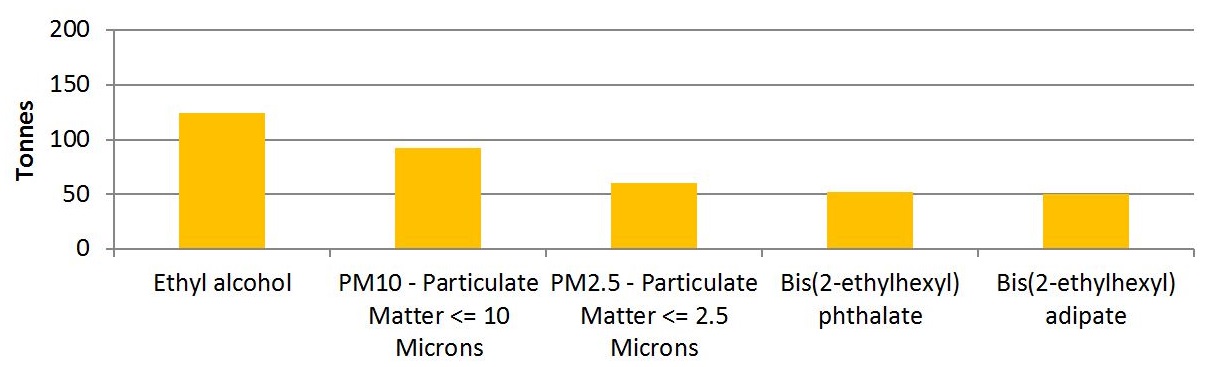
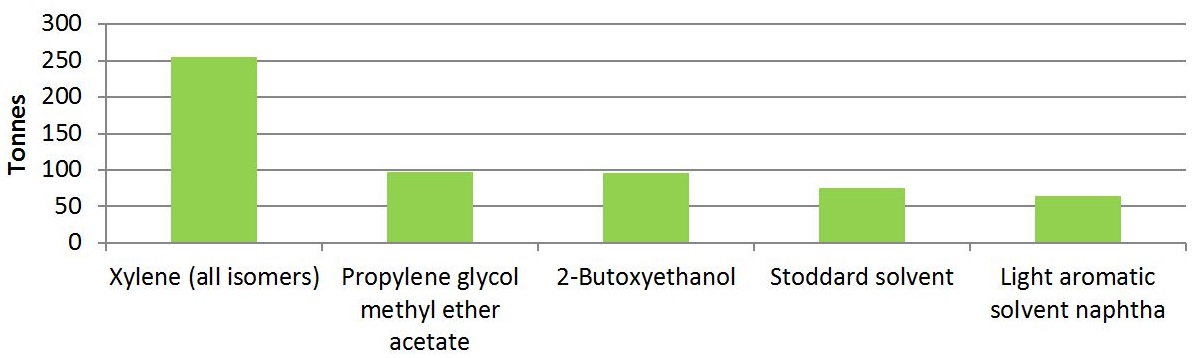
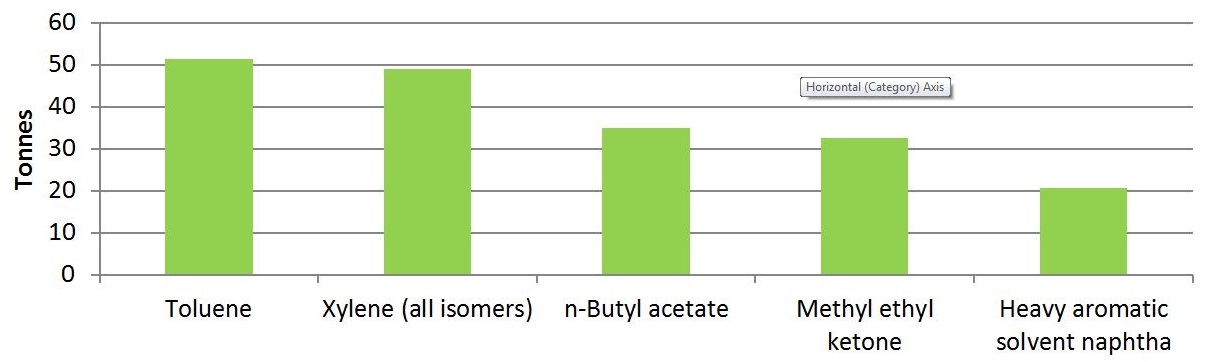
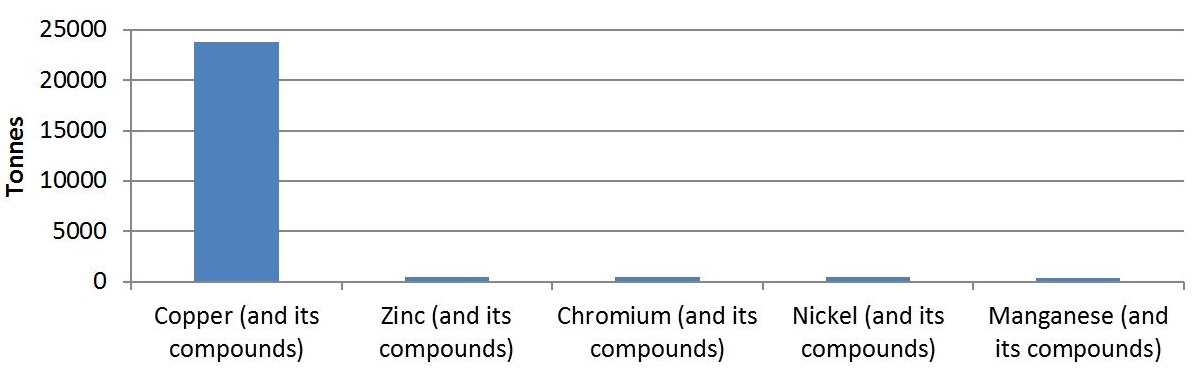
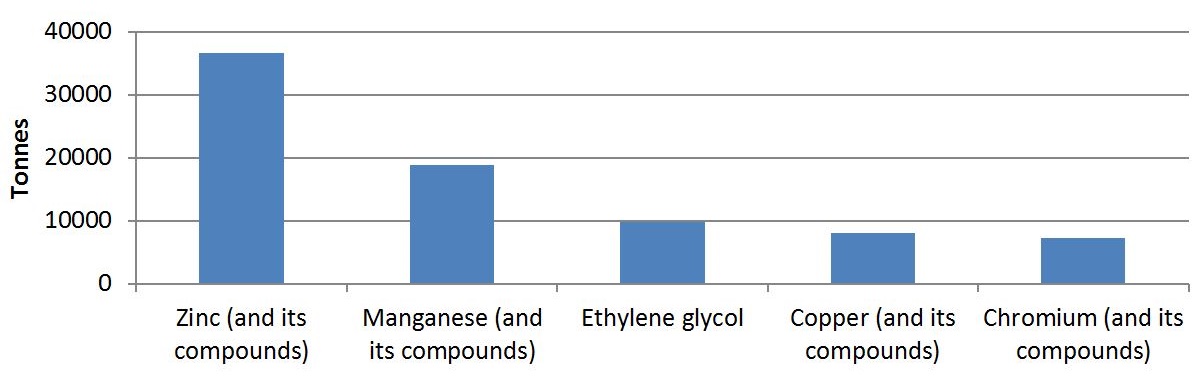
Top substances, by weight, used in 2015
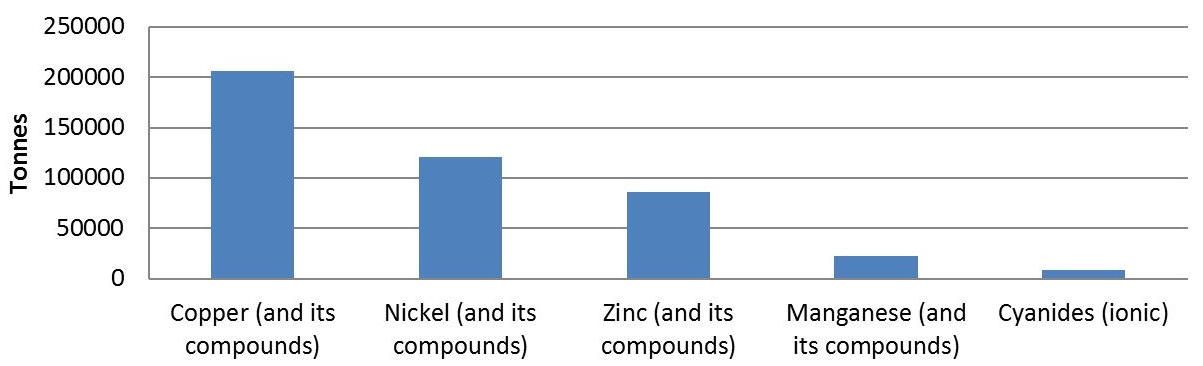
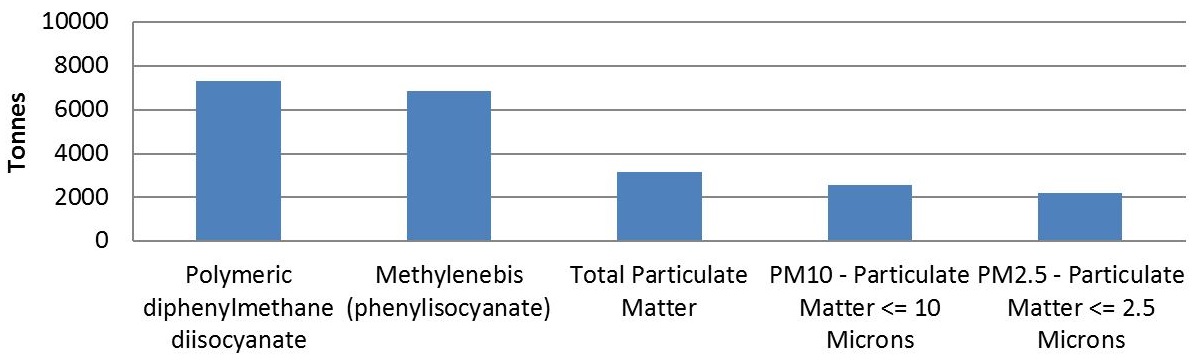
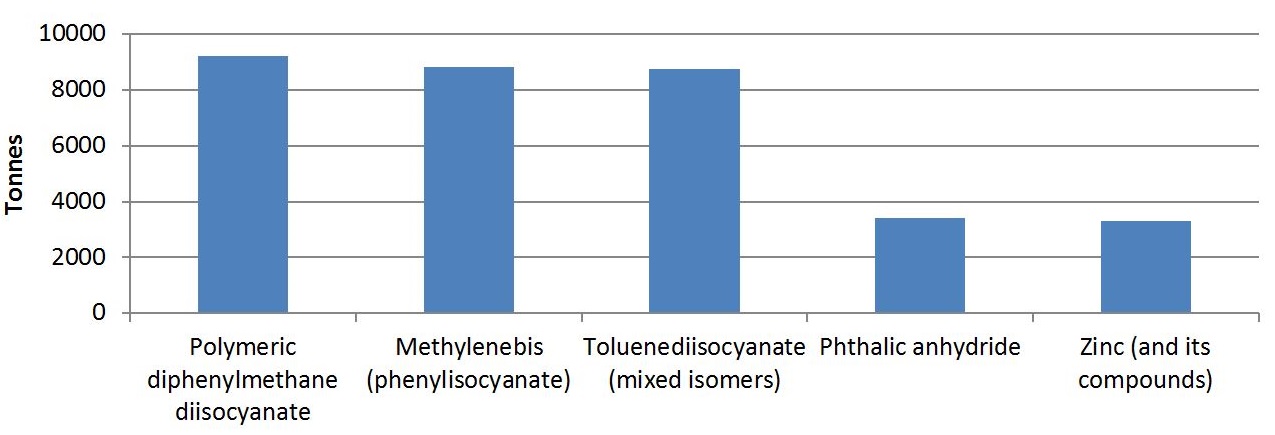
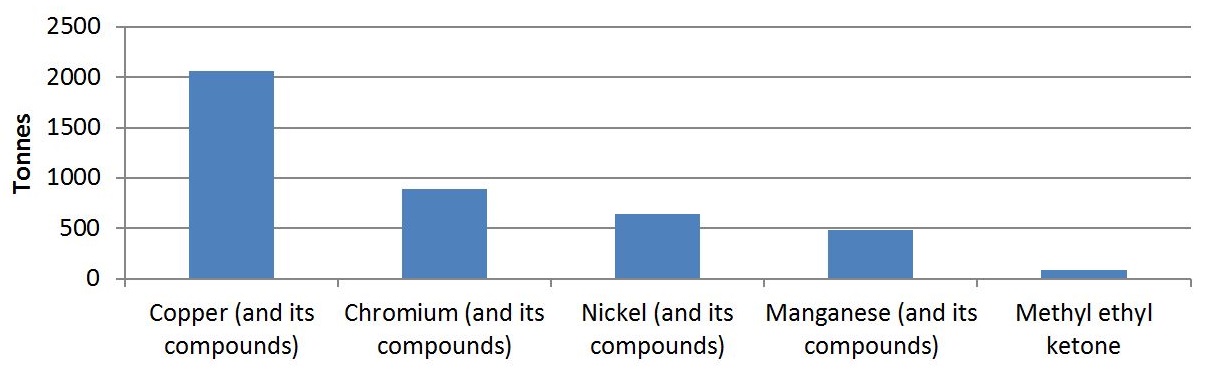
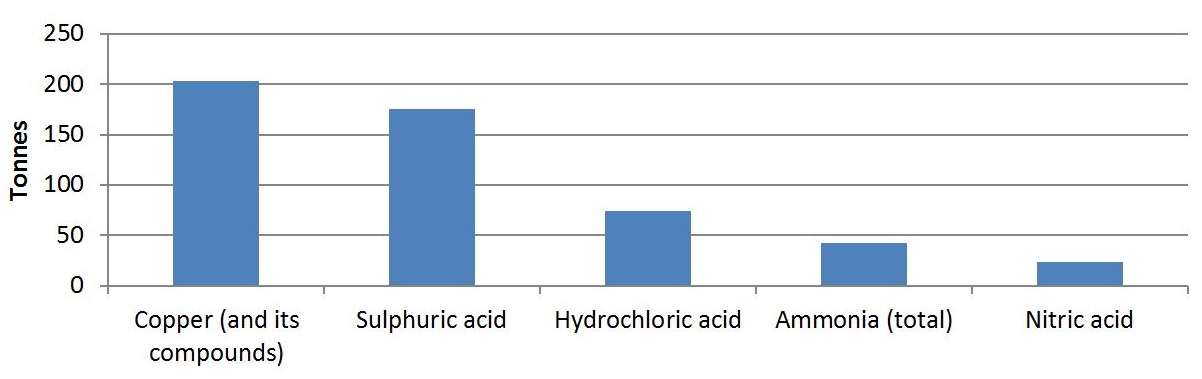
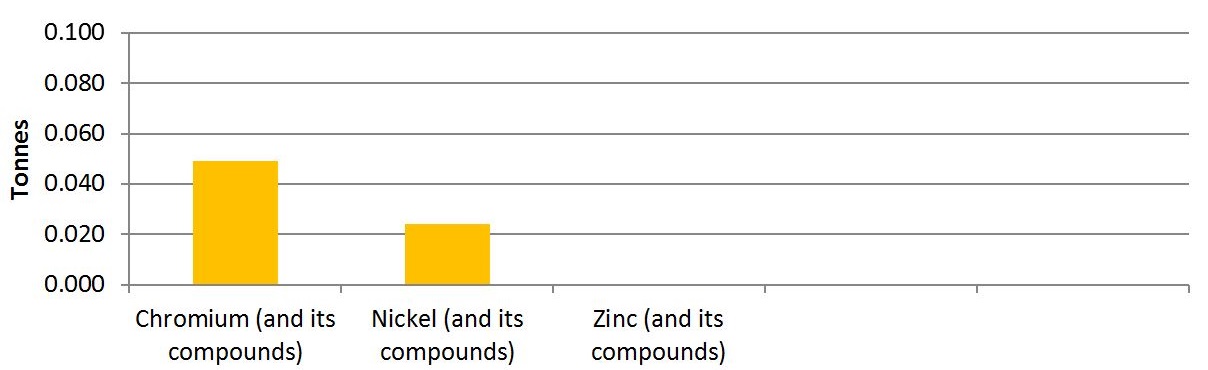
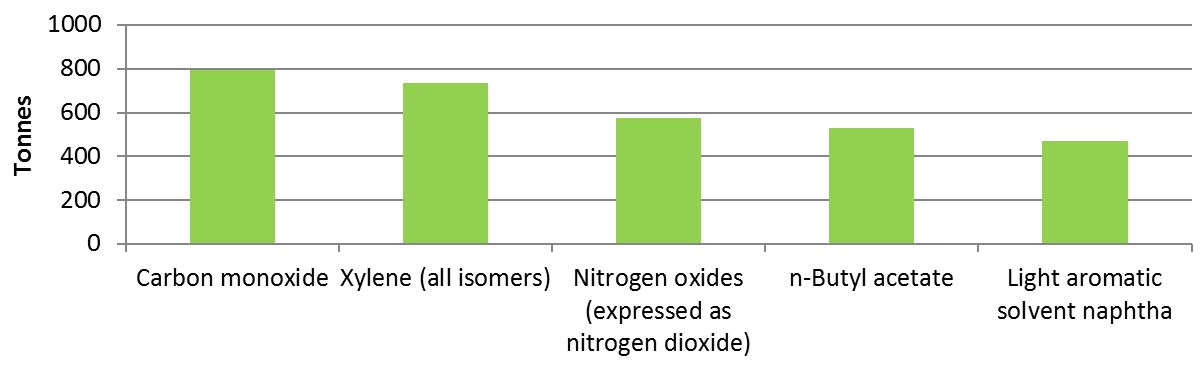
Top substances, by weight, created in 2015
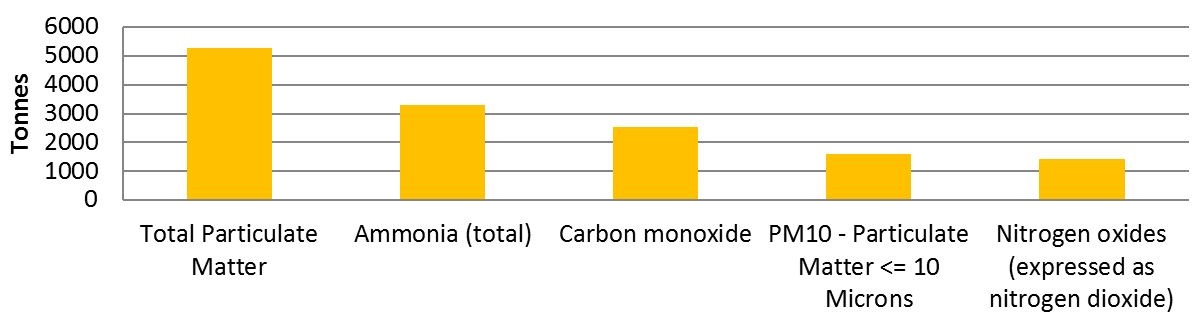
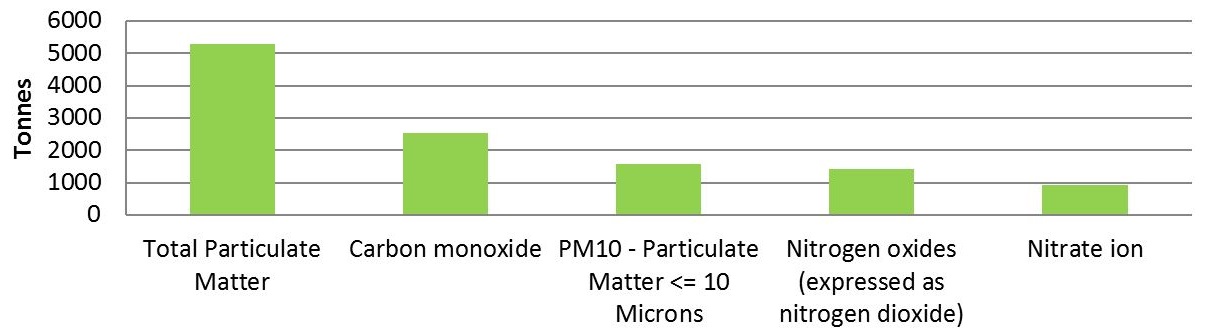
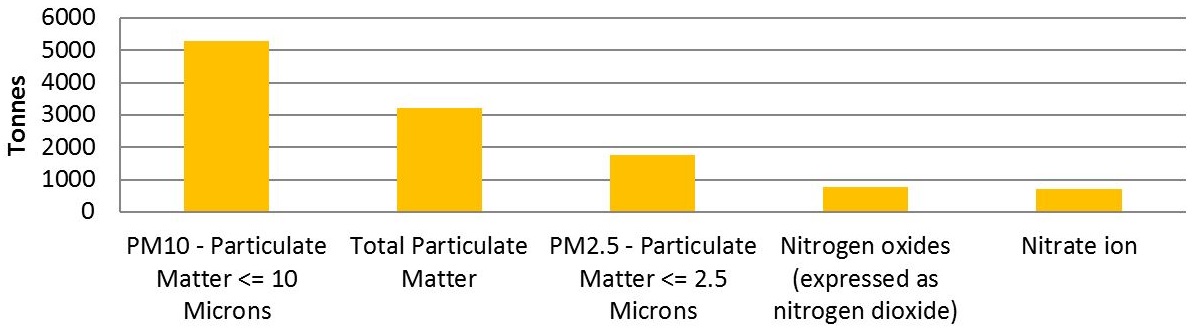
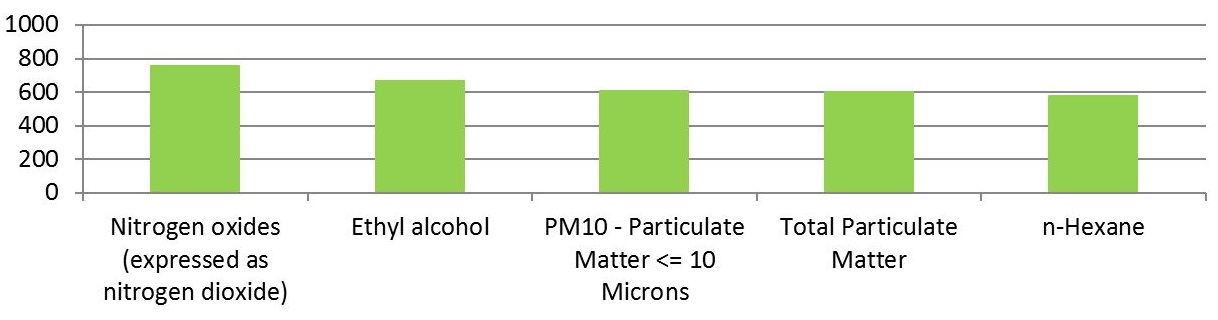
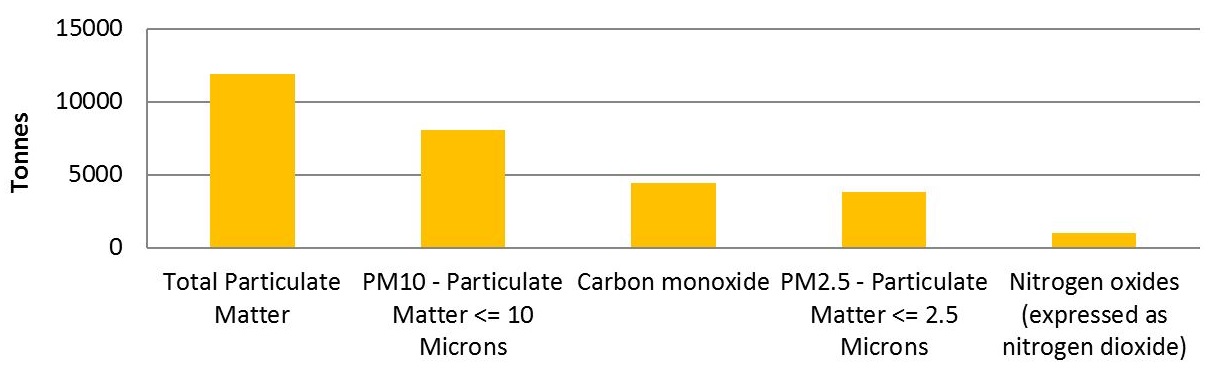
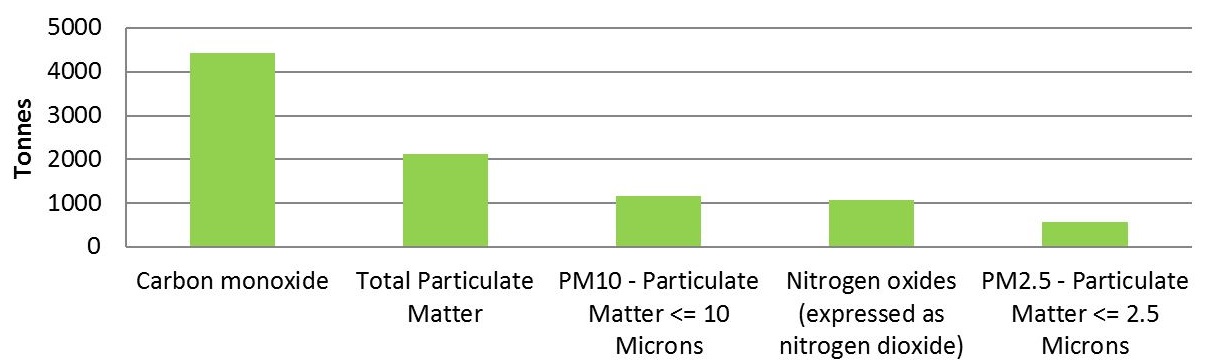
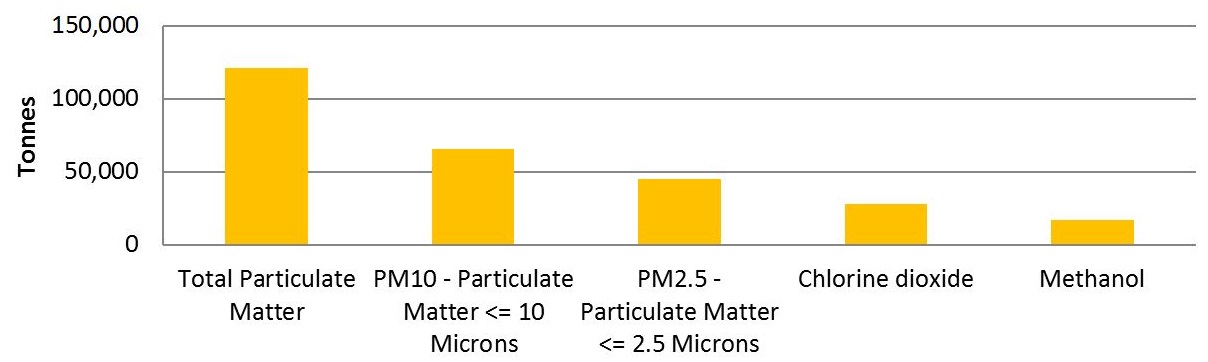
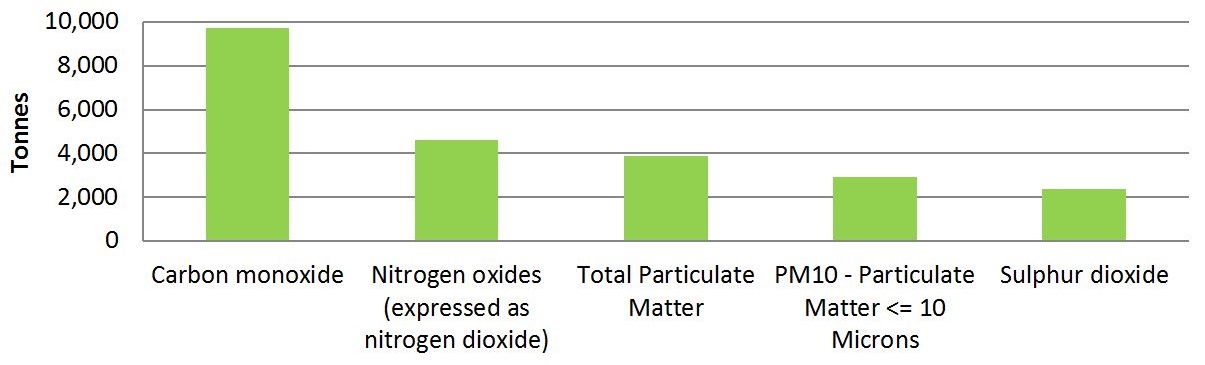
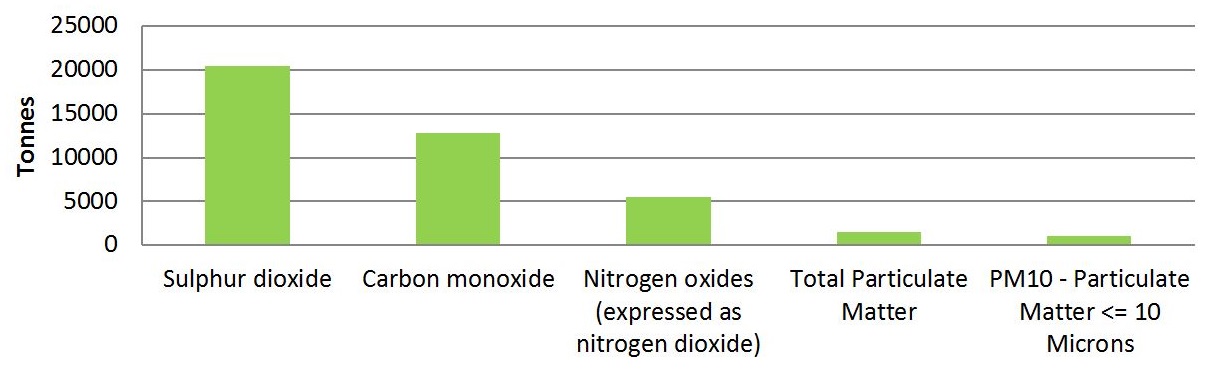
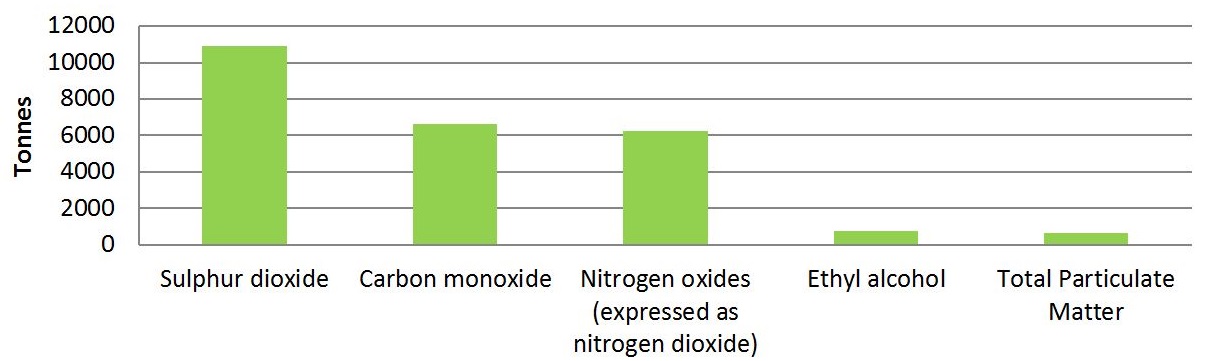
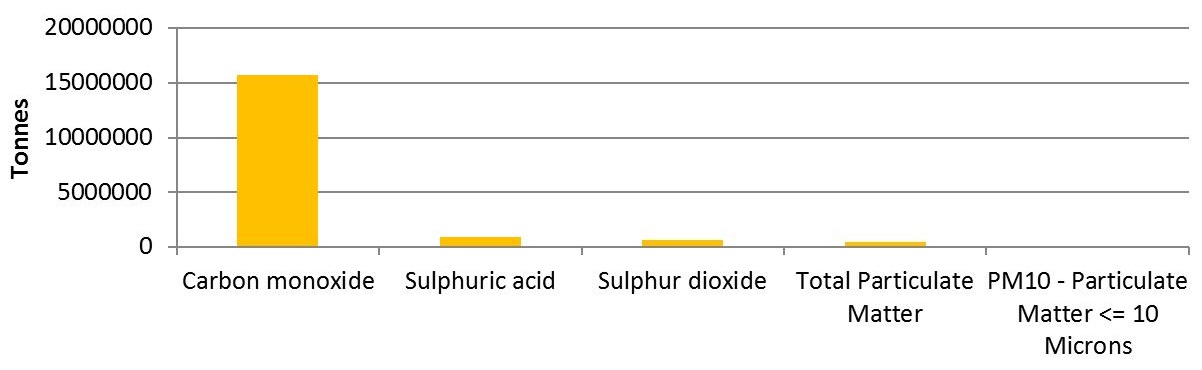
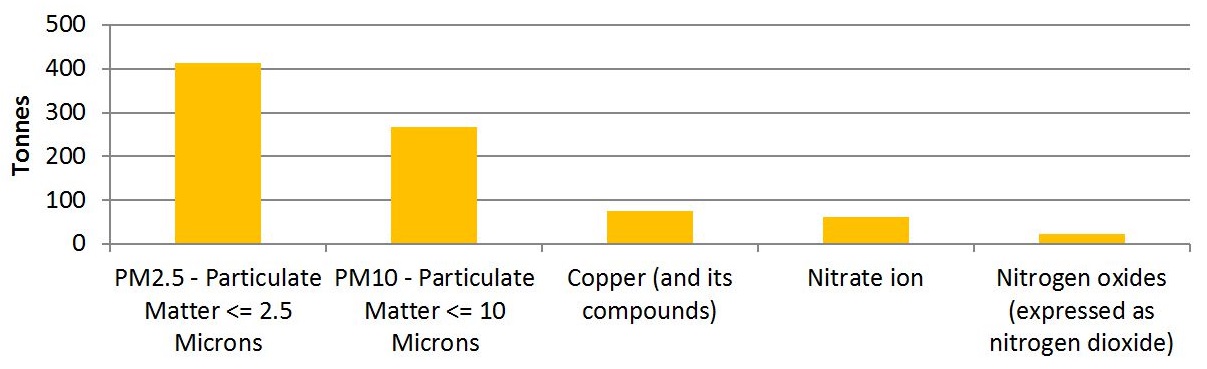
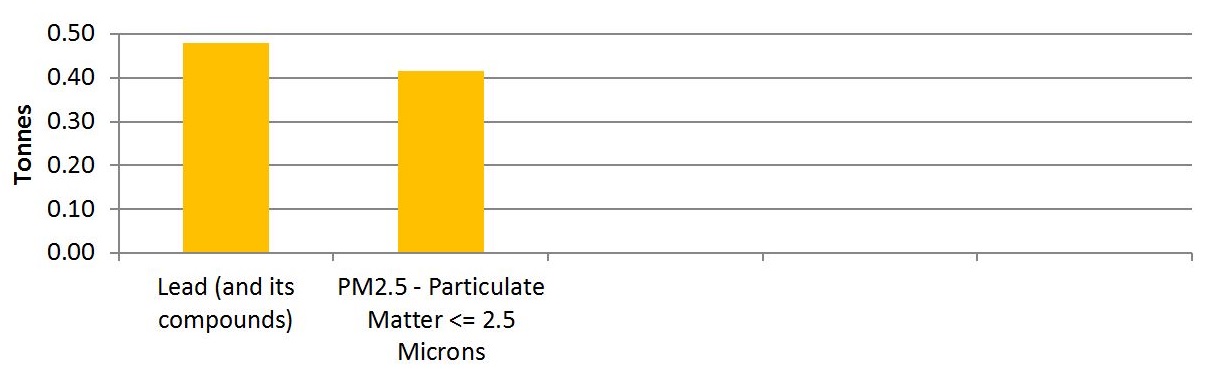
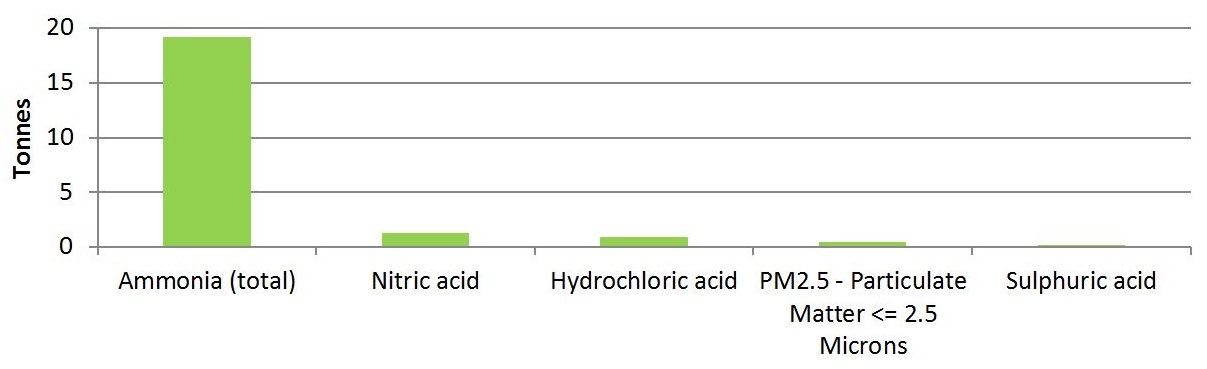
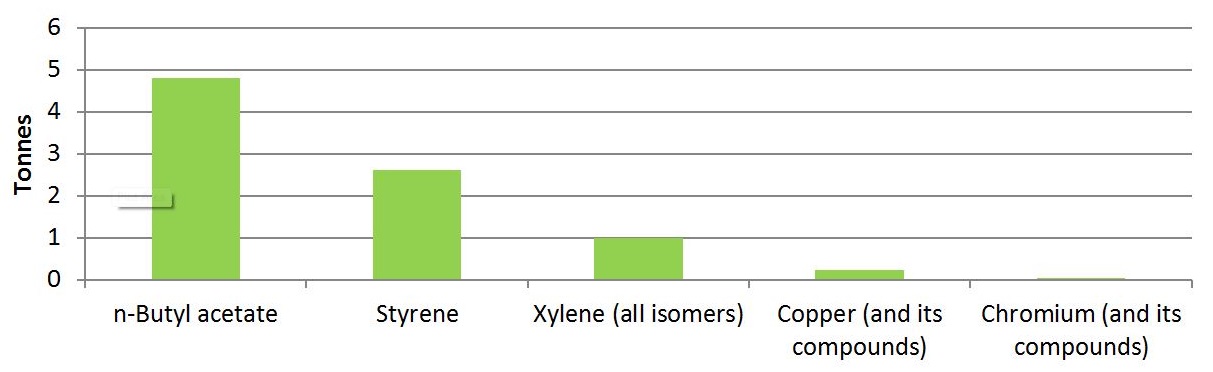
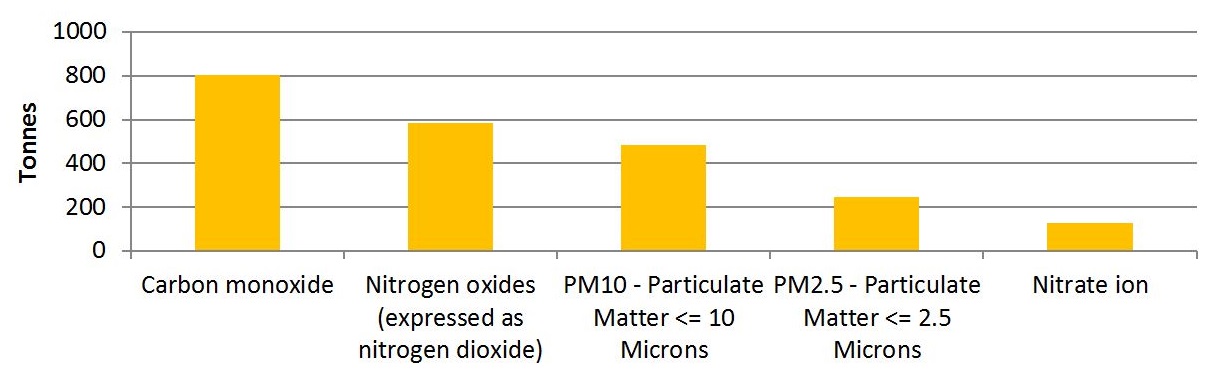
Top substances, by weight, released to air, land and water in 2015
Food manufacturing – NAICS 311
This subsector primarily produces food for human or animal consumption. It does not include beverage manufacturing.
Number of facilities in 2015: 102
Range in number of substances reported in 2015: 1-12
Percent of facilities that intend on implementing: 19.1%
| Used | Created | Released | |
|---|---|---|---|
| Total amounts (tonnes) | 81,901 | 13,659 | 4,878 |
Map: Location of food manufacturing facilities reporting under the Toxics Reduction Act in 2015

*Green dots indicate facilities that intend on implementing a plan to reduce at least one substance.
Top substances, by weight, used in 2015
Top substances, by weight, created in 2015
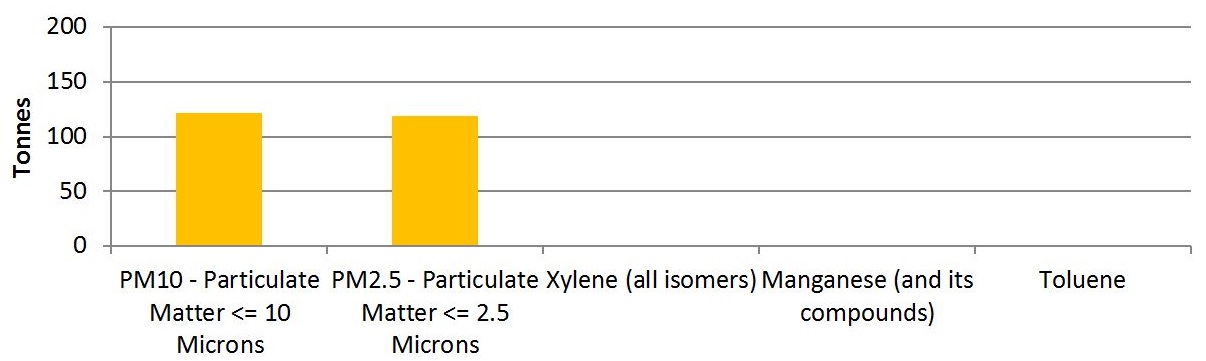
Top substances, by weight, released to air, land and water in 2015
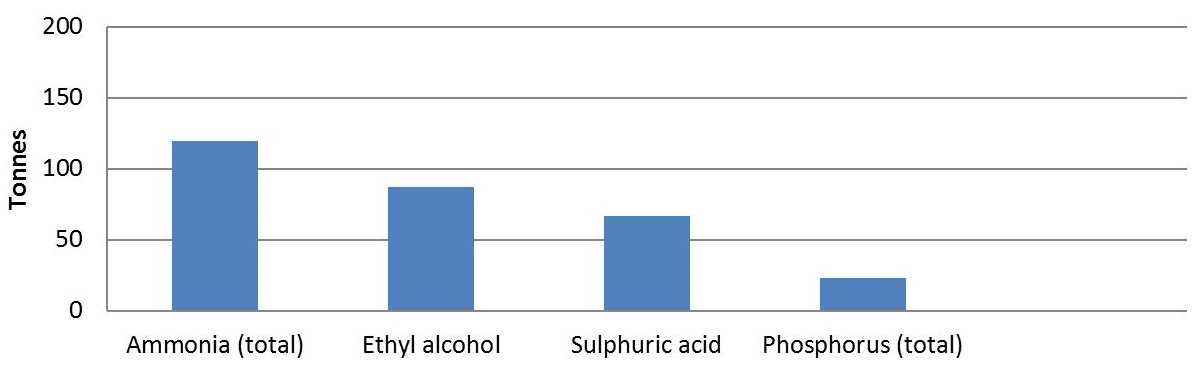
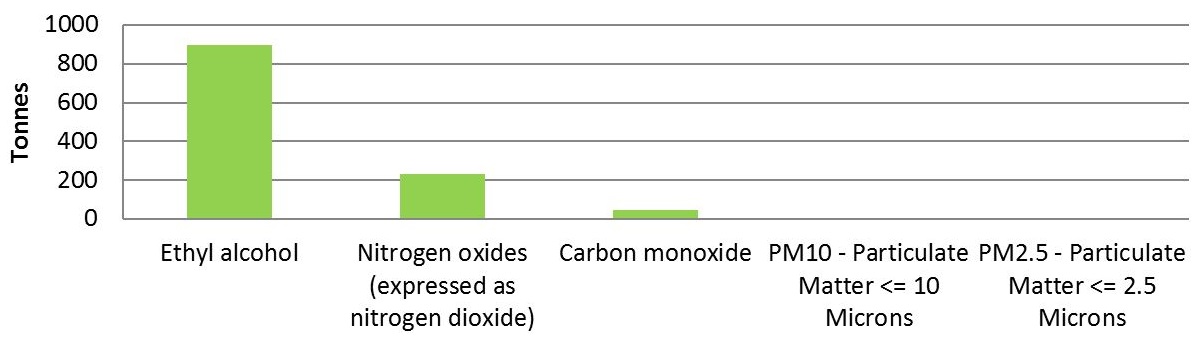
Beverage and tobacco product manufacturing – NAICS 312
Industries in this subsector primarily engage in manufacturing beverages (including nonalcoholic and alcoholic beverages) and tobacco products.
Number of facilities in 2015: 6
Range in number of substances reported in 2015: 1-7
Percent of facilities that intend on implementing: 33.3%
| Used | Created | Released | |
|---|---|---|---|
| Total amounts (tonnes) | 298 | 27,501 | 1,185 |
Map: Location of beverage and tobacco product manufacturing facilities reporting under the Toxics Reduction Act in 2015
*Green dots indicate facilities that intend on implementing a plan to reduce at least one substance.
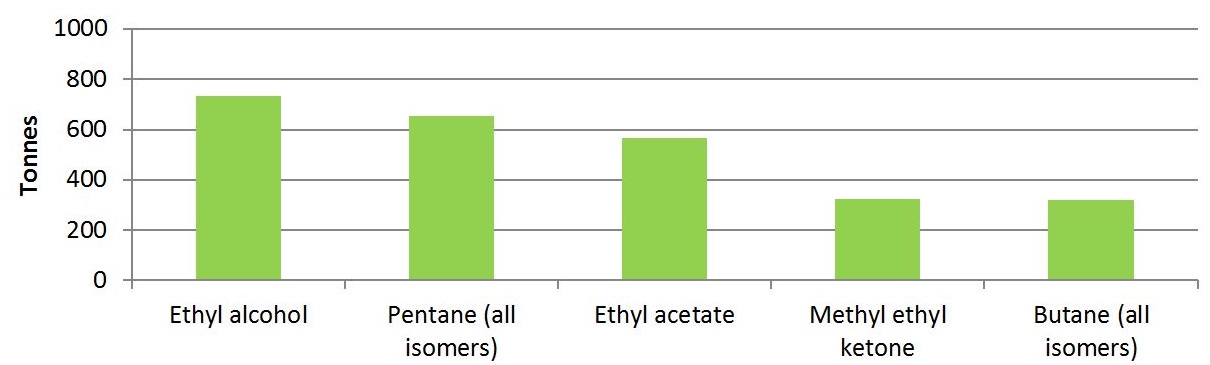
Top substances, by weight, used in 2015
Top substances, by weight, created in 2015

Top substances, by weight, released to air, land and water in 2015
Textile mills – NAICS 313
This subsector primarily transforms natural or synthetic fibres into products such as yarn or fabric. Textile mills exclude establishments that manufacture textile products or clothing.
Number of facilities in 2015: 6
Range in number of substances reported in 2015: 1-12
Percent of facilities that intend on implementing: 83.3%
| Used | Created | Released | |
|---|---|---|---|
| Total amounts (tonnes) | 1,328 | 0.374 | 392 |
Map: Location of textile mills reporting under the Toxics Reduction Act in 2015

*Green dots indicate facilities that intend on implementing a plan to reduce at least one substance.
Top substances, by weight, used in 2015
Top substances, by weight, created in 2015
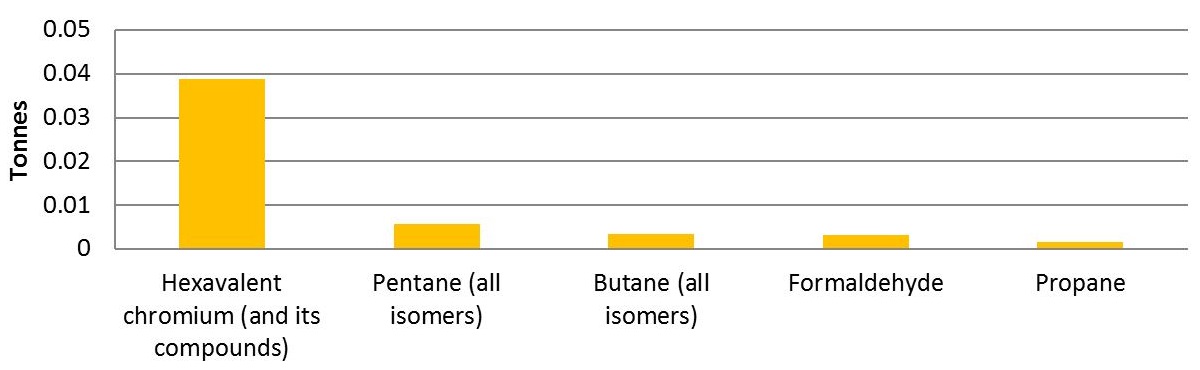
Top substances, by weight, released to air, land and water in 2015
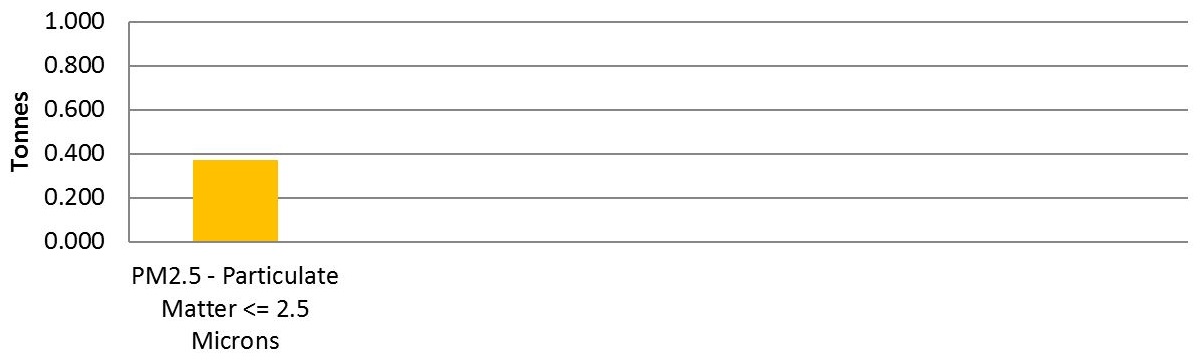
Textile product mills – NAICS 314
This subsector primarily transforms natural or synthetic fibres into products such as yarn or fabric. Textile mills exclude establishments that manufacture textile products or clothing.
Number of facilities in 2015: 6
Range in number of substances reported in 2015: 1-12
Percent of facilities that intend on implementing: 83.3%
| Used | Created | Released | |
|---|---|---|---|
| Total amounts (tonnes) | 1,328 | 0.374 | 392 |
Map: Location of textile mills reporting under the Toxics Reduction Act in 2015

*Green dots indicate facilities that intend on implementing a plan to reduce at least one substance.
Top substances, by weight, used in 2015
Antimony (and its compounds) was the only substance reported by this facility for 2015. The total amount used was between 10 and 100 tonnes.
Top substances, by weight, created in 2015
There were no substances reported as “created” for Textile Product Mills
Top substances, by weight, released to air, land and water in 2015
There were no substances reported as "released" for Textile Product Mills (NAICS 313)
Wood product manufacturing – NAICS 321
This subsector primarily engages in three main areas: those that saw logs into lumber and similar products, or preserve those products; those that make products that improve on the natural characteristics of wood, such as making plywood or veneers; and those that make a wide range of wood products, such as millwork. It does not include forestry or logging industries, manufacturing paper, or manufacturing wood cabinets, signs or coffins.
Number of facilities in 2015: 33
Range in number of substances reported in 2015: 1-76
Percent of facilities that intend on implementing: 51.6%
| Used | Created | Released | |
|---|---|---|---|
| Total amounts (tonnes) | 24,232 | 30,455 | 10,687 |
Map: Location of wood product manufacturing facilities reporting under the Toxics Reduction Act in 2015

*Green dots indicate facilities that intend on implementing a plan to reduce at least one substance.
Top substances, by weight, used in 2015
Top substances, by weight, created in 2015
Top substances, by weight, released to air, land and water in 2015
Paper manufacturing – NAICS 322
Industries in this subsector manufacture pulp, paper, and paper products.
Number of facilities in 2015: 25
Range in number of substances reported in 2015: 1-58
Percent of facilities that intend on implementing: 48.3%
| Used | Created | Released | |
|---|---|---|---|
| Total amounts (tonnes) | 64,060 | 299,993 | 299,993 |
Map: Location of paper manufacturing facilities reporting under the Toxics Reduction Act in 2015

*Green dots indicate facilities that intend on implementing a plan to reduce at least one substance.
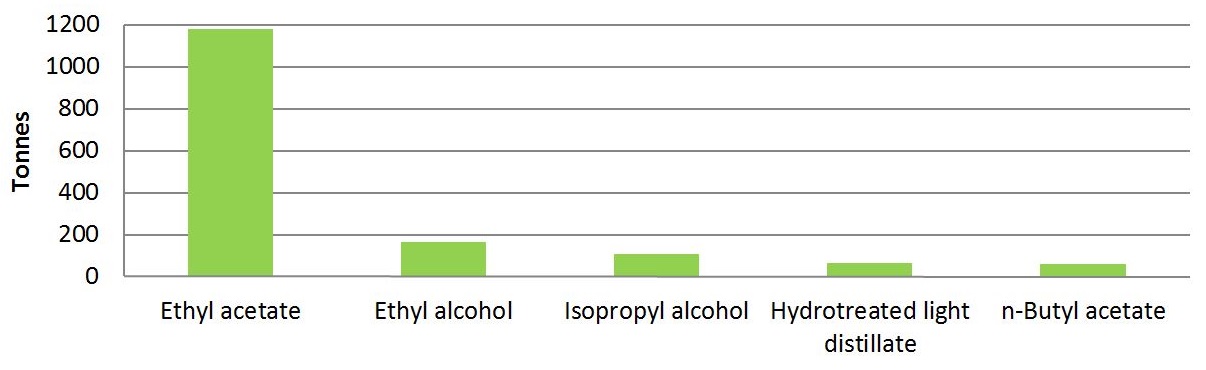
Top substances, by weight, used in 2015
Top substances, by weight, created in 2015
Top substances, by weight, released to air, land and water in 2015
<
Printing and related support activities – NAICS 323
This subsector primarily engages in printing products (such as newspapers, books, and labels) and provides related support activities such as bookbinding and data imaging.
Number of facilities in 2015: 29
Range in number of substances reported in 2015: 1-16
Percent of facilities that intend on implementing: 54.1%
| Used | Created | Released | |
|---|---|---|---|
| Total amounts (tonnes) | 2,018 | 0.056 | 1,793 |
Map: Location of printing and related support activities facilities reporting under the Toxics Reduction Act in 2015

*Green dots indicate facilities that intend on implementing a plan to reduce at least one substance.
Top substances, by weight, used in 2015
Top substances, by weight, created in 2015
Top substances, by weight, released to air, land and water in 2015
Petroleum and coal product manufacturing – NAICS 324
Industries in this subsector transform crude petroleum and coal into intermediate and usable end products. This is primarily done through petroleum refining that separates crude petroleum into component products. This subsector excludes manufacturing chemicals from refined petroleum and coal products.
Number of facilities in 2015: 19
Range in number of substances reported in 2015: 1-77
Percent of facilities that intend on implementing: 33.3%
| Used | Created | Released | |
|---|---|---|---|
| Total amounts (tonnes) | 4,230,732 | 5,378,502 | 43,989 |
Map: Location of petroleum and coal product manufacturing facilities reporting under the Toxics Reduction Act in 2015

*Green dots indicate facilities that intend on implementing a plan to reduce at least one substance.
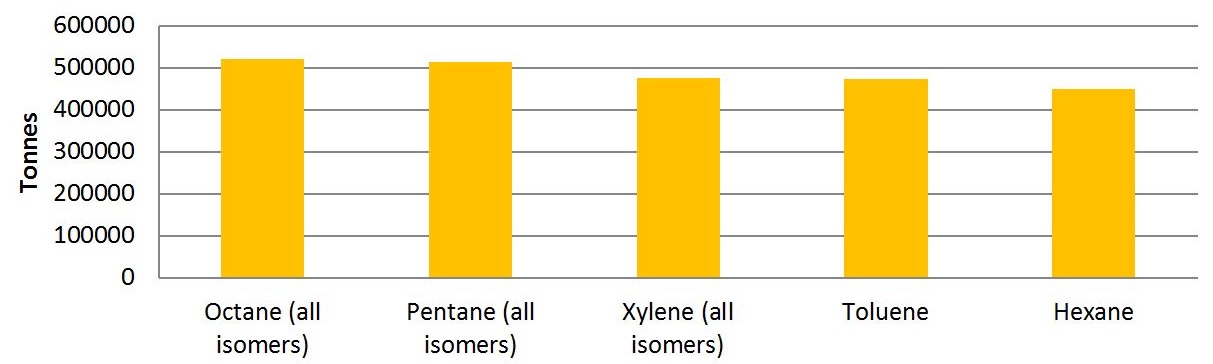
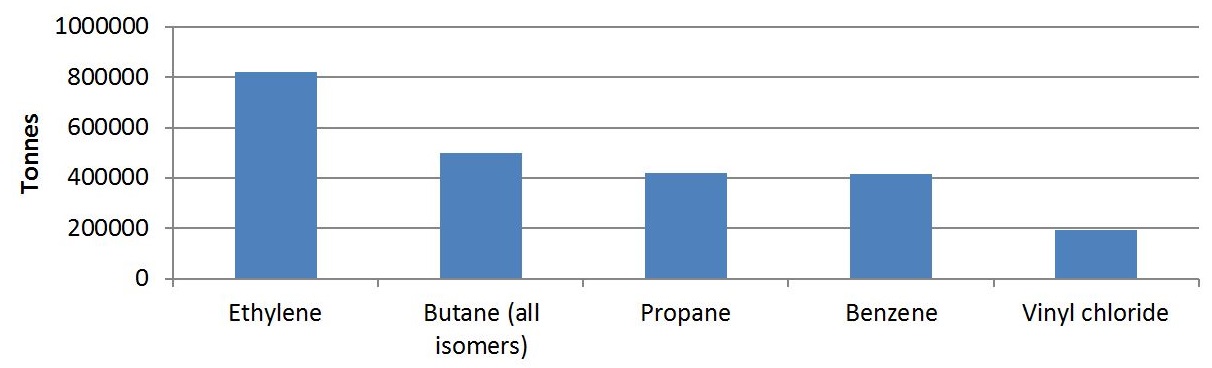
Top substances, by weight, used in 2015
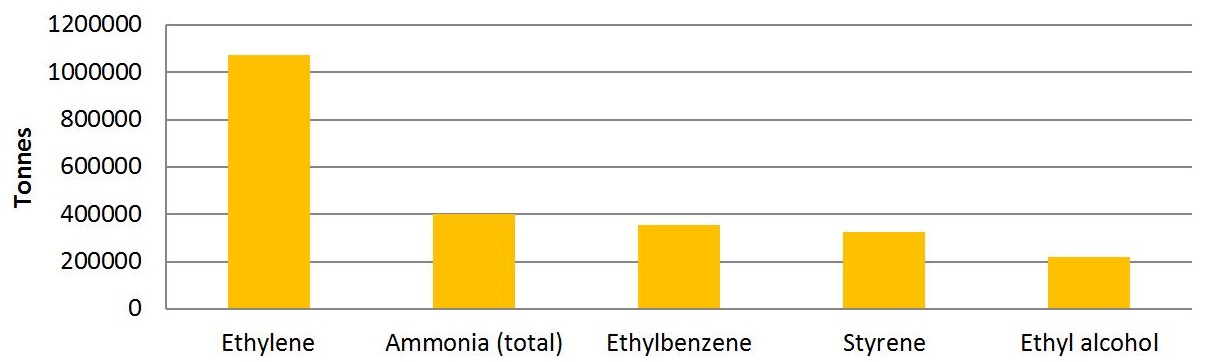
Top substances, by weight, created in 2015
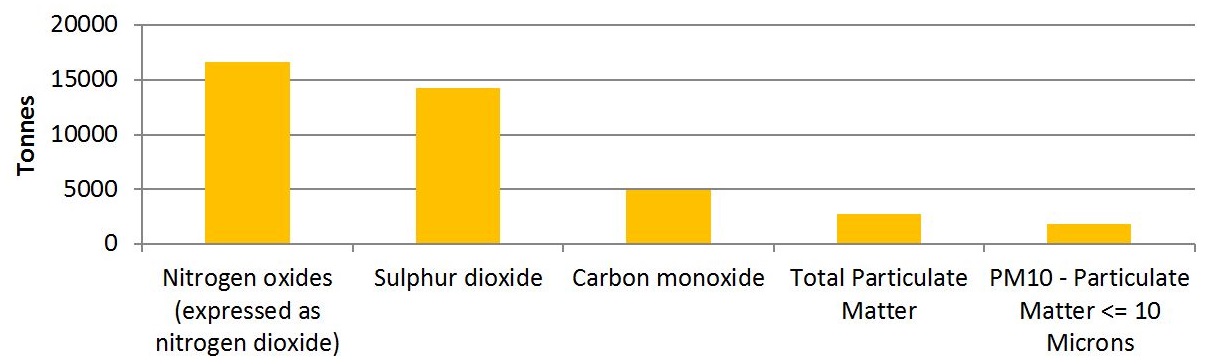
Top substances, by weight, released to air, land and water in 2015
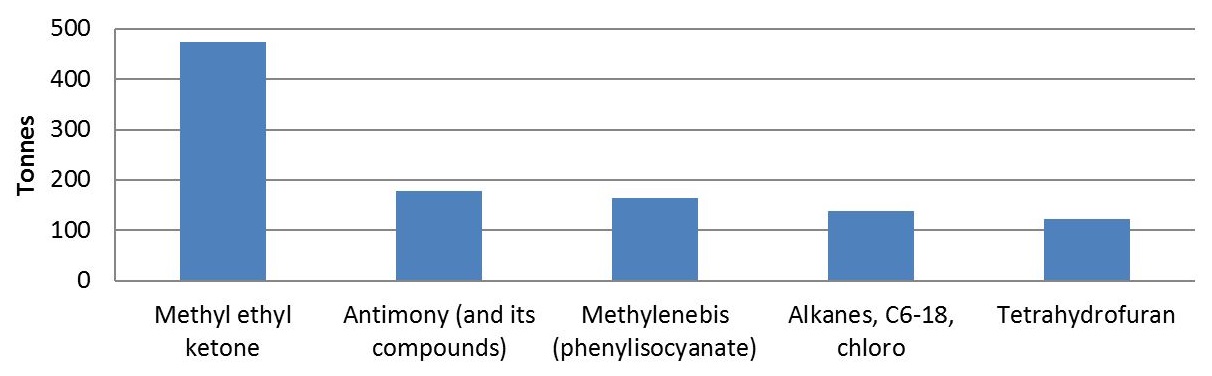
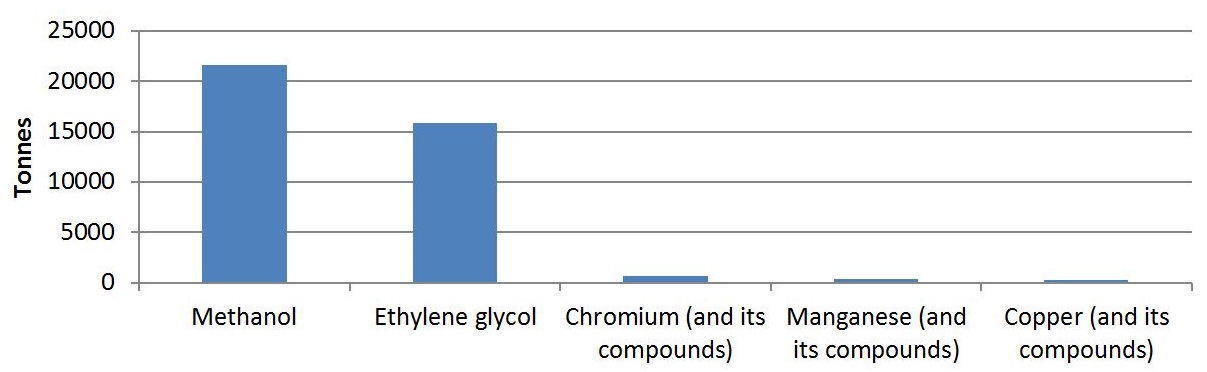
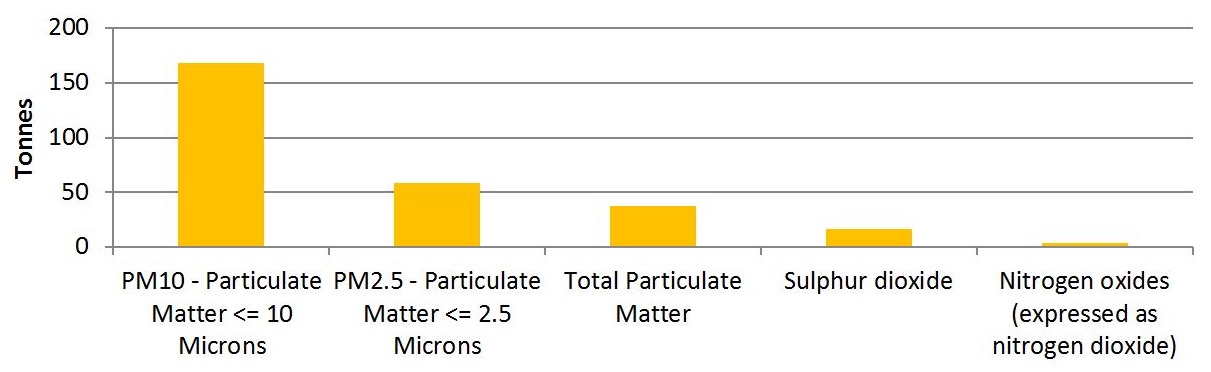
Chemical manufacturing – NAICS 325
This subsector primarily engages in manufacturing chemicals and chemical preparations from organic and inorganic materials. It excludes the processing of crude petroleum and coal, beneficiating mineral ores, and smelting and refining ores.
Number of facilities in 2015: 161
Range in number of substances reported in 2015: 1-80
Percent of facilities that intend on implementing: 47.3%
| Used | Created | Released | |
|---|---|---|---|
| Total amounts (tonnes) | 3,858,973 | 3,242,422 | 31,281 |
Map: Location of chemical manufacturing facilities reporting under the Toxics Reduction Act in 2015
*Green dots indicate facilities that intend on implementing a plan to reduce at least one substance.
Top substances, by weight, used in 2015
Top substances, by weight, created in 2015
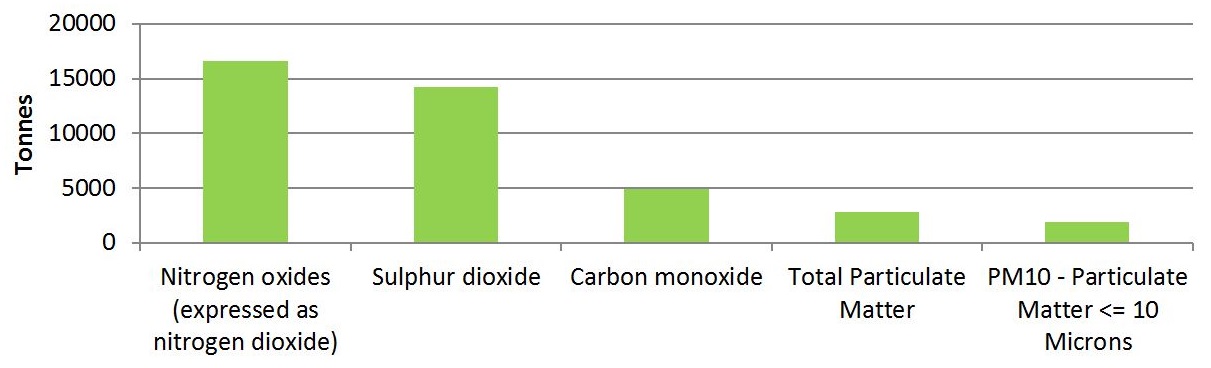
Top substances, by weight, released to air, land and water in 2015
Plastics and rubber products manufacturing – NAICS 326
Industries in this subsector primarily make goods by processing plastics materials and raw rubber.
Number of facilities in 2015: 92
Range in number of substances reported in 2015: 1-13
Percent of facilities that intend on implementing: 41.5%
| Used | Created | Released | |
|---|---|---|---|
| Total amounts (tonnes) | 52,959 | 416 | 3,979 |
Map: Location of plastics and rubber products manufacturing facilities reporting under the Toxics Reduction Act in 2015
*Green dots indicate facilities that intend on implementing a plan to reduce at least one substance.
Top substances, by weight, used in 2015
Top substances, by weight, created in 2015
Top substances, by weight, released to air, land and water in 2015
Non-metallic mineral product manufacturing – NAICS 327
This subsector primarily engages in manufacturing products for intermediate or final consumption, out of non-metallic minerals, such as cutting, shaping and finishing granite, marble or other stones; mixing non-metallic minerals with chemicals; and heating non-metallic mineral products to make such things as bricks, ceramic, cement and glass.
Number of facilities in 2015: 70
Range in number of substances reported in 2015: 1-38
Percent of facilities that intend on implementing: 17.1%
| Used | Created | Released | |
|---|---|---|---|
| Total amounts (tonnes) | 325,467 | 42,028 | 42,360 |
Map: Location of non-metallic mineral product manufacturing facilities reporting under the Toxics Reduction Act in 2015

*Green dots indicate facilities that intend on implementing a plan to reduce at least one substance.
Top substances, by weight, used in 2015
Top substances, by weight, created in 2015
Top substances, by weight, released to air, land and water in 2015
Primary metal manufacturing – NAICS 331
Industries in this subsector primarily smelt and refine metals from ore, pig or scrap and also make metal alloys by introducing chemical elements to metals.
Number of facilities in 2015: 96
Range in number of substances reported in 2015: 1-126
Percent of facilities that intend on implementing: 38.0%
| Used | Created | Released | |
|---|---|---|---|
| Total amounts (tonnes) | 895,474 | 17,892,371 | 240,335 |
Map: Location of primary metal manufacturing facilities reporting under the Toxics Reduction Act in 2015

*Green dots indicate facilities that intend on implementing a plan to reduce at least one substance.
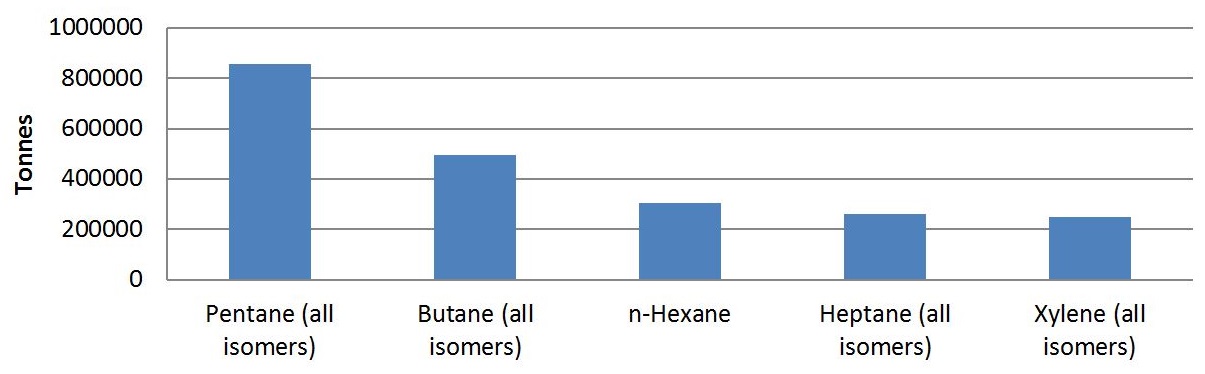
Top substances, by weight, used in 2015
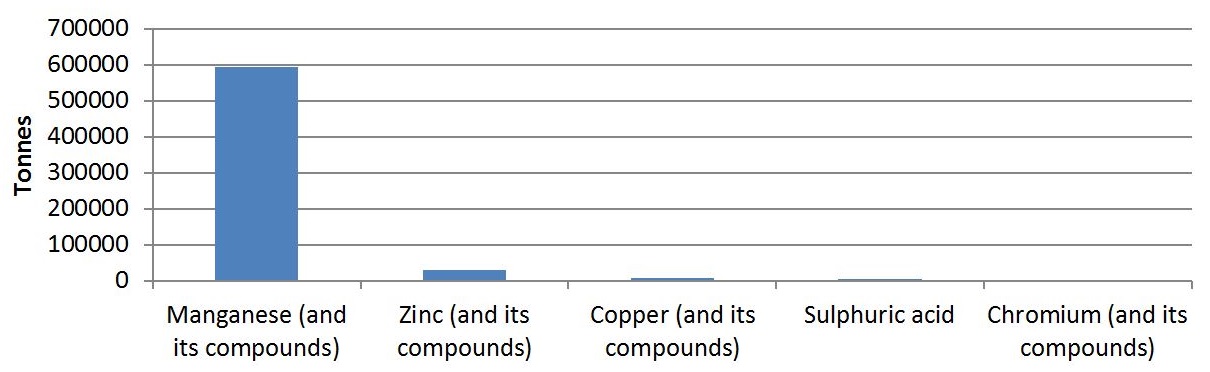
Top substances, by weight, created in 2015
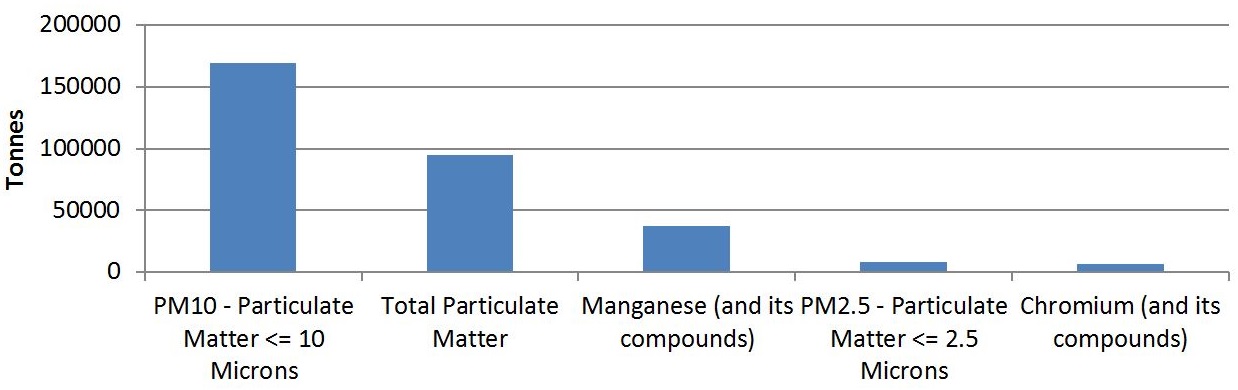
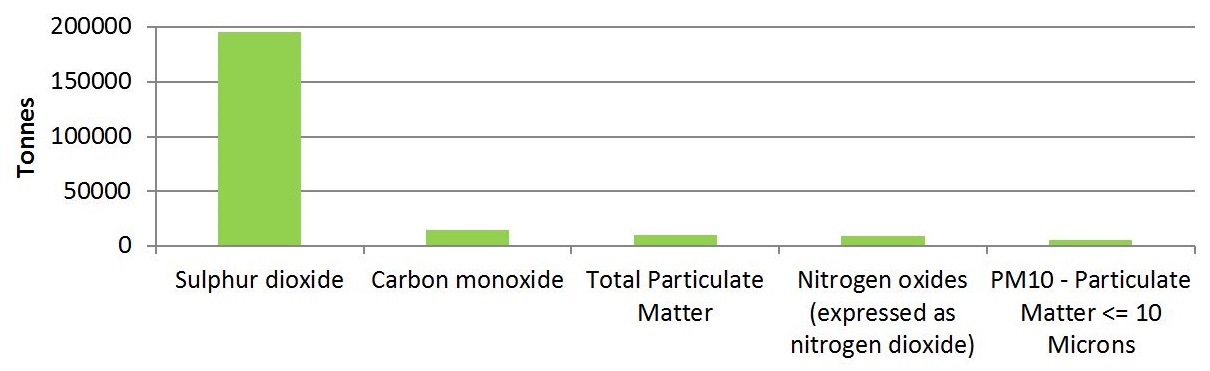
Top substances, by weight, released to air, land and water in 2015
Fabricated metal product manufacturing – NAICS 332
This subsector primarily engages in transforming metal into intermediate or end products by forging, stamping, forming, turning, and joining. It excludes manufacturing metal products by rolling, drawing, extruding, alloying or casting.
Number of facilities in 2015: 129
Range in number of substances reported in 2015: 1-17
Percent of facilities that intend on implementing: 45.4%
| Used | Created | Released | |
|---|---|---|---|
| Total amounts (tonnes) | 648,500 | 872 | 1,256 |
Map: Location of fabricated metal product manufacturing facilities reporting under the Toxics Reduction Act in 2015

*Green dots indicate facilities that intend on implementing a plan to reduce at least one substance.
Top substances, by weight, used in 2015
Top substances, by weight, created in 2015
Top substances, by weight, released to air, land and water in 2015
Machinery manufacturing – NAICS 333
Industries in this subsector primarily manufacture industrial and commercial machinery by assembling parts into components, subassemblies and complete machines.
Number of facilities in 2015: 28
Range in number of substances reported in 2015: 1-11
Percent of facilities that intend on implementing: 28.6%
| Used | Created | Released | |
|---|---|---|---|
| Total amounts (tonnes) | 4,537 | 241 | 287 |
Map: Location machinery manufacturing facilities reporting under the Toxics Reduction Act in 2015

*Green dots indicate facilities that intend on implementing a plan to reduce at least one substance.
Top substances, by weight, used in 2015
Top substances, by weight, created in 2015
Top substances, by weight, released to air, land and water in 2015
Computer and electronic product – NAICS 334
This subsector primarily engages in making computers, computer peripherals, communications equipment, and similar electronic products, as well as components for such products.
Number of facilities in 2015: 16
Range in number of substances reported in 2015: 1-7
Percent of facilities that intend on implementing: 66.7%
| Used | Created | Released | |
|---|---|---|---|
| Total amounts (tonnes) | 559 | 0.90 | 22 |
Map: Location of computer and electronic product manufacturing facilities reporting under the Toxics Reduction Act in 2015

*Green dots indicate facilities that intend on implementing a plan to reduce at least one substance.
Top substances, by weight, used in 2015
Top substances, by weight, created in 2015
Top substances, by weight, released to air, land and water in 2015
Electrical equipment, appliance and component manufacturing – NAICS 335
Industries in this subsector primarily make products that generate, distribute and use electrical power.
Number of facilities in 2015: 17
Range in number of substances reported in 2015: 1-6
Percent of facilities that intend on implementing: 37.0%
| Used | Created | Released | |
|---|---|---|---|
| Total amounts (tonnes) | 25,696 | 0.073 | 9 |
Map: Location of electrical equipment, appliance and component manufacturing facilities reporting under the Toxics Reduction Act in 2015
*Green dots indicate facilities that intend on implementing a plan to reduce at least one substance.
Top substances, by weight, used in 2015
Top substances, by weight, created in 2015
Top substances, by weight, released to air, land and water in 2015
Transportation equipment manufacturing – NAICS 336
This subsector primarily engages in producing equipment to transport people and goods by road, rail, air and water.
Number of facilities in 2015: 135
Range in number of substances reported in 2015: 1-44
Percent of facilities that intend on implementing: 32.1%
| Used | Created | Released | |
|---|---|---|---|
| Total amounts (tonnes) | 101,602 | 2,536 | 6,908 |
Map: Location of transportation equipment manufacturing facilities reporting under the Toxics Reduction Act in 2015
*Green dots indicate facilities that intend on implementing a plan to reduce at least one substance.
Top substances, by weight, used in 2015
Top substances, by weight, created in 2015
Top substances, by weight, released to air, land and water in 2015
Furniture and related product manufacturing – NAICS 337
Industries in this subsector primarily manufacture furniture and related products such as mattresses and cabinets by cutting, bending, molding, laminating and assembling a variety of materials such as wood, glass, plastic, metal and rattan.
Number of facilities in 2015: 26
Range in number of substances reported in 2015: 1-22
Percent of facilities that intend on implementing: 54.1%
| Used | Created | Released | |
|---|---|---|---|
| Total amounts (tonnes) | 1,597 | 42 | 618 |
Map: Location of furniture and related product manufacturing facilities reporting under the Toxics Reduction Act in 2015

*Green dots indicate facilities that intend on implementing a plan to reduce at least one substance.
Top substances, by weight, used in 2015
Top substances, by weight, created in 2015
Top substances, by weight, released to air, land and water in 2015
Miscellaneous manufacturing – NAICS 339
This subsector is made up of establishments that are not classified in any other subsector that make a wide range of products, such as sporting and athletic goods, toys, office supplies, or medical products.
Number of facilities in 2015: 26
Range in number of substances reported in 2015: 1-11
Percent of facilities that intend on implementing: 39.3%
| Used | Created | Released | |
|---|---|---|---|
| Total amounts (tonnes) | 39,838 | 286 | 604 |
Map: Location of miscellaneous manufacturing facilities reporting under the Toxics Reduction Act in 2015
*Green dots indicate facilities that intend on implementing a plan to reduce at least one substance.
Top substances, by weight, used in 2015
Top substances, by weight, created in 2015
Top substances, by weight, released to air, land and water in 2015