This page is no longer current and is provided for archival and research purposes.
Substances of Interest
Top 5 substances used, created, contained in product and released
The tables below provide data on the top 5 substances used, created, contained in product and released in 2015 (by weight). The tables show that the substances for each are mostly different from each other, which is expected as each substance serves a different purpose in a facility’s operations. Some substances are more likely to be used as an input, whereas other substances are typically created or released. Carbon Monoxide, Sulphur Dioxide and Particulate Matter are commonly created and released (further information on particulate matter is presented later in this report). Ethylene is commonly used, created and contained in product, and Manganese is one of the top 5 substances used and contained in product.
| Substance | Tonnes | # facilities intending to implement | # of facilities reporting the substance | % facilities intending to implement | Primary sectors that use the substance |
|---|---|---|---|---|---|
| 1. Butane (all isomers) | 995,029 | 3 | 33 | 9.1% | Chemical manufacturing 50% Petroleum and coal product manufacturing 49% |
| 2. Pentane (all isomers) | 955,682 | 8 | 40 | 20% | Petroleum and coal product manufacturing 89% Chemical manufacturing 10% |
| 3. Ethylene | 820,272 | 3 | 18 | 16.7% | Chemical manufacturing 100% |
| 4. Manganese (and its compounds) | 784,525 | 57 | 242 | 23.6% | Fabricated metal product manufacturing 76% Primary metal manufacturing 14% |
| 5. Benzene | 485,577 | 6 | 30 | 20% | Chemical manufacturing 85% Petroleum and coal product manufacturing 14% |
| Substance | Tonnes | # facilities intending to implement | # of facilities reporting the substance | % facilities intending to implement | Primary sectors that create the substance |
|---|---|---|---|---|---|
| 1. Carbon monoxide | 15,747,080 | 21 | 122 | 17.2% | Primary metal manufacturing 99% |
| 2. Ethylene | 1,124,156 | 3 | 18 | 16.7% | Chemical manufacturing 95% Petroleum and Coal Products Manufacturing 4% |
| 3. Sulphuric acid | 1,024,937 | 48 | 152 | 31.6% | Primary metal manufacturing 93% Chemical manufacturing 7% |
| 4. Sulphur dioxide | 721,955 | 11 | 61 | 18% | Primary metal manufacturing 86% Chemical manufacturing 8% Petroleum and Coal Products Manufacturing 3% Non-metallic mineral product manufacturing 2% |
| 5. Total Particulate Matter | 695,108 | 23 | 131 | 17.6% | Primary metal manufacturing 70% Paper manufacturing 17% Chemical manufacturing 9% Wood product manufacturing 2% |
| Substance | Tonnes | # facilities intending to implement | # of facilities reporting the substance | % facilities intending to implement | Primary sectors that release the substance |
|---|---|---|---|---|---|
| 1. Sulphuric Acid | 1,028,958 | 48 | 152 | 31.6% | Primary metal manufacturing 92% Chemical manufacturing 7% |
| 2. Toluene | 914,258 | 64 | 160 | 40% | Petroleum and coal product manufacturing 92% Chemical manufacturing 8% |
| 3. Ethylene | 886,196 | 3 | 18 | 16.7% | Chemical manufacturing 97% Petroleum and coal product manufacturing 3% |
| 4. Xylene | 805,803 | 63 | 158 | 39.9% | Petroleum and coal product manufacturing 96% Chemical manufacturing 4% |
| 5. Manganese | 749,826 | 57 | 242 | 23.6% | Fabricated metal product manufacturing 80% Primary metal manufacturing 13% Non-metallic mineral product manufacturing 5.0% Transportation Equipment Manufacturing 2% |
| Substance | Tonnes | # facilities intending to implement | # of facilities reporting the substance | % facilities intending to implement | Primary sectors that release the substance |
|---|---|---|---|---|---|
| 1. Sulphur dioxide | 244,432 | 11 | 61 | 18% | Primary metal manufacturing 80% Petroleum and coal product manufacturing 8% Non-metallic mineral product manufacturing 6% Chemical manufacturing 4% |
| 2. Carbon monoxide | 57,040 | 21 | 122 | 17.2% | Primary metal manufacturing 26% Petroleum and coal product manufacturing 22% Paper manufacturing 17% Chemical manufacturing 12% Non-Metallic Mineral Product Manufacturing 9% Wood Product Manufacturing 8% |
| 3. Nitrogen oxides (expressed as nitrogen dioxide) | 45,843 | 24 | 132 | 18.2% | Non-metallic mineral product manufacturing 36% Primary metal manufacturing 19% Chemical manufacturing 14% Petroleum and coal product manufacturing 12% Paper manufacturing 10% |
| 4. Total Particulate Matter | 27,252 | 23 | 131 | 17.6% | Primary metal manufacturing 37% Mining and quarrying (except oil and gas) 19% Paper manufacturing 14% Non-metallic mineral product manufacturing 10% Wood product manufacturing 8% |
| 5. PM10 | 15,577 | 60 | 436 | 13.8% | Primary metal manufacturing 34% Paper manufacturing 19% Non-metallic mineral product manufacturing 12% Mining and quarrying (except oil and gas) 10% Wood product manufacturing 7% Petroleum and Coal Products Manufacturing 7% |
Substances linked with cancer
Thirty seven of the toxic substances regulated under the Toxics Reduction Act are identified as known or probable carcinogens (substances linked with cancer) by the International Agency for Research on Cancer. These substances may be found in the environment, and health organizations and partners are continually determining how the environmental exposures to these substances are linked with cancer.
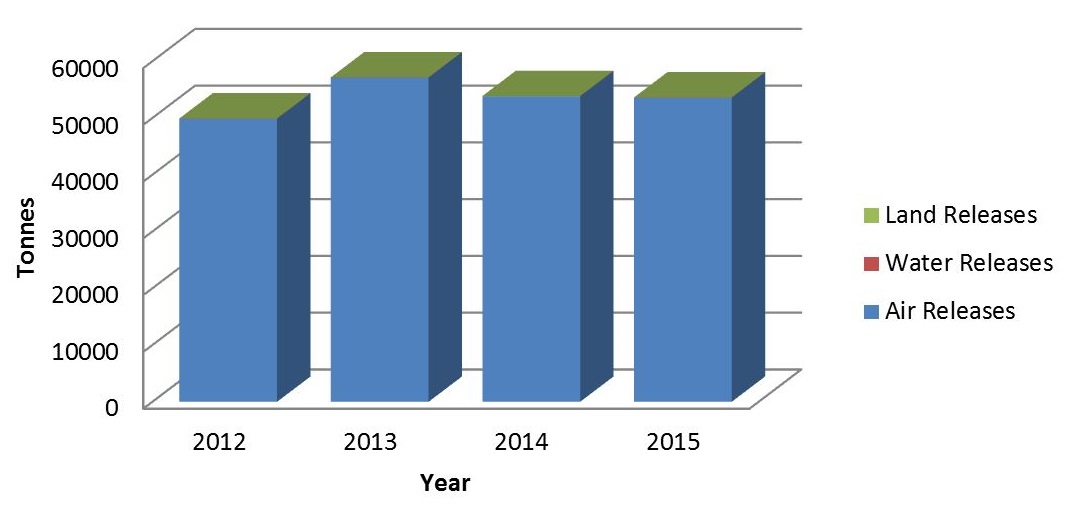
The graph below illustrates the substances linked with cancer released to the environment by facilities under the Toxics Reduction program, between 2012 and 2015. The graph shows that environmental releases are primarily to air, with very small amounts being discharged to land and water. Since 2012, releases have remained relatively stable with a small decrease from 2014 to 2015.
Substances linked with cancer released to air, water, and land 2012-2015
When looking at trends of releases of substances linked with cancer, public health information is very important in understanding the potential for human exposure and impacts. A recent report released by Public Health Ontario and Cancer Care Ontario called the Environmental Burden of Cancer in Ontario, estimates that 3,540 to 6,510 new cancer cases each year in Ontario are from exposure to 23 environmental carcinogens. The Environmental Burden of Cancer report identifies environmental substances linked with cancer that are responsible for 10 or more new cancer cases per year, some of which are reported under the Toxics Reduction Act. These include PM2.5, Arsenic, Acrylamide, Diesel Particulate Matter, Asbestos, Formaldehyde, Dioxins and Chromium, with PM2.5 identified as contributing the third highest number of new cancer cases per year. The report identifies priority routes of exposure, including breathing, eating, and drinking, and sources originating from outdoor and indoor air pollution, food, drinking water and indoor dust.
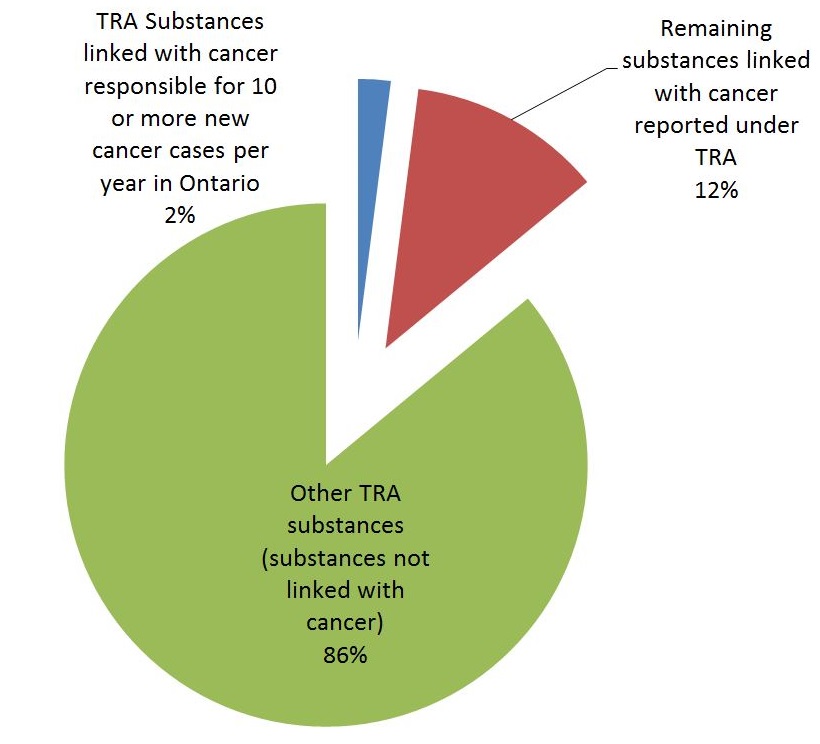
The graph below illustrates the releases to the environment of all the substances under the toxics program in comparison with those that are substances linked with cancer, and those that are substances linked with cancer responsible for 10 or more new cancer cases per year. Of the total amount of toxic substances released to the environment, 14% of those releases are from substances linked with cancer. Substances linked with cancer, that are responsible for 10 or more new cancer cases per year as identified in the Environmental Burden of Cancer in Ontario report, account for 2% of the overall provincial releases and disposals by facilities reporting under the Toxics Reduction Act. In many cases exposure is not from industrial facilities for these substances, but exposure through our food and our homes.
2015 Discharges to the environment of Toxics Reduction Act (TRA) substances and TRA substances linked with cancer
Toxic substance reduction planning can be a tool to help facilities identify opportunities to reduce substances linked with cancer from being used, created and released to the environment. Indeed, while developing their toxic substance reduction plans, Ontario facilities are targeting substances linked with cancer. The table below shows the number of facilities that indicated the intent to implement an option to reduce one or more substances linked with cancer.
| Number of facilities that intend on implementing | Number of facilities that have submitted a plan summary | % of facilities that intend on implementing | |
|---|---|---|---|
| 2-Mercaptobenzothiazole | 1 | 1 | 100.0% |
| Ethylene oxide | 1 | 1 | 100.0% |
| p,p'-Methylenebis(2-chloroaniline) | 1 | 2 | 50.0% |
| Dibenzo(a,h)anthracene | 3 | 8 | 37.5% |
| Hexavalent chromium (and its compounds) | 32 | 86 | 37.2% |
| Dichloromethane | 4 | 11 | 36.4% |
| Trichloroethylene | 1 | 3 | 33.3% |
| Sulphuric acid | 48 | 152 | 31.6% |
| Lead (and its compounds) | 53 | 180 | 29.4% |
| Dibenz(a,j)acridine | 2 | 7 | 28.6% |
| Tetrachloroethylene | 2 | 7 | 28.6% |
| Benzo(a)pyrene | 3 | 12 | 25.0% |
| Cadmium (and its compounds) | 18 | 79 | 22.8% |
| Formaldehyde | 11 | 50 | 22.0% |
| Nickel (and its compounds) | 32 | 151 | 21.2% |
| Benzene | 6 | 30 | 20.0% |
| Arsenic (and its compounds) | 9 | 48 | 18.8% |
| Total Particulate Matter | 23 | 131 | 17.6% |
| 2,3,4,7,8-Pentachlorodibenzofuran | 6 | 39 | 15.4% |
| 2,3,7,8-Tetrachlorodibenzo-p-dioxin | 6 | 39 | 15.4% |
| PM2.5 | 61 | 431 | 14.2% |
| PM10 | 60 | 436 | 13.8% |
| Asbestos (friable form only) | 1 | 10 | 10.0% |
*List of substances linked with cancer is based on substances that are reportable under the Toxics Reduction Act and are classified as known or probable carcinogens by the International Agency for Research on Cancer.
The data reported on substances linked with cancer can help inform the Ontario government and other organizations on policies and programs that focus on reducing the release of these substances into the environment, including working with facilities to implement toxics reduction options that focus on these substances.
Particulate matter
Particulate matter is of interest to Ontario for a number of reasons: it is one of the top 5 substances created and released by weight, it is one of the most commonly reported substances by facilities captured under the Toxics Reduction Act, and it is a substance linked with cancer.
What is particulate matter?
Particulate matter is the general term used for a mixture of solid particles and liquid droplets in the air. It includes aerosols, smoke, fumes, dust, ash and pollen. The size, composition and origin of particulate matter can vary due to a number of factors such as location, types of emission sources and contaminants, season and weather conditions.
Particulate matter is characterized according to size - mainly because the potential for health effects associated with particles based on different diameters. PM2.5 is particulate matter that is less than 2.5 micrometres in diameter. It is also known as respirable particles because it penetrates the respiratory system further than larger particles and is considered to be a higher health risk factor than larger particles. Particulate matter can be directly emitted (primary particulate) or can be formed in the atmosphere as a result of chemical reactions involving gaseous precursors (secondary particulate). This report focuses on primary particulate only. Total Particulate Matter has a diameter of up to 100 micrometres, and particulate matter with a diameter of less than 10 micrometres is known as PM10.
The International Agency for Research on Cancer classifies particulate matter in outdoor air as a group 1 carcinogen. The Environmental Burden of Cancer Report by Public Health Ontario and Cancer Care Ontario identifies PM2.5 as one of the top three environmental contributors of new cancer cases per year in Ontario.
What are the sources of particulate matter?
Particulate matter emissions to outdoor air is directly emitted from a variety of point and area sources.
NPRI defines point sources as any stationary sources that usually release emissions through industrial stacks or other emission sources, and where these emissions can be measured.
Area sources are defined by the NPRI as small collective sources that are inventoried as a group and which are too numerous to inventory as individual point sources. Area sources include residential, institutional and commercial fuel combustion, mobile sources such as motor vehicles, and open sources.
Open sources, as defined by NPRI, are sources that cannot be directly measured and are associated with activities that generate dust or disturb the soil including travel on roads, construction or agricultural operations. Open sources emit particulate matter over large geographical areas and are dispersed over too large an area to allow controls by conventional equipment.
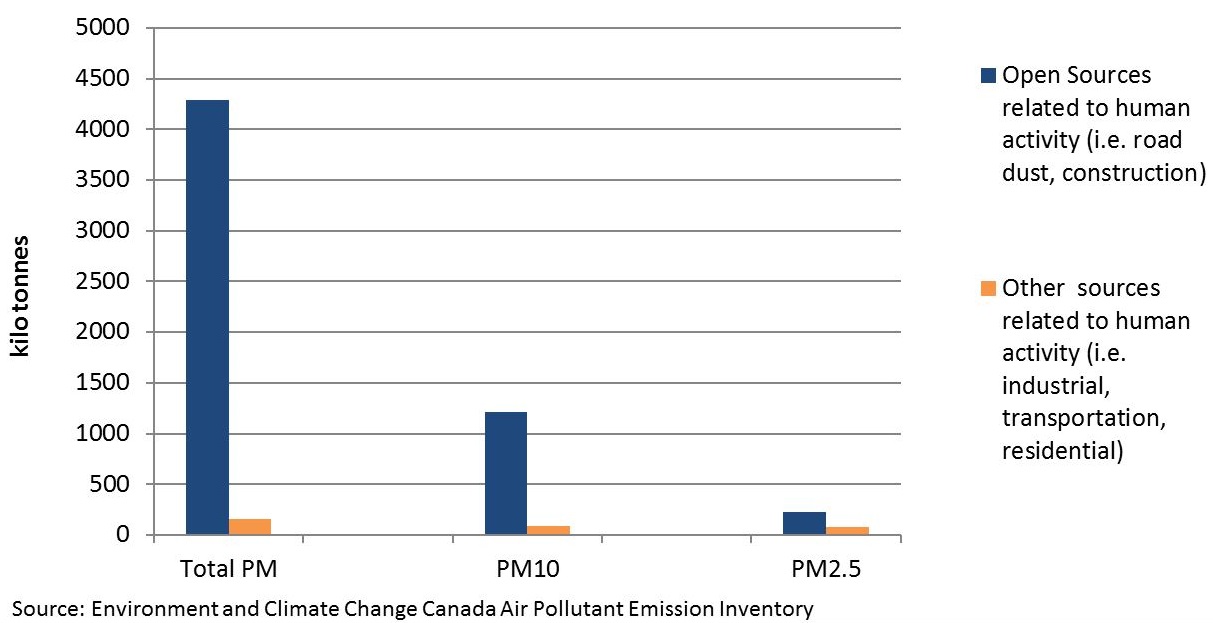
As shown in the graph below, open sources account for the vast majority of particulate matter emissions in Ontario. In 2014, open sources contributed to 96.5% of Total Particulate Matter, 93% of PM10 and 75% of PM2.5 emissions.
2014 Ontario emission sources for PM2.5, PM10 and Total Particulate Matter
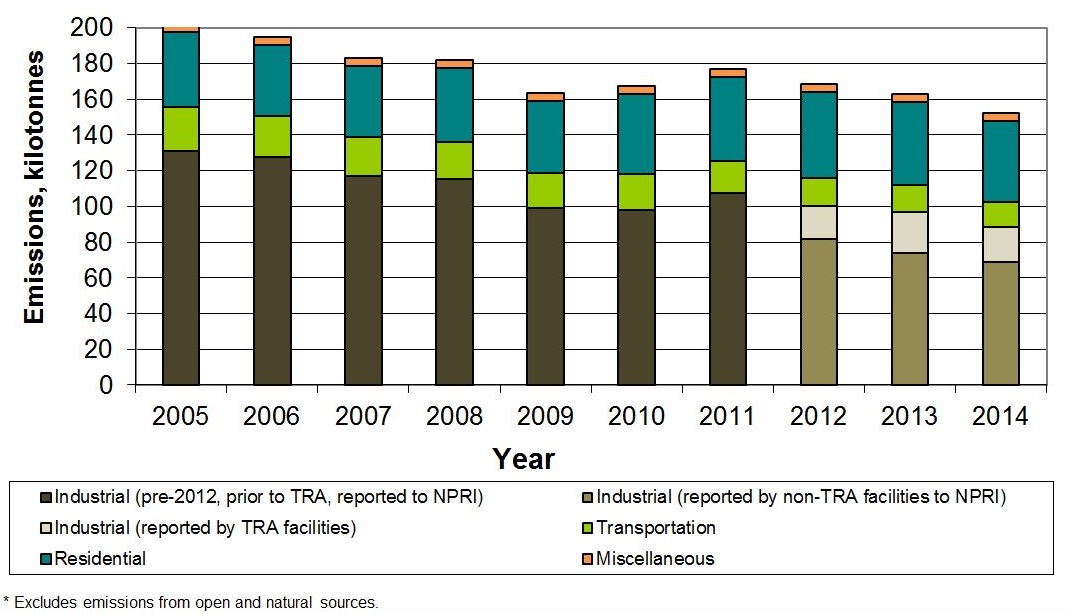
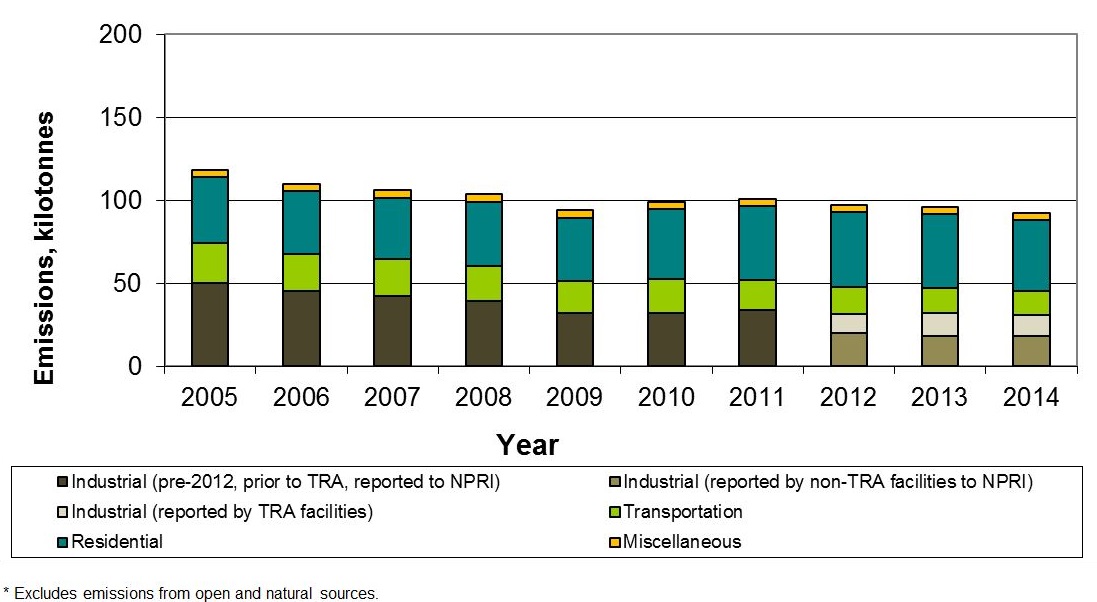
Besides open sources, the other sources of particulate matter include point sources (e.g. industrial) and area sources (e.g. residential, transportation/mobile and miscellaneous (e.g. meat cooking and cigarette smoking). The graphs below illustrate the provincial emissions of Total Particulate Matter, PM10 and PM2.5 and the relative contribution of emissions from each of these types of area sources when open sources are excluded. For example, in 2014, Ontario’s PM2.5 emission from residential fuel combustion (e.g. wood burning in fireplaces and wood stoves) accounted for 57% of emissions, whereas industrial fuel combustion and processes only accounted for 21% of emissions, and the transportation sector accounted for 16%.
2012 was the first year when all regulated facilities were required to report under the Toxics Reduction Act (TRA). The graphs show the contributions that the facilities that report under the TRA make to the overall provincial releases from 2012 to 2014, excluding open sources. Although particulate matter is one of the most reported substances by facilities under the TRA, the graphs show that in 2014, Total Particulate Matter emitted by facilities contributed 22% to the total releases by the industrial sources. This corresponds to 0.3% of total provincial releases, including open sources. Facilities that report PM10 under the TRA contributed 42% to the total releases by the industrial sources. This corresponds to 1% of the overall provincial releases, including open sources. Finally, facilities reporting PM2.5 under the TRA made up 48% of total industrial releases in Ontario, and including open sources, makes up 2.6% of total provincial releases.
Ontario Total Particulate Matter emissions (2005 to 2014)
Ontario PM10 emissions (2005 to 2014)
Ontario PM2.5 emissions (2005 to 2014)
These graphs also illustrate that the general trends for provincial emissions of particulate matter, excluding open sources, have been decreasing since 2005: Total Particulate Matter has decreased by 25%, PM10 by 22% and PM2.5 by 19%.
These overall reductions can be partially attributed to numerous Ontario environmental initiatives, including: phasing out coal-fired electricity generation and replacing coal-generated power with cleaner, non-emitting energy sources; reducing smog-causing emissions from cars and trucks through Drive Clean emissions testing; and setting air standards under the Local Air Quality Regulation (O. Reg. 419/05).
New environmental initiatives will continue to support reductions in particulate matter. For example, under the pan-Canadian Air Quality Management System, Ontario is currently developing an Air Zone Management framework to help achieve Canadian Ambient Air Quality Standards for PM2.5 and drive continuous improvements to air quality across the province. In addition, under the Climate Change Action Plan, Ontario is developing a new wood stove exchange and replacement program targeting northern, rural and indigenous communities that is expected to reduce emissions of contaminants associated with wood burning, which includes particulate matter.
Ontario’s Air Quality Health Index considers PM2.5 in the air (along with several other pollutants) as an indicator of the overall outdoor air quality. The Air Quality Health Index is a health protection tool that is designed to help you make decisions to protect your health by limiting short-term exposure to air pollution and adjusting your activity levels during increased levels of air pollution.