This page is no longer current and is provided for archival and research purposes.
Facility Annual Reports
Toxics reduction reports (hereafter called reports) are prepared and submitted annually by facilities regulated under the Toxics Reduction Act. The information provided in these reports allows Ontario to monitor facilities’ progress towards implementing their plans and achieving reductions. They track year-over-year toxics use, creation, amounts contained in product (the reporting requirements that are specific to Ontario’s Toxics Reduction Act), as well as the amounts released, disposed and recycled at the facility (the reporting requirements under NPRI). They also track progress made on implementing toxic substance reduction plans.
While Ontario can evaluate data trends as well as determine possible reasons for the trends identified, changes can be due to a number of variables. As outlined by NPRI, these variables include changes at the facility (e.g. variations in production levels, facility expansions/reductions, process modifications) and other factors such as changes in calculation methods, data updates, and changes in the regulatory environment. As well, changes to the substances reported to NPRI affect the substances being reported to the Toxics Reduction program and can therefore also affect the amounts of substances reported over time. For instance, NPRI lowered the reporting thresholds for certain substances in 2014. This resulted in an increase of facilities required to report, and in turn, increased the amounts reported for those particular substances. In addition, progress may be attributed to complementary ministry programs whose goals are also to minimize environmental releases.
Substance terms
The term “use” refers to the amount of a substance that is used at a facility as either the substance itself or as part of another substance.
The term “creation” refers to any intentional or non-intentional creation of a substance at a process at a facility. Once created, the substance may be destroyed, transformed into another substance, released, disposed of, transferred or it may leave the process and/or facility contained in a product.
Substances “contained in product” include the amount of toxic substances that leave a process at the facility in the form of a product. This includes consumer products, as well as products that will be used in another process at the facility.
Substances used, created and contained in product
The following graph shows the total amounts used, created, contained in product and released, for all substances in the toxics program between 2012 and 2015. There are fluctuations over the years. Between 2014 and 2015, there was a 33% (approximately 5.36 million tonnes) decrease in use; an 8% (approximately 2.4 million tonnes) decrease in creation; and a 5% (approximately 427,000 tonnes) increase in the amount contained in product.
Total amounts used, created, contained in product and released 2012-2015
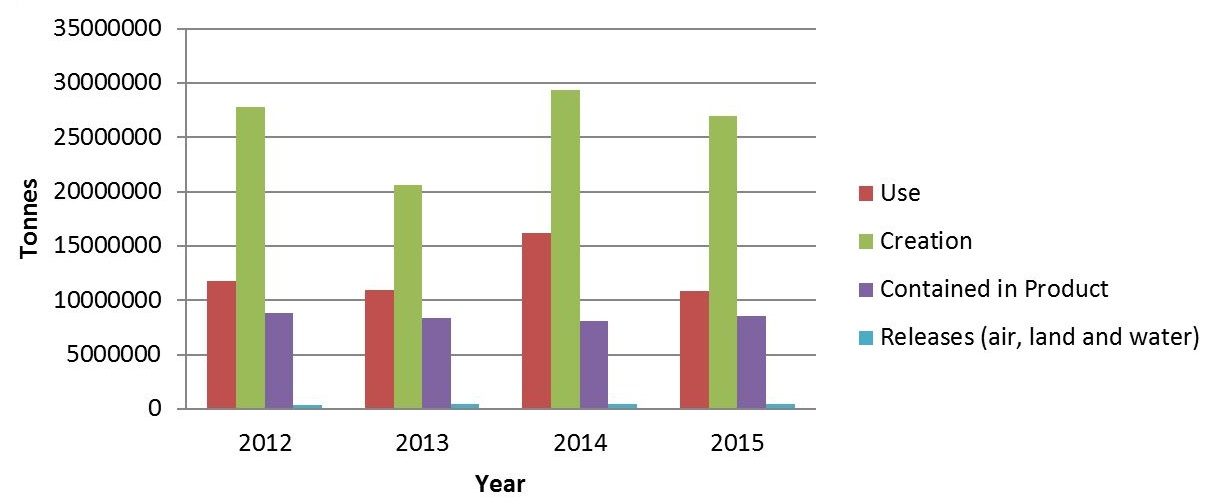
Several substances contributed to the decrease in substances used in 2015 after having higher use values reported in 2014. These include Acrylic Acid, Butyl Acrylate, Ethylene Glycol, Styrene, and Vinyl Acetate. Facilities mainly cited decreases in production levels as the reason for the decreases.
In 2015, some facilities reported increased use of certain substances such as Anthracene, Hydrotreated light distillate, and Manganese (and its compounds). Facilities reported a variety of reasons for the increases; e.g. an increase in production levels, changes in the method to quantify use, or it was the facility’s first year reporting the substance. Overall, however, the amount of substances used in the province has decreased between 2014 and 2015, and 2015 releases are lower than in 2012.
The total amount of substances created also decreased in 2015. These decreases can be attributed primarily to decreases in the creation of 1,3-Butadiene, Carbon Monoxide, Isoprene, Propylene, and Toluene. The facilities that reported the decreases identified they were primarily as a result of decreases in production levels and measurement variability. At the same time, there was an increase in the creation of several substances such as Anthracene, Biphenyl, Ethyl alcohol, Hexane, Pentane, and Zinc. The facilities that reported increased values for these substances in 2015 cited that it was their first year reporting the substance and measurement variability as the reasons for change. Again, however, the provincial total of substances created has decreased since last year, and the 2015 releases are lower than in 2012.
Substances contained in product have fluctuated overall between 2012 and 2015, with most substances increasing or decreasing within a small range. There is a decrease in the amounts contained in product from 2012 to 2014 and this is mainly a result of decreases in Benzene, n-Hexane, Propylene, 1,3-Butadiene, Phosphorus and Methyl ethyl ketone. More recently, between 2014 and 2015, there was an increase as a result of increases to Sulphuric Acid, Ethylene and Manganese.
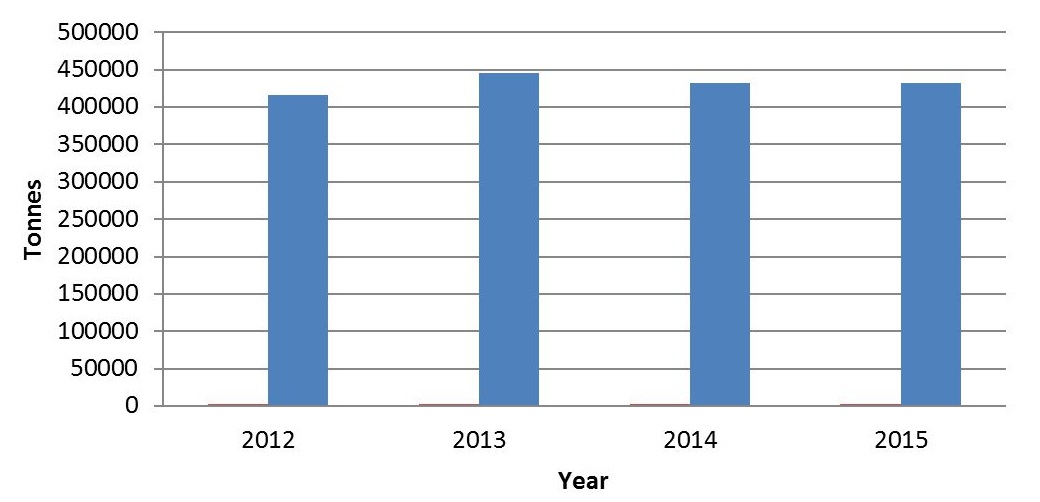
Substances released
As shown in the graph above, total releases (to air, land and water) are very small in comparison to the substances used, created and contained in product. When focusing specifically on releases alone, the graph below, ‘Total releases to air, land and water’, shows that substances released have remained stable since 2012, with a 0.03% (119 tonne) decrease in 2015 since 2014.
Total releases to air, land and water
Progress on substances used, created, contained in product and released
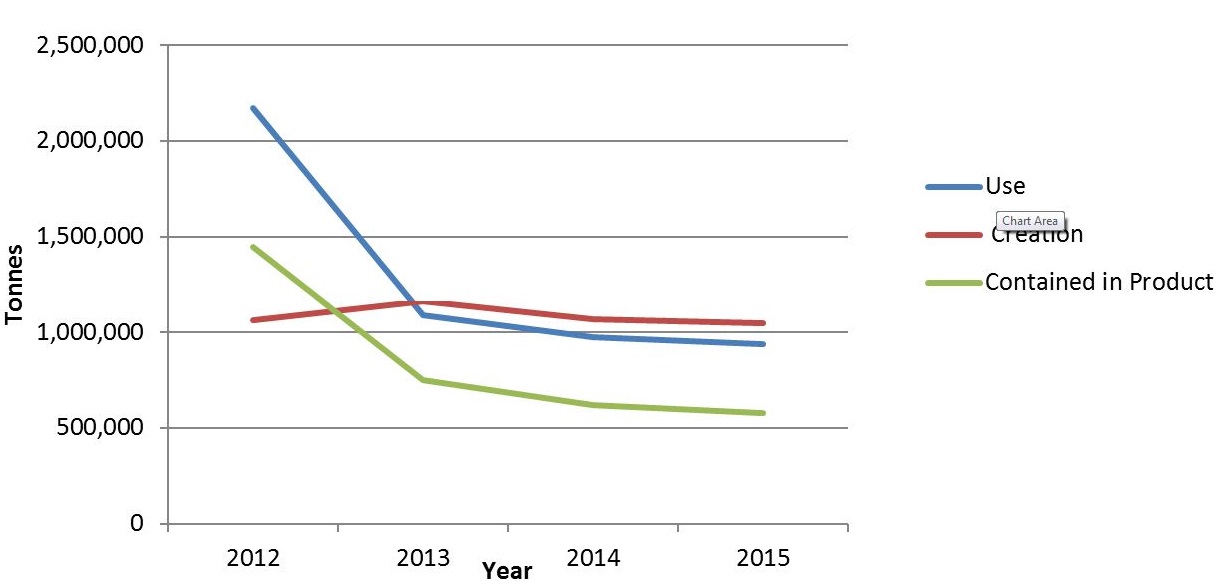
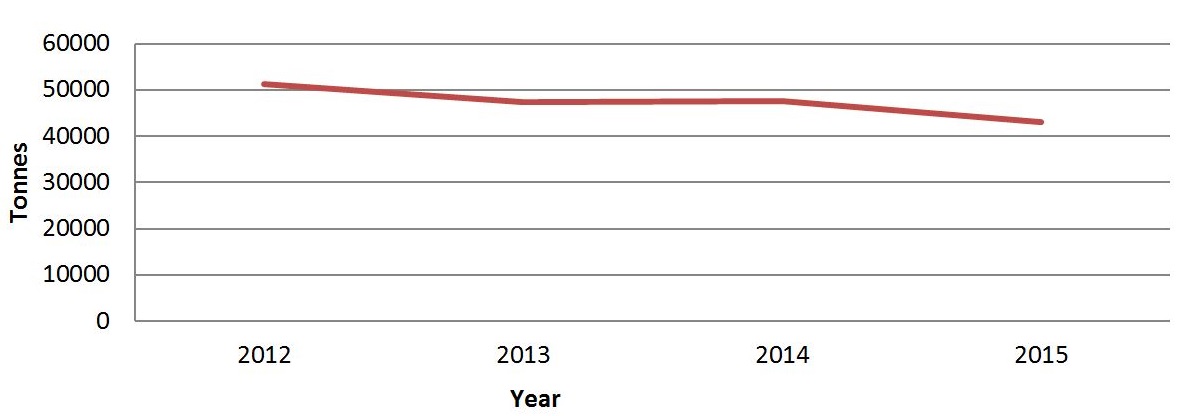
While the graphs above provide insight into overall provincial trends, they do not show progress being made on a smaller scale. Examining only the substances where facilities indicated an intent to reduce shows that there is progress occurring to reduce and/or eliminate these substances. Some facilities have indicated reductions were due to the implementation of their plans, while others have indicated other reasons such as a decrease in production. The graphs below illustrate how the use, creation, amount contained in product, and releases of toxic substances decrease over time for these facilities.
Total use, creation and contained in product only for substances that facilities indicated the intent to reduce
Total releases (air, land and water) only for substances that facilities indicated the intent to reduce
Ontarians are encouraged to visit the province’s Toxics Environment Map to search by geographic location, company name, toxic substance or sector to find more information on facilities’ use, creation, amounts contained in product and releases of toxic substances.