October to December, 2018
Introduction
About the Ontario Employment Report
The Ontario Employment Report is released four times a year and provides an assessment of the current trends and developments in the Ontario labour market. The Ontario Employment Report is a companion report to the Ontario Economic Accounts, which provides an overall assessment of the current state of the Ontario economy. All estimates in this report are based on Statistics Canada’s Labour Force Survey, unless otherwise specified. Its primary audience includes economists in both public and private sectors and credit rating agencies.
Methodological note
In the current issue, year-over-year change represents change between the averages in the fourth quarter of 2017 and the fourth quarter of 2018. Note that the Ontario Economic Accounts report primarily shows changes between the previous and the current quarter.
This report uses seasonally adjusted data in charts displaying data with a monthly frequency in the Overview section.
Unadjusted data is used in charts and tables showing the changes for the current quarter compared with the same quarter for the previous year. Unadjusted data is also used to calculate annual averages, year-to-date averages and 2018 fourth quarter averages.
Overview
Ontario’s labour market overview
Employment:
+89,300 net new jobs year-over-year
+90,500 full-time jobs year-over-year
Unemployment rate:
5.4% in December 2018
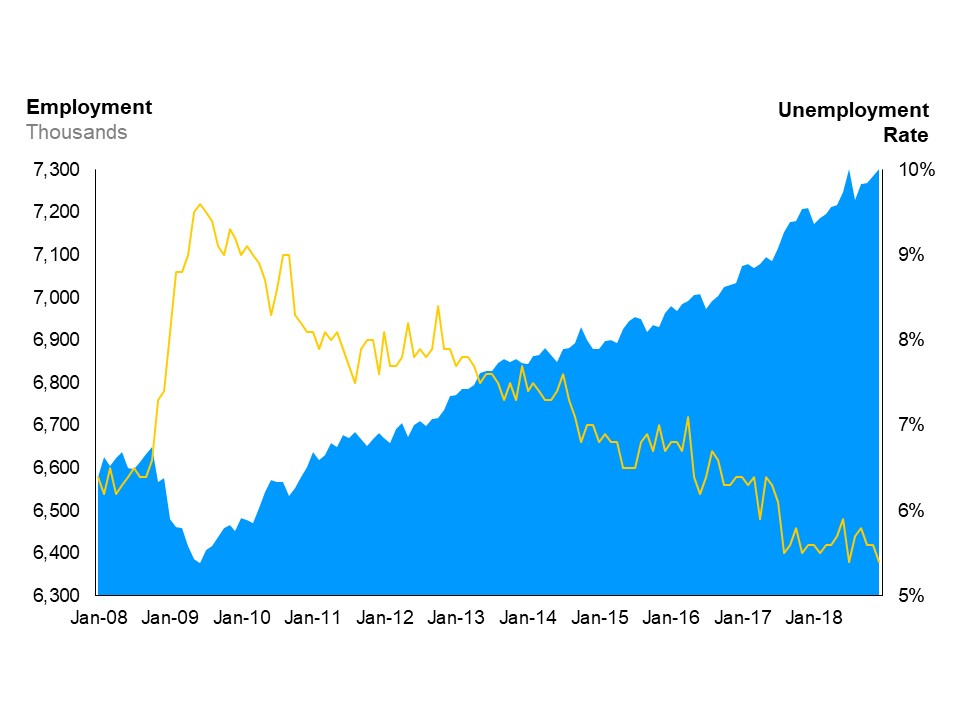
Year-over-year, Ontario’s employment grew by 1.2% (89,300), the same as the Canadian rate.
Ontario’s unemployment rate was 5.4% in December 2018, lower than the Canadian rate of 5.6%.
Year-over-year overview
Ontario’s labour market, 2008-2018
>
Between the fourth quarter of 2017 and 2018:
- employment growth was driven by increases in full-time employment (+1.6%) while part-time employment declined (-0.1%)
- there were significant employment gains in the services-producing sector (+1.6%), but employment in the goods-producing sector decreased (-0.2%)
- all five Ontario regions posted employment gains with Central Ontario experiencing the fastest employment growth (+2.4%)
- core-aged workers experienced above-average employment growth (+2.6%)
- the average hourly wage increased by 2.5%, to $27.48
Type of work quarterly details
Employment change by full-time, part-time status
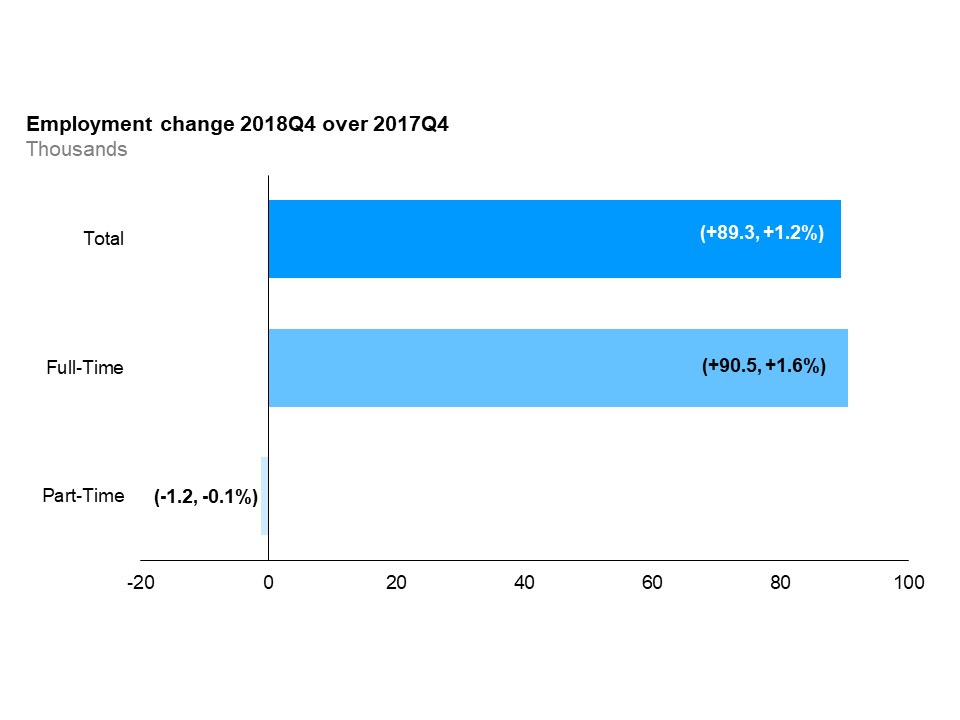
Year-over-year, full-time employment increased by 1.6% in the fourth quarter, while part-time employment decreased by 0.1%.
Employment change all employment sectors
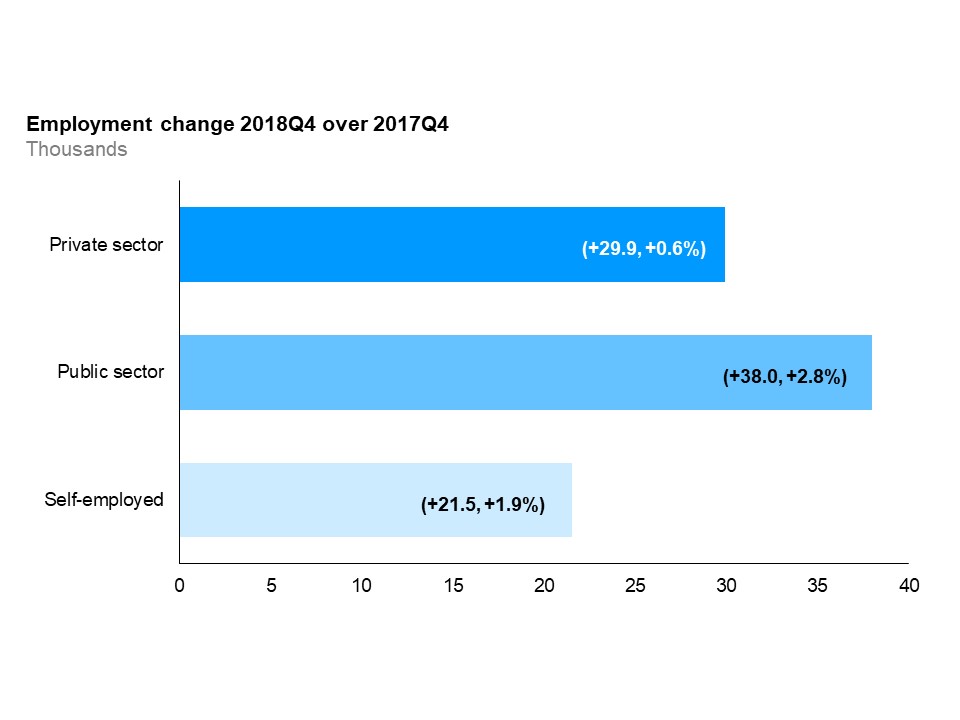
Year-over-year, while all sectors saw growth, the highest employment growth was in the public sector (+2.8%), which was followed by self-employment (+1.9%) and the private sector (+0.6%).
Employment change by above-, below-average wage industries
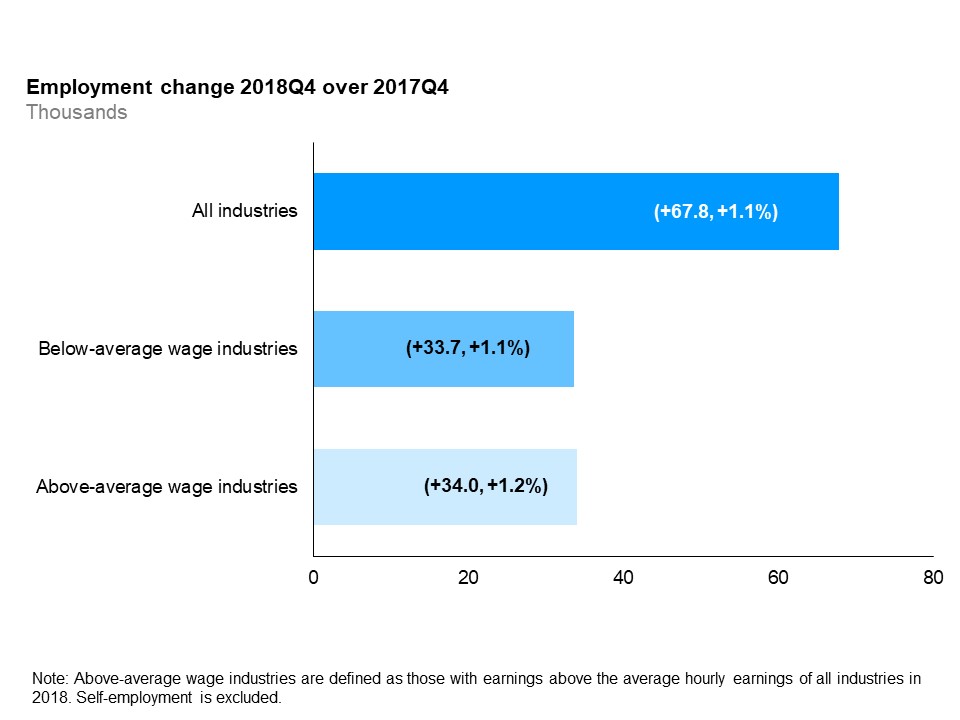
Year-over-year, paid employment increased in above-average wage industries by 1.2%, while employment in below-average wage industries increased by 1.1%.
Sector and occupation quarterly details
Year-over-year, there were significant employment gains in the services-producing sector (+1.6%), but employment in the goods-producing sector decreased (-0.2%).
Employment change by industry, goods-producing industries
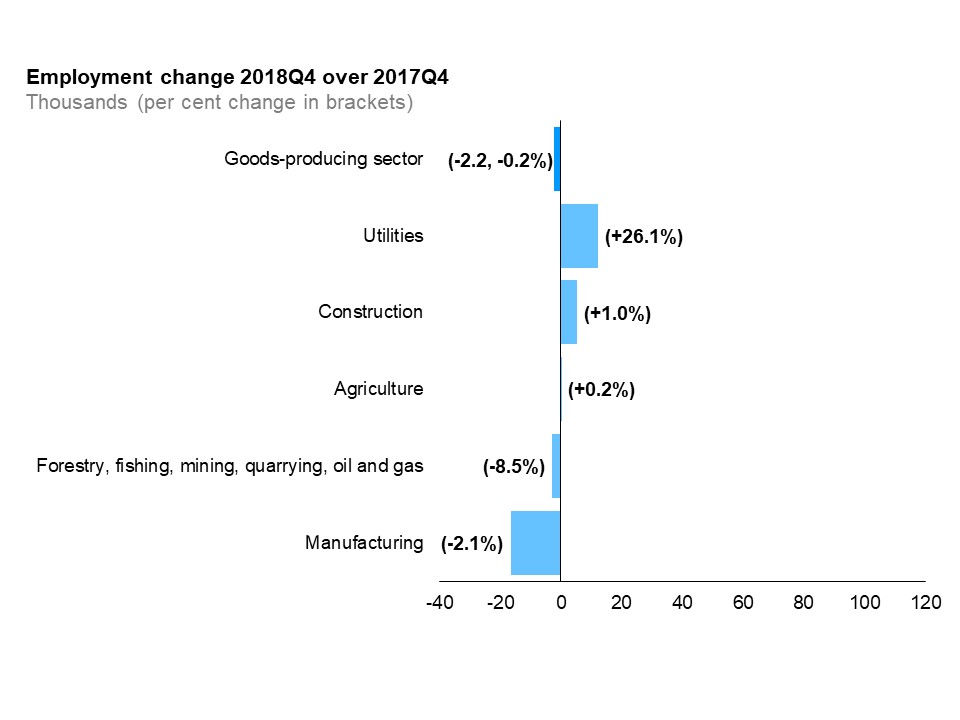
Among goods-producing industries, the employment decline was driven by manufacturing (-2.1%), while utilities added the most jobs and experienced the largest growth rate (+26.1%).
Employment change by industry, services-producing industries
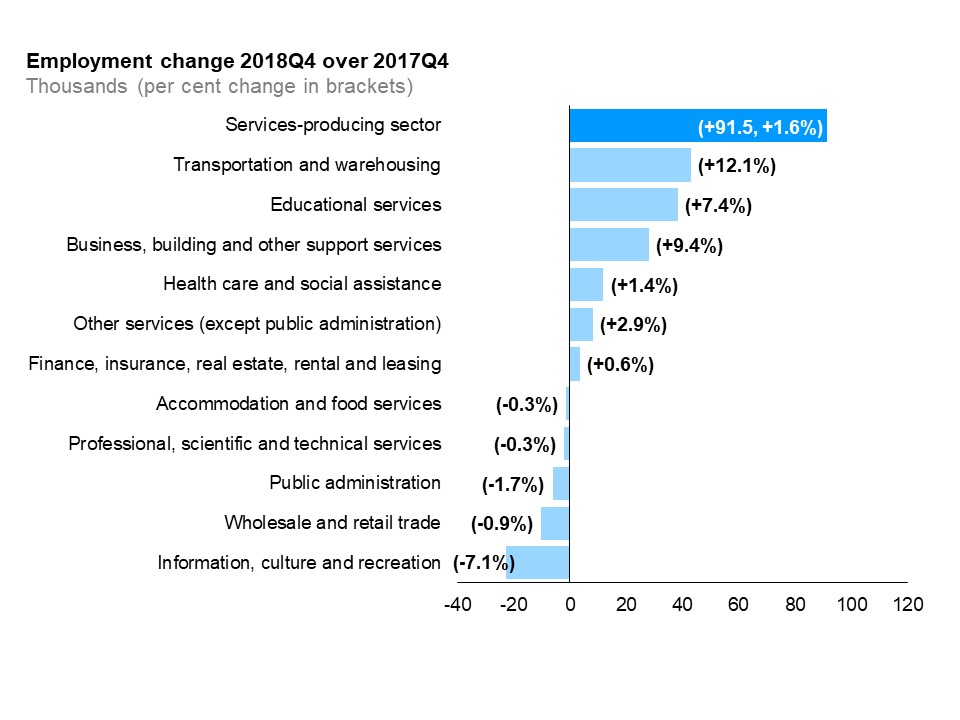
Among services-producing industries, transportation and warehousing gained the most jobs and had the highest rate of employment growth (+12.1%). In this industry, growth was particularly strong in general freight trucking and scheduled airline transportation. Information, culture and recreation had the largest decline in employment (-7.1%).
Employment change by occupational group
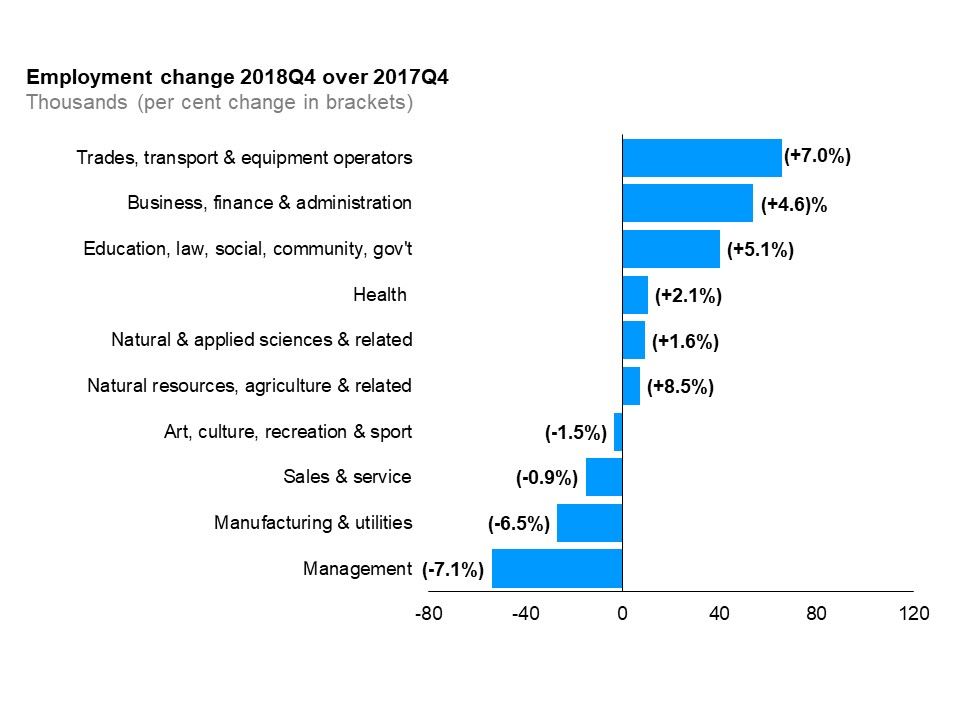
Among broad occupational groups, trade, transport and equipment operator occupations saw the largest increase in employment, while employment in management occupations declined the most.
Geographic region
Ontario regions
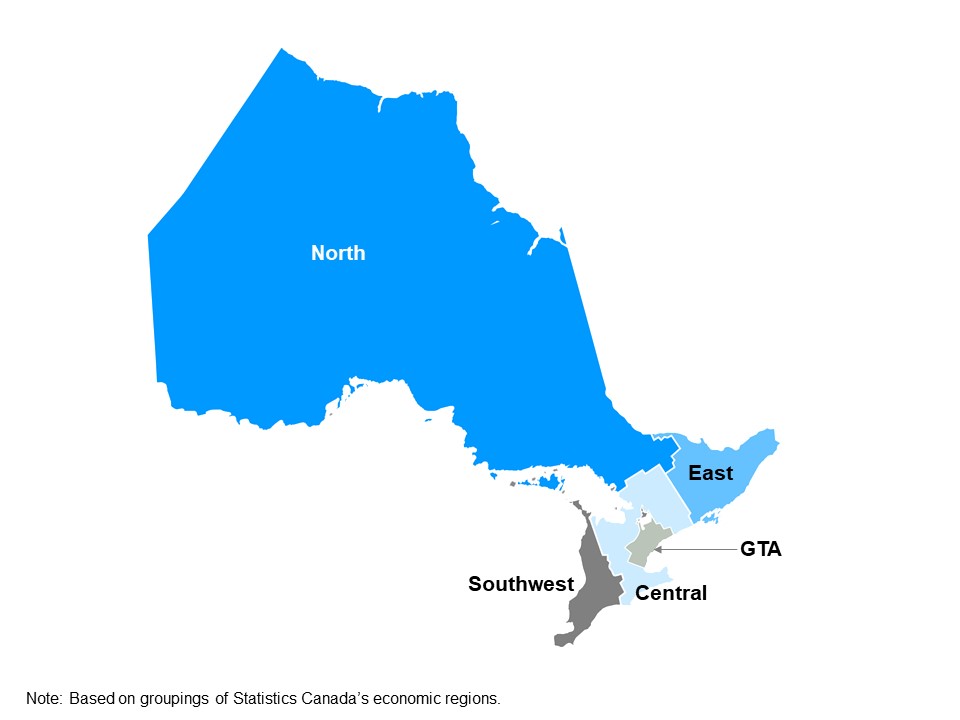
Employment change by Ontario region
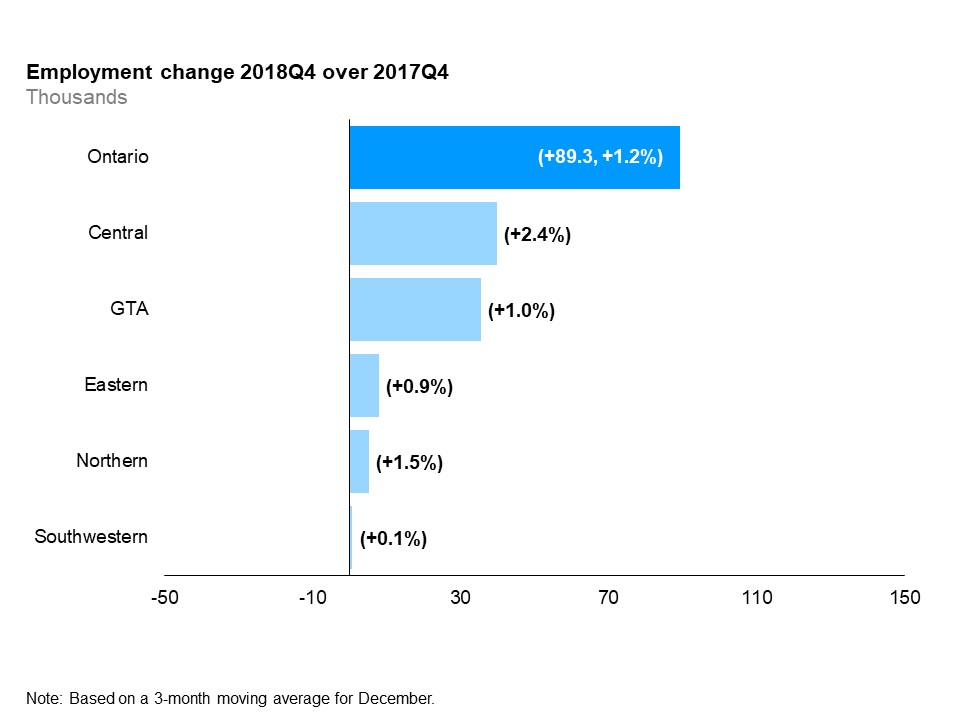
Year-over-year, employment increased in all five Ontario regions. The rate of employment growth was highest in Central Ontario (+2.4%), followed by Northern Ontario (+1.5%), the Greater Toronto Area (GTA)
Unemployment rates by Ontario region
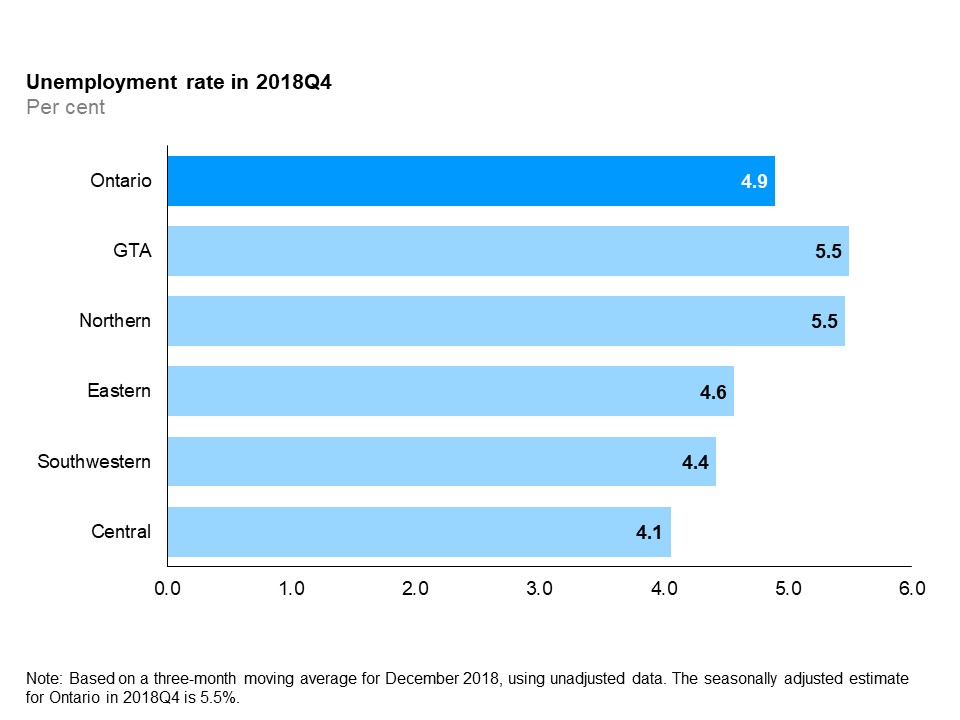
In the fourth quarter of 2018, the GTA and Northern Ontario had the highest unemployment rate (5.5%) and Central Ontario had the lowest unemployment rate (4.1%).
Participation rates by Ontario region
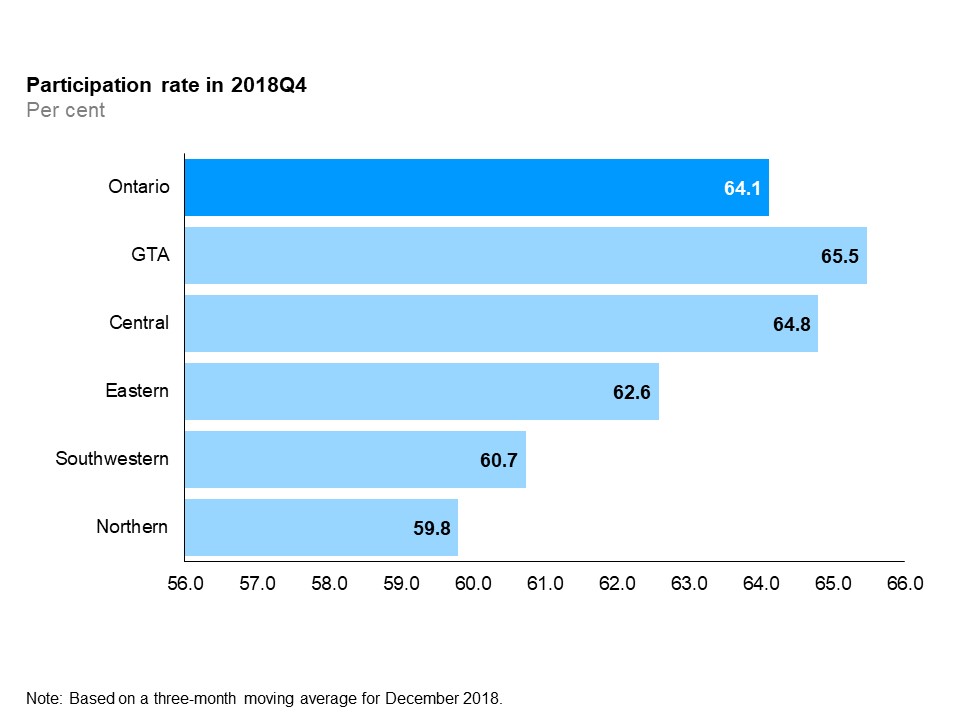
Quarterly labour force participation rates varied considerably among the economic regions. In the fourth quarter, participation rates ranged from 59.8% in Northern Ontario to 65.5% in the GTA.
Age and gender quarterly details
Employment change by age group and gender
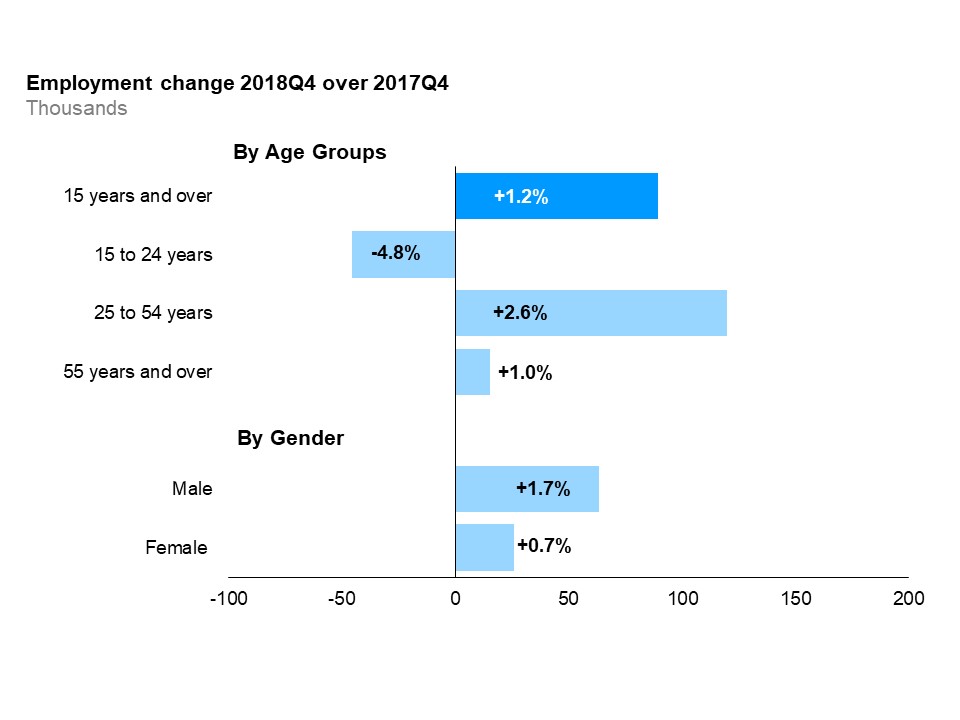
Compared to the same quarter last year, core-aged workers (25 to 54 years) gained the most jobs, followed by older workers (55 years and over). Youth (15 to 24 years) employment declined over the same period by 4.8%. Core-aged workers experienced above-average employment growth (+2.6%).
Unemployment rates by age group and gender
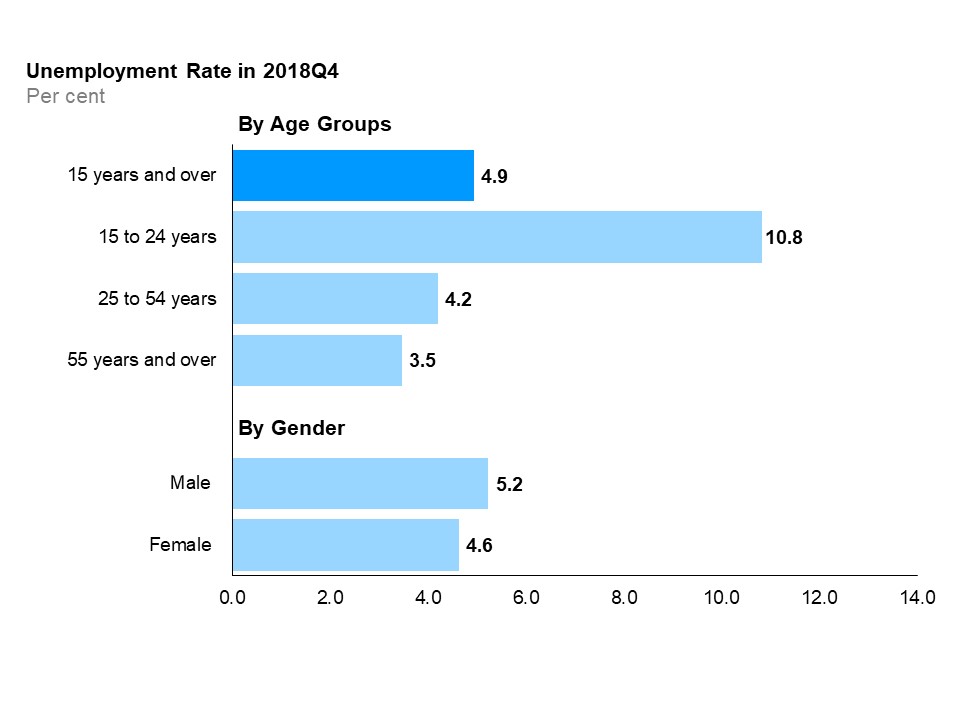
Compared to a year ago, the unemployment rate declined by 0.2 percentage point for males and by 0.1 percentage point for females. In the fourth quarter, the unemployment rate of youth was 10.8%, the highest among the three age groups. Compared to a year ago, unemployment rate declined for all age groups except for youth.
Participation rates by age group and gender
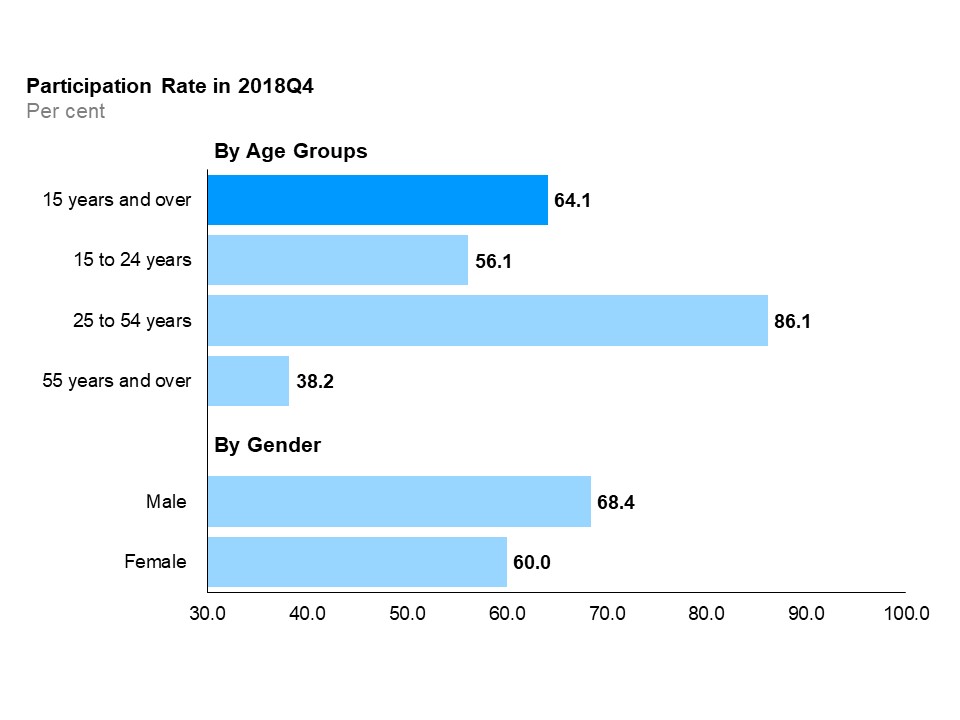
In the fourth quarter, core-aged workers had the highest participation rate at 86.1%, followed by youth at 56.1% and older workers at 38.2%. Compared to a year ago, the participation rate declined for all age groups, except for core-aged workers, which increased by 1.0 percentage point. The participation rates for males and females slightly declined compared to a year ago (0.3 and 0.7 percentage point, respectively).
Education level and immigrant status quarterly details
Employment rates by education level and immigrant status (core-aged population)
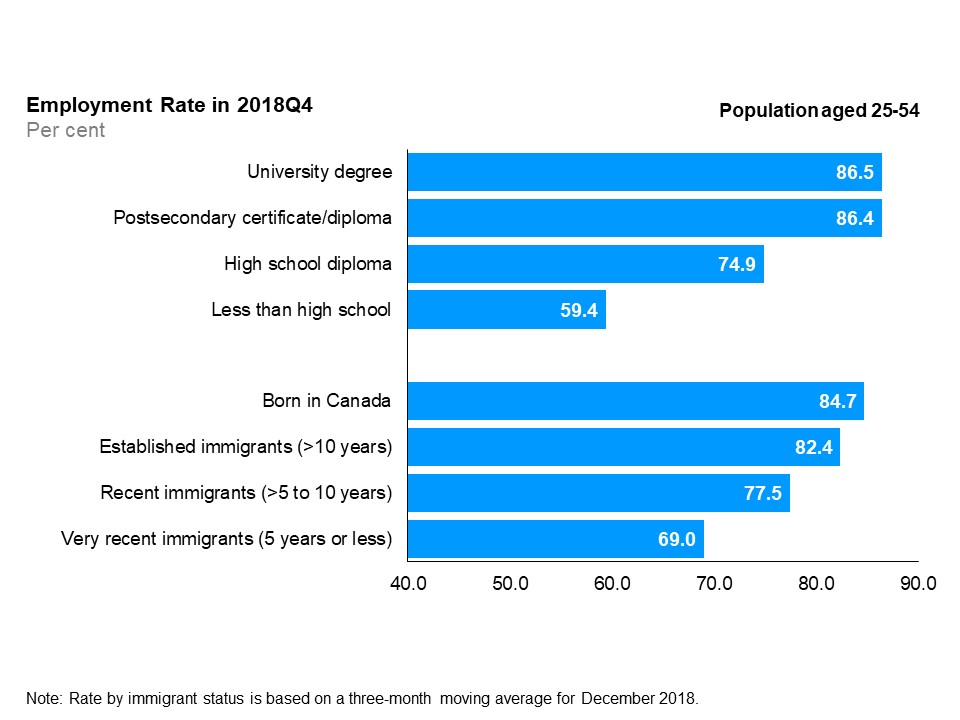
In the fourth quarter of 2018, persons without a high school diploma continued to hold the lowest employment rate among all groups (59.4%), while university degree holders recorded the highest employment rate (86.5%), but were followed closely by postsecondary certificate/diploma holders (86.4%).
Unemployment rates by education level and immigrant status (core-aged population)
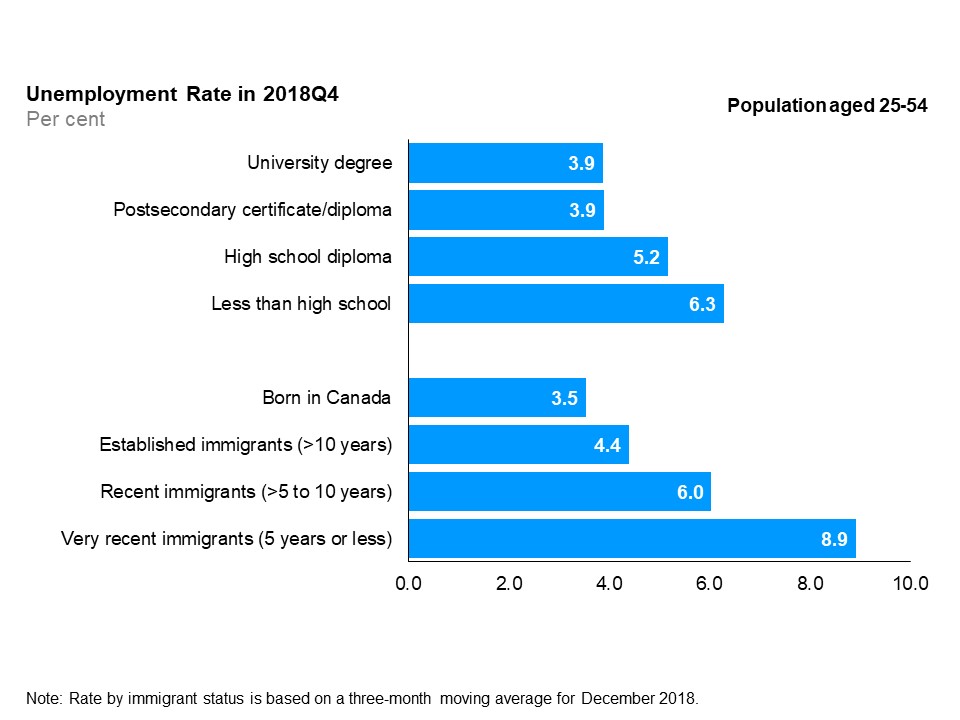
The unemployment rate declined, year-over-year, for core-aged persons without a high school diploma, as well as for those with postsecondary certificates/diplomas. Core-aged university degree and high school diploma holders both saw a 0.1 percentage point increase in their unemployment rates.
Participation rates by education level and immigrant status (core-aged population)
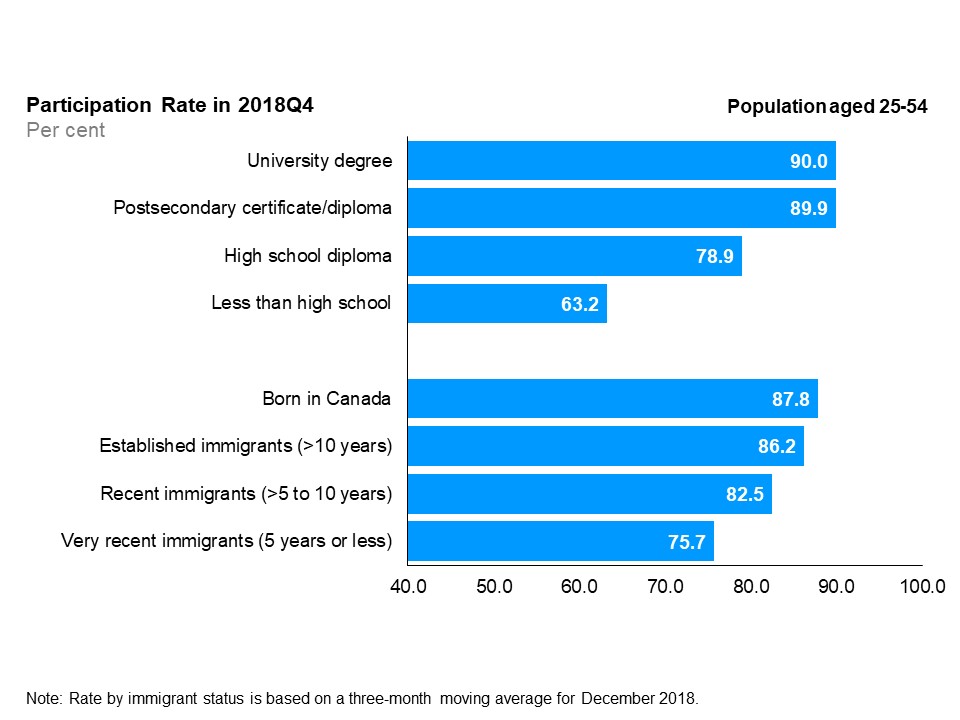
In the fourth quarter of 2018, core-aged recent immigrants (landed 5 to 10 years earlier) and very recent immigrants (landed 5 years or less) continued to have the lowest participation rates compared to established immigrants and those born in Canada, but their rates have improved, year-over-year, compared to the fourth quarter of 2017.
Wages quarterly details
Average hourly wages total, full-time and part-time employees
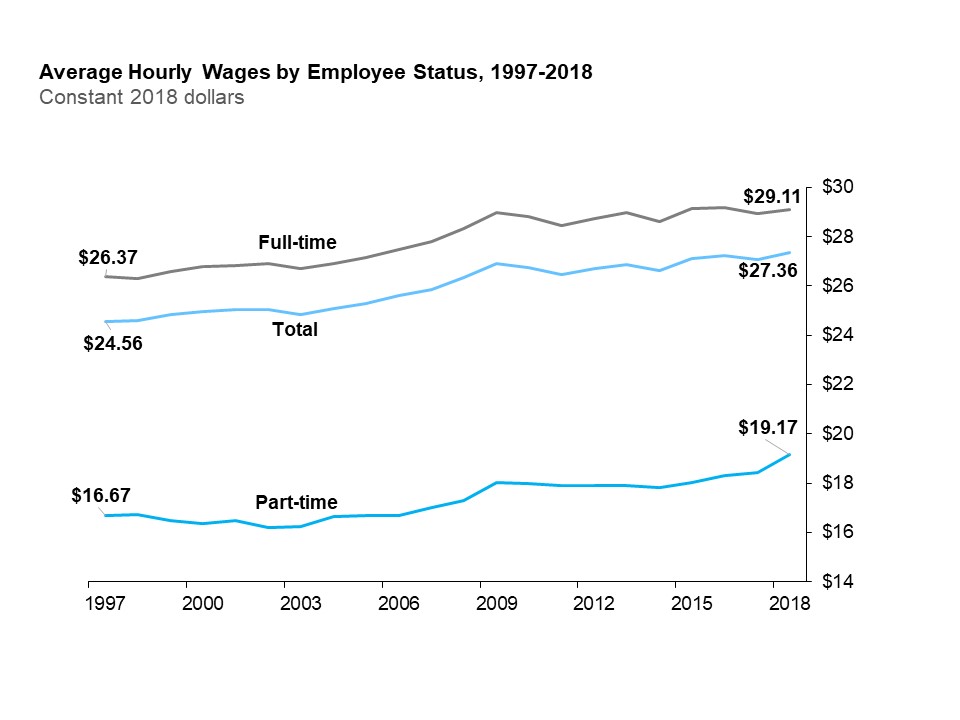
Over the last two decades, the average hourly wage increased in real terms
Hourly wage growth by type of work
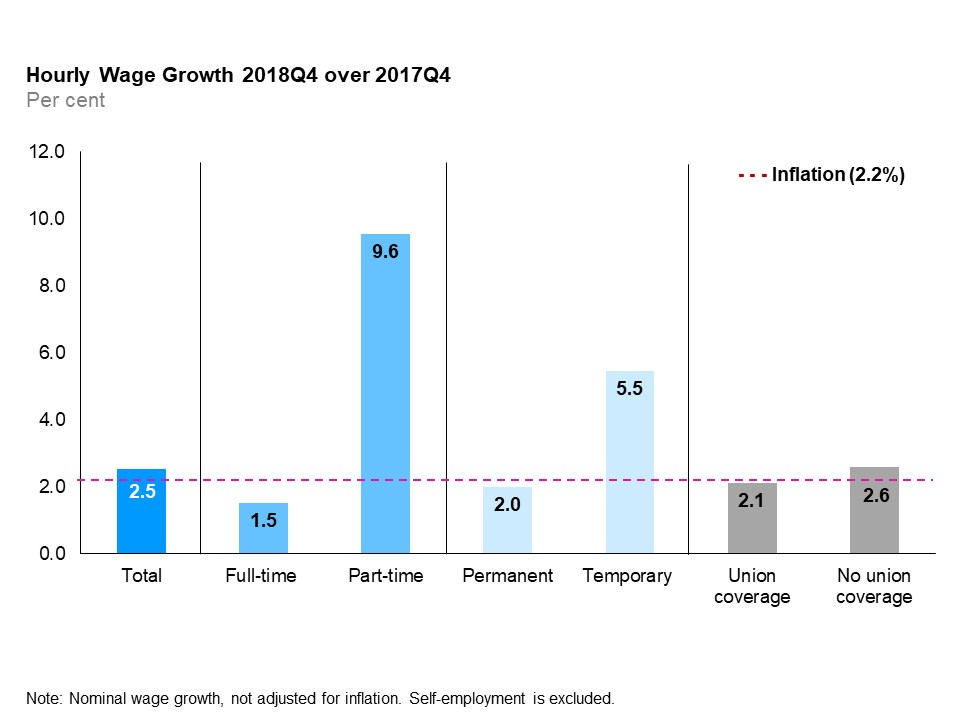
In the fourth quarter of 2018, the average hourly wage of Ontario employees was $27.48, an increase of 2.5% from the fourth quarter of 2017.
Average hourly wage rate and wage growth by occupational group
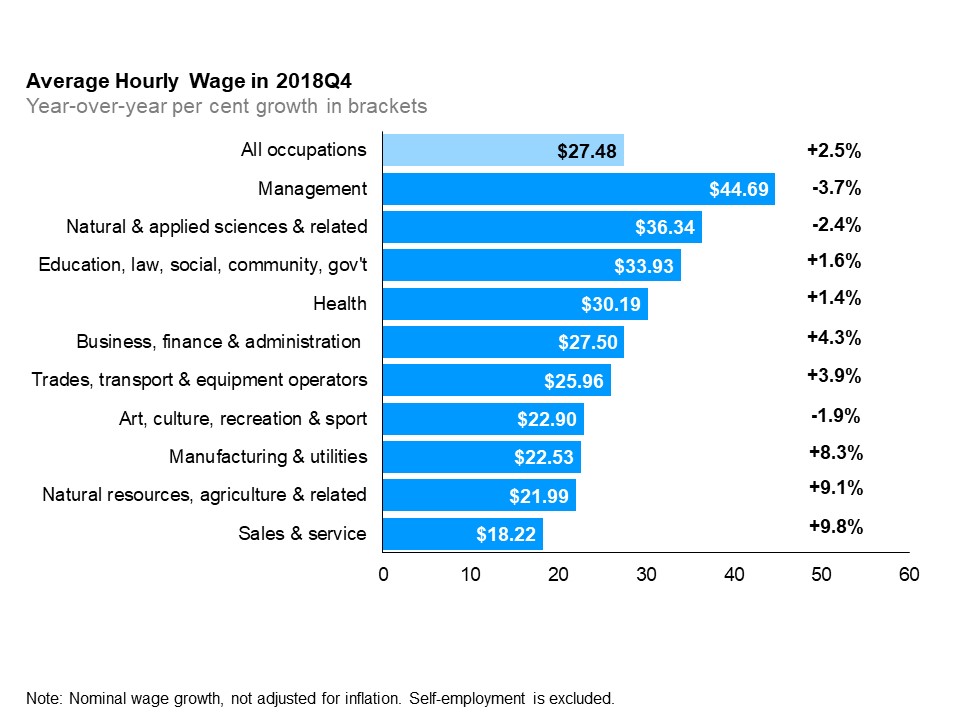
Employees in three broad occupational groups experienced the highest wage growth: sales and service (+9.8%), natural resources, agriculture and related occupations (+9.1%), and manufacturing and utilities (+8.3%).
Appendix
Overview of annual employment ten-year review
| 2009 | 2010 | 2011 | 2012 | 2013 | 2014 | 2015 | 2016 | 2017 | 2018 | |
|---|---|---|---|---|---|---|---|---|---|---|
| Total Labour Force (000) | 7,080.2 | 7,160.9 | 7,227.4 | 7,276.4 | 7,383.8 | 7,418.6 | 7,426.1 | 7,489.5 | 7,579.8 | 7,673.0 |
| Participation Rate (%) | 67.0 | 66.8 | 66.6 | 66.2 | 66.3 | 65.8 | 65.2 | 65.0 | 64.9 | 64.5 |
| Male Participation Rate (%) | 71.5 | 71.1 | 71.1 | 70.7 | 70.5 | 70.3 | 70 | 69.5 | 69.2 | 68.7 |
| Female Participation Rate (%) | 62.6 | 62.8 | 62.3 | 61.9 | 62.2 | 61.6 | 60.7 | 60.7 | 60.7 | 60.5 |
| Total Employment (000) | 6,432.7 | 6,537.8 | 6,658.4 | 6,702.6 | 6,823.4 | 6,877.9 | 6,923.2 | 6,999.6 | 7,128.0 | 7,242.4 |
| - Full-time (000) | 5,174.0 | 5,256.1 | 5,373.5 | 5,412.0 | 5,489.5 | 5,540.0 | 5,618.2 | 5,672.6 | 5,778.7 | 5,909.0 |
| - Part-time (000) | 1,258.7 | 1,281.8 | 1,284.8 | 1,290.6 | 1,334.0 | 1,337.9 | 1,305.0 | 1,327.0 | 1,349.3 | 1,333.4 |
| Employment-Population Ratio (%) | 60.9 | 61.0 | 61.4 | 60.9 | 61.2 | 61.0 | 60.8 | 60.7 | 61.0 | 60.9 |
| Male Employment (000) | 3,300.8 | 3,363.6 | 3,450.4 | 3,471.5 | 3,522.8 | 3,567.1 | 3,607.1 | 3,635.9 | 3,700.9 | 3,763.9 |
| Female Employment (000) | 3,131.9 | 3,174.2 | 3,207.9 | 3,231.1 | 3,300.6 | 3,310.8 | 3,316.1 | 3,363.7 | 3,427.1 | 3,478.5 |
| Part-Time (% of total) | 19.6 | 19.6 | 19.3 | 19.3 | 19.6 | 19.5 | 18.8 | 19.0 | 18.9 | 18.4 |
| Goods-Producing Sector Employment (000) | 1,365.0 | 1,380.6 | 1,408.7 | 1,415.3 | 1,397.5 | 1,382.0 | 1,401.4 | 1,418.1 | 1,432.6 | 1,453.1 |
| Services-Producing Sector Employment (000) | 5,067.7 | 5,157.3 | 5,249.7 | 5,287.3 | 5,425.9 | 5,495.9 | 5,521.7 | 5,581.4 | 5,695.4 | 5,789.2 |
| Private Sector Employment (000) | 4,194.7 | 4,268.2 | 4,339.7 | 4,373.0 | 4,447.0 | 4,517.0 | 4,540.7 | 4,597.3 | 4,690.6 | 4,740.6 |
| Public Sector Employment (000) | 1,232.8 | 1,254.7 | 1,294.3 | 1,286.0 | 1,314.0 | 1,305.4 | 1,294.1 | 1,306.4 | 1,329.1 | 1,376.7 |
| Self-Employment (% of total) | 15.6 | 15.5 | 15.4 | 15.6 | 15.6 | 15.3 | 15.7 | 15.7 | 15.5 | 15.5 |
| Total Unemployment (000) | 647.5 | 623.1 | 569.1 | 573.8 | 560.3 | 540.7 | 502.9 | 489.9 | 451.8 | 430.7 |
| Unemployment Rate (%) | 9.1 | 8.7 | 7.9 | 7.9 | 7.6 | 7.3 | 6.8 | 6.5 | 6 | 5.6 |
| Male Unemployment Rate (%) | 10.5 | 9.4 | 8.2 | 8.3 | 8 | 7.5 | 7 | 6.8 | 6.2 | 5.6 |
| Female Unemployment Rate (%) | 7.7 | 8 | 7.6 | 7.5 | 7.2 | 7.1 | 6.5 | 6.3 | 5.7 | 5.6 |
| Long-Term (27 wks+) (% of total) | 18.8 | 24.9 | 24.1 | 22.7 | 22.9 | 22.8 | 20 | 19.9 | 19.5 | 16.9 |
| Average Unemployment in Weeks | 18.4 | 22 | 22.4 | 22.2 | 21.8 | 22.4 | 20 | 19.9 | 19.3 | 17.2 |
| Youth Unemployment Rate (%) | 17.6 | 17.4 | 15.9 | 17.0 | 16.2 | 15.7 | 14.7 | 14.0 | 12.3 | 11.9 |
| 25-54 y.o. Unemployment rate (%) | 7.8 | 7.3 | 6.5 | 6.4 | 6.2 | 5.9 | 5.6 | 5.4 | 5.0 | 4.7 |
| 55+ y.o. Unemployment rate (%) | 6.6 | 6.4 | 6.0 | 5.8 | 5.5 | 5.3 | 4.9 | 4.9 | 4.5 | 4.2 |
| Average Weekly Wage Rate ($) | 828.35 | 842.35 | 862.45 | 883.12 | 895.56 | 907.17 | 938.09 | 958.5 | 967.44 | 1001.74 |
| Average Hourly Wage Rate ($) | 22.66 | 23.09 | 23.55 | 24.09 | 24.48 | 24.82 | 25.59 | 26.15 | 26.43 | 27.36 |
Employment by region (000)
| 2009 | 2010 | 2011 | 2012 | 2013 | 2014 | 2015 | 2016 | 2017 | 2018 | |
|---|---|---|---|---|---|---|---|---|---|---|
| Greater Toronto Area | 2,963.0 | 3,034.6 | 3,077.8 | 3,112.3 | 3,240.2 | 3,241.1 | 3,320.4 | 3,373.2 | 3,442.9 | 3,521.6 |
| Central | 1,487.7 | 1,508.1 | 1,552.0 | 1,551.4 | 1,559.5 | 1,597.2 | 1,597.5 | 1,598.0 | 1,655.2 | 1,656.9 |
| Southwestern | 752 | 761.7 | 771.1 | 772.9 | 769.4 | 775 | 770.5 | 775.8 | 778.4 | 794.3 |
| Eastern | 879.2 | 879.6 | 897 | 908.7 | 898.4 | 907.9 | 889.2 | 904.9 | 903.4 | 916 |
| Northern | 350.8 | 354 | 360.4 | 357.3 | 355.9 | 356.6 | 345.5 | 347.7 | 348.2 | 353.6 |
Unemployment rate by region (%)
| 2009 | 2010 | 2011 | 2012 | 2013 | 2014 | 2015 | 2016 | 2017 | 2018 | |
|---|---|---|---|---|---|---|---|---|---|---|
| Greater Toronto Area | 9.6 | 9.2 | 8.4 | 8.8 | 8.2 | 8 | 7.1 | 6.9 | 6.4 | 6.1 |
| Central | 9.1 | 8.4 | 7.4 | 7 | 6.9 | 6.2 | 5.9 | 5.9 | 5.3 | 5.2 |
| Southwestern | 10.3 | 9.1 | 8.1 | 7.8 | 7.7 | 7 | 6.9 | 6.1 | 5.6 | 5.2 |
| Eastern | 6.8 | 7.2 | 6.7 | 6.6 | 6.6 | 7 | 6.7 | 6.4 | 5.7 | 4.9 |
| Northern | 9 | 8.3 | 7.8 | 7.2 | 7.4 | 6.6 | 7.2 | 7.1 | 6.4 | 5.8 |
Total employment by CMA (000)
Greater Toronto Area
| 2009 | 2010 | 2011 | 2012 | 2013 | 2014 | 2015 | 2016 | 2017 | 2018 | |
|---|---|---|---|---|---|---|---|---|---|---|
| Toronto | 2,817.0 | 2,880.3 | 2,923.4 | 2,960.6 | 3,092.1 | 3,087.4 | 3,176.7 | 3,215.0 | 3,289.6 | 3,353.0 |
| Oshawa | 175.1 | 184.3 | 189 | 190 | 194.5 | 201.4 | 196.4 | 214 | 210.4 | 220.6 |
Central Ontario
| 2009 | 2010 | 2011 | 2012 | 2013 | 2014 | 2015 | 2016 | 2017 | 2018 | |
|---|---|---|---|---|---|---|---|---|---|---|
| Hamilton | 369.8 | 369.1 | 375.1 | 376.6 | 374.8 | 383.7 | 385.4 | 385.8 | 417.9 | 413.8 |
| Kitchener | 250.7 | 258.1 | 270.5 | 271.6 | 278.9 | 283.1 | 279.8 | 281.6 | 287.8 | 292.2 |
| St. Catharines-Niagara | 186.3 | 190.4 | 196.1 | 201.8 | 193.5 | 195.4 | 204.1 | 203.1 | 197.6 | 201.7 |
| Peterborough | 58.5 | 56.6 | 57.6 | 58.5 | 54.9 | 60.5 | 61.2 | 59.5 | 61.2 | 63.6 |
| Brantford | 68.6 | 67.4 | 68.5 | 67.5 | 68.9 | 68.6 | 69.3 | 70.2 | 72.3 | 70 |
| Guelph | 79.1 | 79.2 | 82 | 83.9 | 79.8 | 81.8 | 90.5 | 90.6 | 90.8 | 88.8 |
| Barrie | 90.3 | 99.1 | 101.5 | 102.3 | 109.4 | 111.6 | 108.4 | 104.2 | 115.6 | 114.6 |
Eastern Ontario
| 2009 | 2010 | 2011 | 2012 | 2013 | 2014 | 2015 | 2016 | 2017 | 2018 | |
|---|---|---|---|---|---|---|---|---|---|---|
| Ottawa | 500.4 | 515.3 | 517.4 | 535.4 | 523.5 | 533.8 | 531.1 | 543.4 | 546.7 | 557.6 |
| Kingston | 79.2 | 76.7 | 79.3 | 80.6 | 82.6 | 81.4 | 82.9 | 83.6 | 87.3 | 86.4 |
Southwestern Ontario
| 2009 | 2010 | 2011 | 2012 | 2013 | 2014 | 2015 | 2016 | 2017 | 2018 | |
|---|---|---|---|---|---|---|---|---|---|---|
| London | 238.8 | 239.6 | 237.7 | 242.3 | 240.4 | 243 | 252 | 245.9 | 245.8 | 252.9 |
| Windsor | 146.4 | 147.5 | 147.9 | 153.3 | 154.8 | 155.2 | 158 | 164.1 | 162.8 | 164.5 |
Northern Ontario
| 2009 | 2010 | 2011 | 2012 | 2013 | 2014 | 2015 | 2016 | 2017 | 2018 | |
|---|---|---|---|---|---|---|---|---|---|---|
| Sudbury | 79.8 | 80.7 | 82.1 | 80.8 | 83.3 | 83.1 | 82.3 | 81.7 | 81.1 | 81.4 |
| Thunder Bay | 60 | 60.2 | 60.3 | 61.8 | 62.8 | 61.5 | 59.7 | 60.1 | 61.5 | 63.7 |
Overview of quarterly employment year-over-year
| 2017q1 | 2018q1 | 2017q2 | 2018q2 | 2017q3 | 2018q3 | 2017q4 | 2018q4 | |
|---|---|---|---|---|---|---|---|---|
| Total Labour Force (000) | 7,458.6 | 7,510.5 | 7,602.6 | 7,717.1 | 7,658.9 | 7,782.4 | 7,598.9 | 7,682.1 |
| Participation Rate (%) | 64.2 | 63.6 | 65.2 | 65 | 65.4 | 65.2 | 64.6 | 64.1 |
| Male Participation Rate (%) | 68.6 | 67.5 | 69.6 | 69.1 | 69.9 | 69.6 | 68.8 | 68.4 |
| Female Participation Rate (%) | 60 | 59.8 | 61 | 61.1 | 61.1 | 61.1 | 60.7 | 60.0 |
| Total Employment (000) | 6,972.0 | 7,082.3 | 7,129.7 | 7,269.2 | 7,197.0 | 7,315.2 | 7,213.4 | 7,302.7 |
| - Full-time (000) | 5,583.5 | 5,707.7 | 5,799.3 | 5,970.2 | 5,913.7 | 6,049.1 | 5,818.4 | 5,909.0 |
| - Part-time (000) | 1,388.5 | 1,374.7 | 1,330.4 | 1,299.0 | 1,283.3 | 1,266.0 | 1,394.9 | 1,393.7 |
| Employment-Population Ratio (%) | 60 | 60 | 61.2 | 61.2 | 61.5 | 61.3 | 61.4 | 60.9 |
| Male Employment (000) | 3,614.0 | 3,653.6 | 3,700.2 | 3,773.8 | 3,758.8 | 3,833.8 | 3,730.9 | 3,794.3 |
| Female Employment (000) | 3,358.0 | 3,428.7 | 3,429.5 | 3,495.4 | 3,438.2 | 3,481.3 | 3,482.5 | 3,508.4 |
| Part-Time (% of total) | 19.9 | 19.4 | 18.7 | 17.9 | 17.8 | 17.3 | 19.3 | 19.1 |
| Goods-Producing Sector Employment (000) | 1,368.0 | 1,406.8 | 1,424.9 | 1,451.7 | 1,472.2 | 1,491.0 | 1,465.2 | 1,463.0 |
| Services-Producing Sector Employment (000) | 5,604.1 | 5,675.6 | 5,704.7 | 5,817.5 | 5,724.8 | 5,824.2 | 5,748.2 | 5,839.7 |
| Private Sector Employment (000) | 4,561.5 | 4,620.0 | 4,666.5 | 4,756.9 | 4,789.5 | 4,810.7 | 4,744.9 | 4,774.8 |
| Public Sector Employment (000) | 1,332.9 | 1,352.3 | 1,351.3 | 1,396.9 | 1,285.1 | 1,373.5 | 1,347.1 | 1,385.1 |
| Self-Employment (% of total) | 15.5 | 15.7 | 15.6 | 15.4 | 15.6 | 15.5 | 15.5 | 15.6 |
| Total Unemployment (000) | 486.6 | 428.2 | 473 | 447.9 | 462 | 467.2 | 385.5 | 379.4 |
| Unemployment Rate (%) | 6.5 | 5.7 | 6.2 | 5.8 | 6 | 6 | 5.1 | 4.9 |
| Male Unemployment Rate (%) | 7 | 6.1 | 6.5 | 5.8 | 5.9 | 5.5 | 5.4 | 5.2 |
| Female Unemployment Rate (%) | 6 | 5.2 | 5.9 | 5.8 | 6.2 | 6.6 | 4.7 | 4.6 |
| Long-Term (27 wks+) (% of total) | 20.3 | 16.5 | 19 | 17.1 | 18.2 | 16.9 | 20.4 | 17.2 |
| Average Unemployment in Weeks | 20.4 | 17.3 | 18.9 | 17.5 | 17.9 | 16.8 | 20.2 | 17.5 |
| Youth Unemployment Rate (%) | 14.7 | 11.8 | 13.3 | 12.9 | 11.3 | 12.1 | 10.1 | 10.8 |
| 25-54 y.o. Unemployment rate (%) | 5.3 | 4.7 | 5.1 | 4.7 | 5.4 | 5.2 | 4.4 | 4.2 |
| 55+ y.o. Unemployment rate (%) | 5.3 | 5 | 4.7 | 4.2 | 4.1 | 4.1 | 3.9 | 3.5 |
| Average Weekly Wage Rate ($) | 957.27 | 994.55 | 962.03 | 1,007.28 | 970.13 | 1,004.23 | 979.94 | 1,000.71 |
| Average Hourly Wage Rate ($) | 26.34 | 27.28 | 26.28 | 27.43 | 26.28 | 27.26 | 26.8 | 27.48 |
Employment by Region (000)
| 2017q1 | 2018q1 | 2017q2 | 2018q2 | 2017q3 | 2018q3 | 2017q4 | 2018q4 | |
|---|---|---|---|---|---|---|---|---|
| Greater Toronto Area (GTA) | 3352.9 | 3466.6 | 3442.6 | 3538.8 | 3466.2 | 3535.7 | 3509.9 | 3545.4 |
| Central | 1602.7 | 1598.5 | 1665.5 | 1646.6 | 1695.9 | 1686.1 | 1656.4 | 1696.3 |
| Southwestern | 768.4 | 775.2 | 772.9 | 801.3 | 782.8 | 810.3 | 789.5 | 790.3 |
| Eastern | 914.1 | 905.4 | 897.6 | 924.4 | 893.8 | 917.9 | 908.2 | 916.1 |
| Northern | 333.9 | 336.6 | 351.0 | 358.0 | 358.3 | 365.4 | 349.3 | 354.5 |
Unemployment Rate by Region (%)
| 2017q1 | 2018q1 | 2017q2 | 2018q2 | 2017q3 | 2018q3 | 2017q4 | 2018q4 | |
|---|---|---|---|---|---|---|---|---|
| Greater Toronto Area (GTA) | 7 | 5.7 | 6.7 | 6.4 | 6.4 | 6.6 | 5.4 | 5.5 |
| Central | 6.1 | 5.8 | 5.5 | 5.5 | 5.1 | 5.5 | 4.5 | 4.1 |
| Southwestern | 6.1 | 5.9 | 5.5 | 5 | 5.5 | 5.5 | 5.1 | 4.4 |
| Eastern | 5.3 | 5 | 6.4 | 4.8 | 6.5 | 5.1 | 4.8 | 4.6 |
| Northern | 7.7 | 6.6 | 6.3 | 5.9 | 6.5 | 5.5 | 5.3 | 5.5 |
Total Employment by CMA (000)
Greater Toronto Area
| 2017q1 | 2018q1 | 2017q2 | 2018q2 | 2017q3 | 2018q3 | 2017q4 | 2018q4 | |
|---|---|---|---|---|---|---|---|---|
| Toronto | 3204.7 | 3305.7 | 3289.1 | 3363.4 | 3313.7 | 3361.9 | 3351.0 | 3380.9 |
| Oshawa | 204.6 | 211.9 | 213.6 | 228.6 | 212.2 | 222.4 | 211.0 | 219.5 |
Central Ontario
| 2017q1 | 2018q1 | 2017q2 | 2018q2 | 2017q3 | 2018q3 | 2017q4 | 2018q4 | |
|---|---|---|---|---|---|---|---|---|
| Hamilton | 396.5 | 407.7 | 419.3 | 414.3 | 432.4 | 412.4 | 423.3 | 420.7 |
| Kitchener | 282.0 | 276.6 | 291.2 | 286.5 | 290.5 | 303.1 | 287.4 | 302.3 |
| St. Catharines-Niagara | 191.0 | 195.4 | 198.8 | 204.4 | 202.2 | 205.1 | 198.5 | 201.8 |
| Peterborough | 60.4 | 59.5 | 61.0 | 62.0 | 62.5 | 66.3 | 61.0 | 66.5 |
| Brantford | 72.4 | 70.8 | 69.3 | 68.5 | 72.6 | 68.9 | 74.9 | 71.8 |
| Guelph | 88.7 | 87.0 | 92.0 | 86.8 | 91.3 | 88.6 | 91.0 | 92.9 |
| Barrie | 109.8 | 106.3 | 117.3 | 112.3 | 117.3 | 120.9 | 117.9 | 119.1 |
Eastern Ontario
| 2017q1 | 2018q1 | 2017q2 | 2018q2 | 2017q3 | 2018q3 | 2017q4 | 2018q4 | |
|---|---|---|---|---|---|---|---|---|
| Ottawa (Ontario part) | 547.9 | 552.3 | 548.4 | 567.2 | 540.6 | 557.3 | 550 | 553.7 |
| Kingston | 85 | 85.5 | 88.6 | 87.3 | 87.4 | 87.9 | 88 | 85.1 |
Southwestern Ontario
| 2017q1 | 2018q1 | 2017q2 | 2018q2 | 2017q3 | 2018q3 | 2017q4 | 2018q4 | |
|---|---|---|---|---|---|---|---|---|
| London | 246 | 245.8 | 251.6 | 257.9 | 242.9 | 260.3 | 242.5 | 247.8 |
| Windsor | 157.6 | 160.9 | 161.2 | 164.2 | 168.1 | 163.7 | 164.3 | 169.1 |
Northern Ontario
| 2017q1 | 2018q1 | 2017q2 | 2018q2 | 2017q3 | 2018q3 | 2017q4 | 2018q4 | |
|---|---|---|---|---|---|---|---|---|
| Sudbury | 79.1 | 78 | 81 | 80.8 | 82.2 | 82.2 | 82.1 | 84.6 |
| Thunder Bay | 59.3 | 62.2 | 62.1 | 65.7 | 63.4 | 65.3 | 61.2 | 61.7 |
Note: All estimates in this appendix are based on Statistics Canada’s Labour Force Survey.
Footnotes
- footnote[1] Back to paragraph This economic region closely matches the GTA, the main exception being that it excludes the city of Burlington.
- footnote[2] Back to paragraph Real wages are based on nominal wages deflated by the Consumer Price Index (CPI) for all items. Inflation in 2018 is based on a year-to-date average from January to November. Self-employment is excluded.
- footnote[3] Back to paragraph Year-over-year comparison (between fourth quarters of 2017 and 2018) is in nominal dollars.
- footnote[4] Back to paragraph Measured as an increase in the all-items Consumer Price Index for Ontario between October and November of 2017 and October and November of 2018.