The content on this page is no longer up to date. It will remain on ontario.ca for a limited time before it moves to the Archives of Ontario.
Examples of Toxic Substance accounting Requirements for Various Manufacturing Industries
We’ve made changes to the Toxics Reduction Program to eliminate duplication with the federal government’s Chemicals Management Plan, (under the Canadian Environmental Protection Act, 1999) and reduce burden for industry.
On December 31, 2021, the Toxics Reduction Act, 2009 will be repealed and its associated regulations revoked, ending the Toxics Reduction Program. Until this time, facilities must continue to meet the requirements of the Toxics Reduction Act, 2009 and its associated regulations.
As a result of regulatory changes, facilities no longer need to prepare new toxic substance reduction plans or review their existing plans. Facilities with existing plans are still required to report annually on substances included in their plans that meet the thresholds.
The ministry is currently updating this Toolkit for Toxic Substance Accounting to reflect the legislative and regulatory changes. The updated version will be provided shortly.
The following subsection (7.1 to 7.5) provides example records for various industrial processes that use and create substances, including descriptions of stages and processes, process flow diagrams, tracking and quantification, description of quantification methods and rationale for the best available method, input/output balance, comments on whether the input/output balance is approximately equal and where the balance is not approximately equal, a discussion as to why it is not equal and whether the discrepancy is acceptable. The textual description provided in the records are intended to be detailed for guidance purposes but the level of detail is left to the discretion of the facility to determine.
7.1 Example 1: Plastic Extrusion Operation
Examples 1-1 to 1-3 provide examples of all the components of toxic substance accounting for a fictional plastic extrusion operation.
Example 1-1: Illustration Showing Stages and Processes of a Plastics Extrusion Operation (describing Methanol)
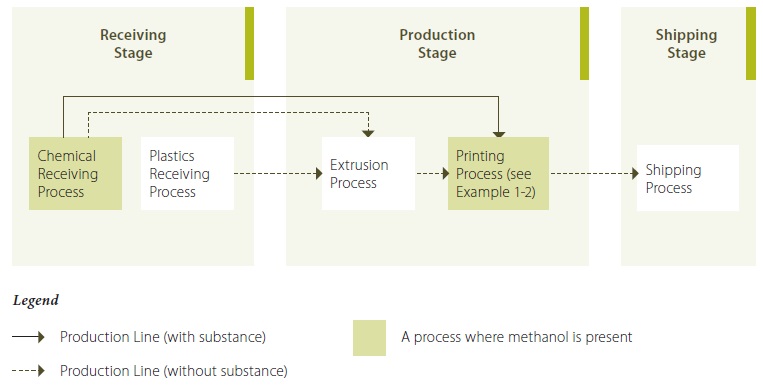
Example 1-1 Description:
At the receiving stage, plastics and other chemicals are received (at the plastics receiving process and the chemical receiving process, respectively). Plastics and other chemicals are transfered to the extrusion process of the production stage. Extruding machines melt the plastic and other additives (such as colorants) and extrude it into plastic bags of varying sizes and thicknesses, according to customers’ specifications.
The plastic bags are then transfered to the printing process, which uses solvent-based inks and coatings to print various characters on the plastic bags, again, according to customers’ specifications. Methanol is a constituent of the ink used in the printing process. The final product (the plastic bags with printed characters on it) enters the shipping process of the shipping stage, where it is sent to various customers.
Example 1-2: Detailed Process Flow Diagram – Methanol in Printing Process
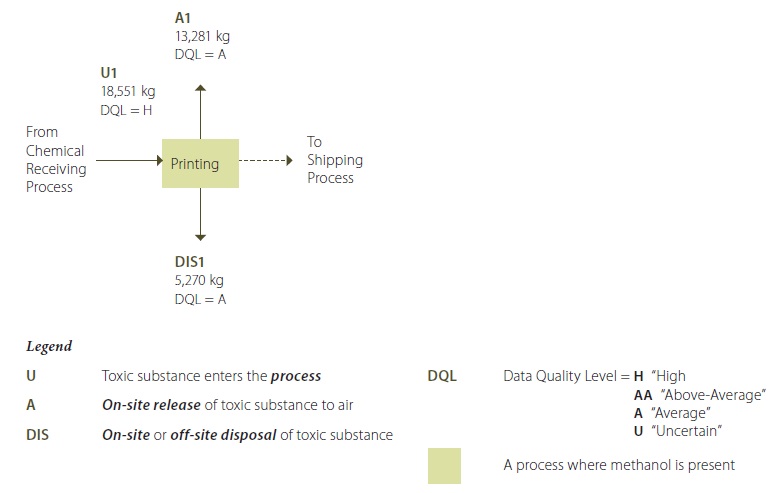
Example 1-2 Description:
Methanol is present in the inks and solvents used in the printing process transfered from the chemical receiving process (U1). Methanol is the carrier solvent in the ink, and is present at a 25% concentration in the ink purchased from the supplier. Ink is sprayed into extruded parts using an ink-jet printer. After each shift, the printer head and print-head area is cleaned up, by a manual cleaning operation. The cleaning solvent consists of 99% methanol. Operators use rags with pure methanol for this cleaning operation. Methanol is highly volatile, and much of it is released on-site as an air emission from the exhaust vents in the printing area (A1). Waste methanol-ink sludge and methanol-contaminated rags are disposed of in a drum, and periodically shipped off-site for disposal as hazardous waste using a licenced waste hauler (DIS1).
**Note that the quantification values shown in this process flow diagram are annual values.
Example 1-3: Sample For Tracking & Quantification
Amount that Enters the Process: U1
(i.e. methanol entering the printing process from chemical receiving process)
Quantification Method:
Source-specific information (MSDS containing methanol concentrations in, and densities of, ink and cleaning solvent)
Inventory records (quantities of ink and cleaning solvent used in 2010)
Best Available Method Rationale: Methanol concentrations and product densities
MSDS information showing constituent concentrations and product density is a source of data that is highly reliable. No other alternatives were identified during the evaluation of best available methods that would yield a higher level of data quality/reliability. MSDS records are a common method of obtaining highly reliable data in a cost effective manner, and in no situations that this facility is aware of would another alternative be recommended to provide a higher level of data reliability.
Ink and cleaning solvent quantities
Quantities of ink and cleaning solvent that are used in the process are recorded by operating and maintenance personnel. These values are cross- checked with purchasing and inventory records. This data is therefore considered to be very reliable. Alternative methods that might yield more reliable data were considered, including an automated process (i.e. continuous monitoring) for tracking the quantities of ink and cleaning solvent that enter the process. With respect to the cleaning solvent, the former alternative is not technically feasible since the cleaning is done by hand. With respect to the ink quantities used, an automated process was determined to be cost prohibitive given the significant equipment changes/updates/additions required, and would yield only a nominal increase in data reliability.
Calculations (intended for guidance purposes only; not required by regulation):
Ink:
Methanol concentration (% w/w): 25 (MSDS – provided 10 –30% range)
Total ink used (L): 62695 (Operator usage records for 2010)
Ink Density (kg/L): 0.95(MSDS)
Total Methanol in Ink (kg): 14890 (methanol concentration × total ink used × ink density)
Cleaning Solvent:
Methanol concentration (% w/w): 99 (MSDS)
Cleaning solvent used (L): 4510 (Maintenance usage records for 2010)
Cleaning solvent density (kg/L): 0.82 (MSDS)
Total methanol in solvent (kg): 3661 (methanol concentration × total solvent used × solvent density)
(i.e. 99% × 4510 L × 0.82 kg/L)
Total methanol used in process (kg): 18551 (total methanol in ink + total methanol in solvent)
U1: Total Amount of Methanol that Enters the Printing Process in 2010 (kg) 18,551
Input/Output Balance (intended for guidance purposes only; not required by regulation):
Use + Creation = Transformed + Destroyed + Contained in Product + On-site or Off-site Release (to Air, Land, Water) + Off-site Transfers (for Treatment, Recycling)
U1 = A1 + DIS1
18551 kg = 13821 kg + 5270 kg
18551 kg = 18551 kg
Unaccounted material: 0 kg
Comment on Input/Output Balance Results:
After investigating the input/output balance results, no missing sources of data were found, and no calculation errors were found. The input/ouput balance is zero in this case, because the air emissions portion (A1) is assumed to be the difference between the amount input from the chemical receiving process (U1) and the amount transferred off-site for recycling (TR1) (i.e. a mass balance calculation was used in the input/output balance). Because methanol is a volatile compound, it is reasonable to assume that there is no remaining methanol present in the finished product. The amount disposed of off-site is based on the total amount of material shipped off-site shown on waste manifests, and an average concentration of methanol in the waste, as determined by analysis for waste characterization purposes.
Therefore, given the variation in data quality of the values used in the input/output balance, the input/output balance results are considered to be reasonable and acceptable. In the coming years, the facility will continue to look for alternate methodologies that provide more reliable data for calculating A1 other than by the current best available method of mass balance, and will evaluate and implement these methodologies in accordance with the Act and regulation in the future.
7.2 Example 2: Gold Ore Processing Operation
Examples 2-1 to 2-4 provide examples of all the components of toxic substance accounting for a fictional gold ore processing operation.
Example 2-1: Illustration Showing Stages and Processes of a Gold Ore Processing Operation (describing Ionic Cyanides)
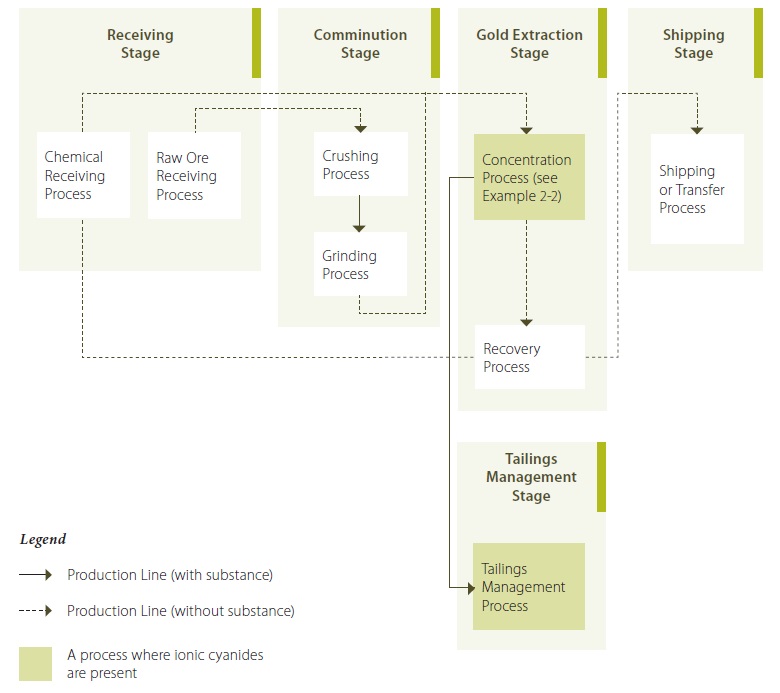
Example 2-1 Description:
During the chemical receiving process of the receiving stage, cyanide is received as solid briquettes of sodium cyanide (i.e. a salt in ionic form). The sodium cyanide briquettes are contained in boxes or bins that arrive by rail and truck, and are transferred via forklift to a dry, covered storage area. At the raw ore receiving process, raw ore is transfered using open trucks to the receiving area, where it enters the comminution stage and undergoes crushing and grinding by mechanical means, during the crushing process and grinding process, respectively, to reduce the ore’s particle size for use in subsequent processes. During the concentration process of the gold extraction stage, the cyanide salt is first added to water to create an aqueous solution containing cyanide ions. The ground ore is also liquified by adding water to create a slurry, in a series of tanks refered to as leach tanks. The ionic cyanide solution is added to the leach tanks containing the slurry. Ionic cyanide binds with the gold to create a dissolved metal-cyanide complex within the slurry. This dissolved gold-cyanide complex is adsorbed out of the slurry by the subsequent activated carbon tanks through which the slurry is passed. At this point, the waste slurry is separated from the gold-loaded carbon using screens and is transferred to cyanide treatment, where the bulk of the ionic cyanide in the waste slurry is converted into cyanate via an oxidation process. The gold-loaded carbon is transferred to a vessel where the gold is stripped from the carbon using a chemical solution. The chemical solution from the stripping activity is transferred to the recovery process, where the gold is precipitated out of the solution by passing the solution through electrowinning cells. The precipitated gold is then washed with solution to remove it from the electrowinning cells and the gold-containing solution is dried (or dewatered) to remove the excess solution. The dewatered gold is heated in a furnace to melt it, and is poured into moulds. Once cooled and solidified, the gold is removed from the moulds and enters the shipping stage, where it is stored, and shipped off-site.
The cyanide-treated waste slurry from the concentration process are transferred to the tailings management process, where the tailings are collected in a tailings pond for further treatment. The small concentrations of ionic cyanide that may remain in the tailings emerging from the cyanide treatment activity are further reduced in the tailings pond via natural attenuation reactions.
In 2010, the gold ore processing operation ran essentially all year round, 24 hours per day, 7 days per week. The cyanide treatment activity in the concentration process ran for six months (the coolest months of the year). During the remaining six warmer months, the waste slurry collected from the activated carbon tanks was transfered directly to the tailings management process, since the warm, sunny conditions allowed for adequate destruction of the ionic cyanide from natural attenuation, without the need to use the cyanide treatment beforehand.
Example 2-2: Process Flow Diagram – Ionic Cyanides in Concentration Process of Gold Ore Processing Operation
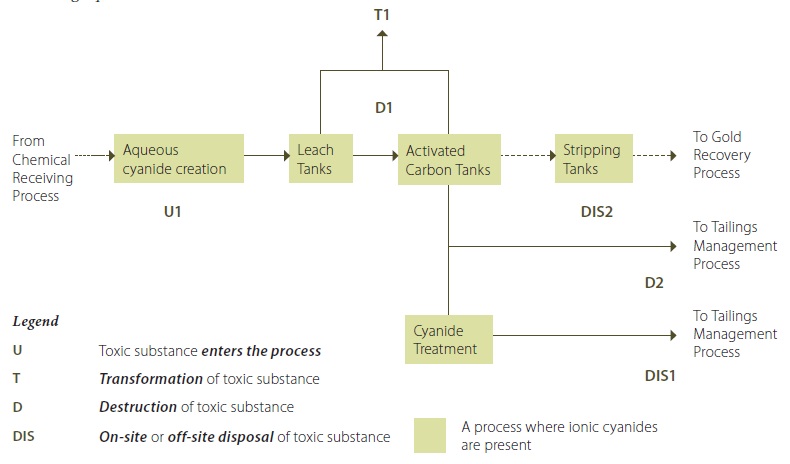
Example 2-2 Description:
Sodium Cyanide (as an ionic cyanide) is added to water to create an aqueous ionic cyanide solution (U1). This ionic cyanide solution is added to the raw ore slurry leach tanks. Some of the ionic cyanide bonds with the gold to form aurocyanide in solution. The ionic cyanide that bonds with gold to form aurocyanide is considered to be destroyed. The slurry mixture coming out of the leach tanks (containing water, ground ore, ionic cyanide and aurocyanide (D1) is transferred to activated carbon tanks, where the aurocyanide is adsorbed onto the activated carbon. The slurry in the leach tanks and activated carbon tanks is maintained at a pH of greater than 12 by adding lime to the tanks. This largely avoids the transformation of ionic cyanide to hydrogen cyanide that is released to the air from these activities (T1) (although by nature of the chemical reaction, it is less likely to have zero releases of hydrogen cyanide; however, reducing these releases to less than 1% is possible). The gold-loaded carbon from the activated carbon tanks is then transferred to stripping vessels where the gold is removed from the carbon into a solution. The gold solution is then transfered to the recovery process. The spent ore slurry containing the remaining ionic cyanide from the activated carbon tanks is routed to a cyanide treatment area during the coldest six months of 2010. In the cyanide treatment area, most of the ionic cyanide is destroyed by being converted into cyanate (D2). The treated spent ore slurry, containing the destroyed cyanide along with a small quantity of untreated ionic cyanide, is transferred to the tailings management process (DIS1). During the warmest six months of 2010, the spent ore slurry from the activated carbon tanks was transfered directly to the tailings management process, bypassing the cyanide treatment area (DIS2).
Example 2-3: Sample for Tracking & Quantification
Amount that Enters the Process: U1
(i.e. creation of ionic cyanide from introduction of sodium cyanide into solution)
Quantification Method:
Direct measurement of sodium cyanide added to process
Assume that, once in solution, all cyanide is present as ionic cyanide (reasonable assumption since pH above 11 is maintained throughout process)
Best Available Method Rationale: Sodium Cyanide quantity
The quantity of sodium cyanide that is introduced into solution is tracked and recorded by facility personnel. These values are cross-checked with inventory records for quality control on a weekly basis. This site-specific method is therefore considered to be of very high quality. Alternative methods that might yield more reliable data were considered, including:
- an automated process for tracking these quantities
- more frequent cross-checking.
The former alternative was not chosen because of economic and technical achievability limitations (i.e. designing and implementing site-specific continuous monitoring equipment for our facility’s particular operational equipment configuration), particularly considering the high level of data quality already being achieved. The latter alternative has already been evaluated and implemented in previous years, and the current frequency has proven to be very effective in identifying and correcting any discrepancies.
Quantification of ionic cyanide
Given the assumption stated above in the “Quantification Method” section, the quantification of cyanide ion from the sodium cyanide quantity involves a simple molar mass ratio calculation. Since this estimation method is based upon stoichiometric principles, it is considered to yield the highest quality and reliability of data possible (again, based on the assumption above).
Calculations (intended for guidance purposes only; not required by regulation):
Sodium cyanide entered the process in 2010 (kg): 377,360 (usage records for 2010)
Atomic weight of sodium or Na (g/mol): 22.99 (periodic table)
Atomic weight of carbon or C (g/mol): 12.01 (periodic table)
Atomic weight of nitrogen or N (g/mol): 14.01 (periodic table)
Molecular weight of sodium cyanide or NaCN (g/mol): 49.01 (sum of atomic weights of Na, C and N)
Molecular weight of ionic cyanide or CN− (g/mol): 26.02 (sum of atomic weights of C and N)
Percent of sodium cyanide consisting of ionic cyanide (%): 53 (molecular weight of CN− divided by molecular weight of NaCN × 100)
Ionic cyanide entered the process in 2010 (kg): 200,000 (sodium cyanide usage × percentage cyanide ion) (i.e. 377,000 kg × 53%)
U1 Ionic cyanide quantity that entered the process in 2010 (kg): 200,000
Input/Output Balance (intended for guidance purposes only; not required by regulation):
Use + Creation = Transformed + Destroyed + Contained in Product + On-site or Off-site Release (to Air, Land, Water) + Off-site Transfers (for Treatment, Recycling)
U1 = D1 + D2 + T1 + DIS1 + DIS2
200,000 kg = 190,000kg + 4,974kg + 0 kg + 26kg + 6,300kg
200,000 kg = 201,300kg
Unaccounted material: 1,300kg
Comment on Input/Output Balance Results (intended for guidance purposes only):
After investigating the input/output balance results, no missing sources of data were found, and no calculation errors were found. It is likely that the difference in the input/output balance is related to the uncertainties in the calculations for destruction and output to the tailings pond. The values for D2, DIS1 and DIS2 are based upon a limited number of sample results, which result in limited accuracy due to the heterogeneous nature of the raw ore. Another contributing factor would be the upstream variability in the addition of various chemicals and the changes in various operating conditions to account for the differing raw ore gold concentration estimates from a limited number of test assays. Therefore, given the variation in data quality of the values used in the input/output balance, the input/output balance results are considered to be reasonable and acceptable.
Example 2-4: Sample For Tracking & Quantification
Destruction:
D2 (i.e. conversion of cyanide to cyanate during cyanide treatment)
Quantification Method:
Free cyanide concentrations from source sampling of influent and effluent of cyanide treatment activity using silver nitrate titration
Direct measurement of influent volume from flow metre and automated data collection system.
Assume that free cyanide consists completely of ionic cyanide (reasonable assumption since pH above 11 is maintained throughout process)
Assume that influent volume is equal to effluent volume (reasonable assumption since volume of spent ore slurry in cyanide treatment area is constant)
Best Available Method Rationale: Influent and effluent ionic cyanide concentrations
Source samples of influent and effluent are collected using a 24-hour composite sampler once per week and analyzed. This site-specific source of data provides a high level of reliability. The only other alternatives identified during the analysis of the best available method that might yield more reliable data were to either:
- implement continuous monitoring of the influent and effluent ionic cyanide concentrations; or
- to increase source testing frequency.
The former alternative was not chosen because of economic and technical achievability limitations (i.e. designing and implementing site-specific continuous monitoring equipment for our facility’s particular operational equipment configuration). The latter alternative (i.e. more frequent sampling) has been assessed in terms of the balance between data reliability and cost, yielding the current sampling frequency. The current sampling frequency also surpasses those recommended by relevant industry standards.
Influent volume
As stated in the Quantification Method section, influent flow rates are measured continuously by an in-situ flow metre and are collected by an automated system. This data system uses the flow rate measurements and calculates the total volume of influent over time. This data syste can be queried to provide total volumes over any requested time period. Continuous monitoring is considered to be a highly reliable source of data. This data source is considered to be the best available method, as no other alternatives could provide more reliable data.
Quantification of ionic cyanide
Although it was initially internally proposed to use the average annual concentrations of the influent and effluent source sampling results and multiply it by the volumes of influent and effluent over the 2010 year, respectively, another alternative was identified that would yield more reliable data. The current quantification method used is to multiply the weekly sampling results by the volume of influent/effluent for one week starting at the date and time of sample collection. This quantifies ionic cyanide on a weekly basis. These weekly quantities could then be added to determine the total quantity for the 2010 year. The initial suggested method of using the annual average concentration would have yielded data with high reliability; however, the current method employed does not differ significantly in cost, and yields data with an even higher level of reliability. During the analysis of the best available method for this calculation, increased influent and effluent sampling frequency was considered; please refer to the discussion and decisions made around this alternative in the above text shown under “Influent and effluent ionic cyanide concentrations” in this Best Available Method Rationale section.
Calculations (intended for guidance purposes only; not required by regulation):
Ionic cyanide in influent to cyanide treatment in 2010 (kg): 5000 (sum of weekly sample results of influent free cyanide concentrations multiplied by the weekly volume of influent obtained from data queries, over the 2010 year)
Ionic cyanide in effluent from cyanide treatment in 2010 (kg): 26 (sum of weekly sample results of effluent free cyanide concentrations multiplied by the weekly volume of influent obtained from data queries, over the 2010 year)
D2 Ionic cyanide destroyed during cyanide treatment (kg): 4,974 (ionic cyanide in influent minus ionic cyanide in effluent)
Input/Output Balance (intended for guidance purposes only; not required by regulation):
Use + Creation = Transformed + Destroyed + Contained in Product + On-site or Off-site Release (to Air, Land, Water) + Off-site Transfers (for Treatment, Recycling)
U1 = D1 + D2 + T1 + DIS1 + DIS2
200,000 kg = 190,000 kg + 4,974 kg + 0 kg + 26 kg + 6,300 kg
200,000 kg = 201,300 kg
Unaccounted material: 1,300 kg
Comment on Input/Output Balance Results:
After investigating the input/output balance results, no missing sources of data were found, and no calculation errors were found. It is likely that the difference in the input/output balance is related to the uncertainties in the calculations for destruction and output to the tailings pond. The values for D2, DIS1 and DIS2 are based upon a limited number of sample results, which result in limited accuracy due to the heterogeneous nature of the raw ore. Another contributing factor would be the upstream variability in the addition of various chemicals and the changes in various operating conditions to account for the differing raw ore gold concentration estimates from a limited number of test assays. Therefore, given the variation in data quality of the values used in the input/ output balance, the input/output balance results are considered to be reasonable and acceptable.
7.3 Example 3: Adhesive Manufacturing Operation
Examples 3-1 to 3-3 provide examples of all the components of toxic substance accounting for a fictional adhesive manufacturing operation.
Example 3-1: Illustration Showing Stages and Processes of an Adhesive Manufacturing Operation (describing Zinc)

Example 3-1 Description:
The adhesive manufacturing operation receives raw materials at the receiving process of the receiving stage. At the production stage, the reactor process consists of several batch reactors (i.e. vessels that operate in batch mode). These batch reactors are filled with raw materials and mixed, heated and cooled to produce (by chemical reaction) the desired product, which is then filtered and poured into containers. In the shipping stage, the final product is sent to customers during the shipping process.
During 2010, the adhesive manufacturing operation ran for two shifts per day, five days per week, throughout the year (with the exception of two weeks where operations were suspended for scheduled maintenance).
Example 3-2: Process Flow Diagram – Zinc in Reactor Process
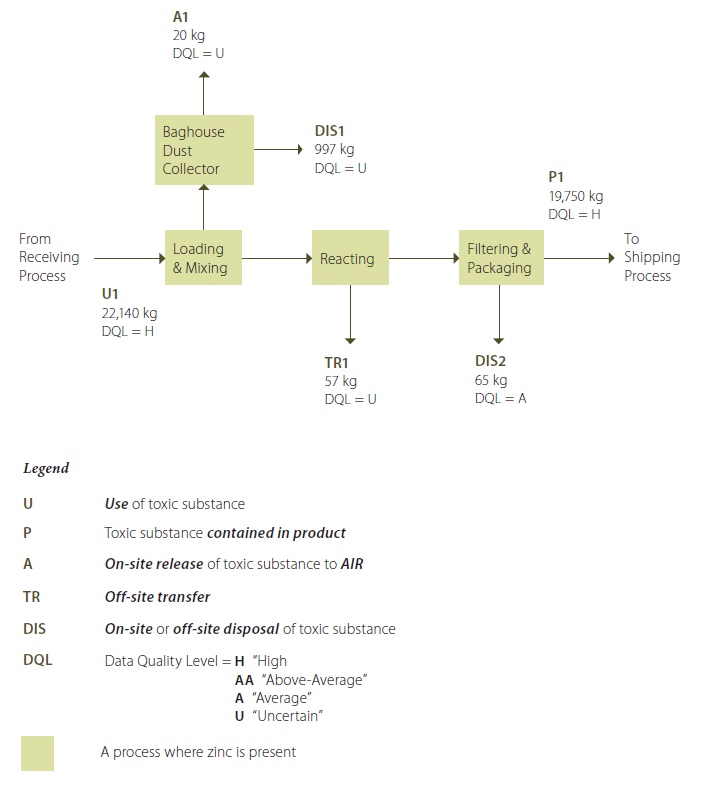
Example 3-2 Description:
Zinc is present as an ingredient used in the manufacturing of water-based adhesives, because it provides a desired adhesion characteristic. Powder raw materials (one containing zinc) are manually loaded into the reactor from the receiving process (U1) and undergo mixing with other ingredients. The mixing activity creates some dust, which is extracted to a baghouse dust collector. Some of the dust contains zinc. Most of the dust is captured by the baghouse dust collector, but a small portion is released as an air emission to the atmosphere (A1). Dust that has been captured by the baghouse dust collector is disposed of off-site (DIS1).
During the reacting activity, the lid is closed on the reactor, and the reactor is heated to a desired temperature and pressure, in order to “cook” the batch to produce the desired product. Subsequently, the reactor is cooled. Both the heating and cooling treatments are by non-contact heat transfer, using closed-loop coils in the reactor. Thus, there are no material losses during the reacting activity. In addition, zinc, being a metal, is not created or destroyed in the reactor process.
Once the “batch” of product has been made, it is subsequently pumped out of the reactor through filters and packaged for shipping. This step creates used filters, as a waste stream, that are known to contain minor amounts of zinc (DIS2). The amount of zinc in the product (P1) transfered to the shipping process is monitored for quality control purposes, and is known with a high degree of certainty. The amount of zinc in the used filters is based on analysis of a sample.
After the reactor is drained of product, it is washed before use for the next “batch”. During reactor washing, operators use high pressure water to remove residual product from the reactor vessel, and this creates a wastewater stream. This wastewater contains trace amounts of zinc, and the wastewater is discharged to the sanitary sewer connection at the facility (TR1).
** Note that the quantification values shown in this process flow diagram are annual values.
Guidance Notes For Example 3-2: This toolkit refers only to “Contained in Product P1” in the “Example 3-3: Sample Calculations” in the “Example 3-2 Description” box.
Example 3-3: Sample for Tracking & Quantification
Contained in Product: P1 (i.e. zinc contained in product transferred to shipping process)
Quantification Method(s):
In-house analytical test results of zinc concentration in product (i.e. sampling), using atomic absorption spectroscopy
Records showing quantity of product transferred to shipping process
Best Available Method Rationale: Zinc concentration
Zinc concentration is determined by in-house laboratory quality control analysis. Representative batches of product are analyzed daily for zinc content, since this measurement is a statistical process control parameter. In other words, there is a target concentration range of zinc in the product that must be achieved, and this range is very small (i.e. 3.9% to 4.1%). Any product batches whose zinc concentration results fall outside that range are re-worked, and therefore are not transferred to the shipping process. As such, this method has a high level of data quality. The only other methods that could yield better quality data would either be continuous monitoring, or a higher frequency of the current sampling and testing regime. The former method (continuous monitoring) is not technically logical, since every single product cannot be tested in its entirety. The latter alternative (i.e. more frequent on-site product testing) has been assessed in terms of the balance between: 1) data quality, and 2) cost associated with analytical testing and product yield. The current frequency has been determined to be the best balance between data quality and cost. The current testing frequency also surpasses the testing frequency recommended by relevant industry standards.
Product quantity
The product quantity that is transferred to the shipping process is tracked and recorded by facility personnel. These values are cross-checked with inventory records for quality control weekly. This site-specific method is therefore considered to be of very high quality. Alternative methods that might yield more reliable data were considered, including:
- an automated process for tracking these quantities, or
- more frequent cross-checking.
The former alternative is cost- prohibitive, particularly considering the high level of data quality already being achieved. The latter alternative has already been implemented in previous years, and the current frequency has proven to be very effective in identifying and correcting any discrepancies.
Calculations (intended for guidance purposes only; not required by regulation):
Zinc concentration in product (%): 4.0 (average concentration from sampling results in2010)
Total product shipped (kg) 493,750 (total 2010 quantity taken from transfer records)
Total zinc in product (kg): 19,750 (zinc concentration × product shipped) (i.e. 4.0% × 493750 kg)
P1 Zinc contained in product transferred to shipping process in 2010 (kg): 19,750
Input/Output Balance (intended for guidance purposes only; not required by regulation):
Use + Creation = Transformed + Destroyed + Contained in Product + On-site or Off-site Release (to Air, Land, Water) + Off-site Transfers (for Treatment, Recycling)
U1 = A1 + TR1 + DIS1 + DIS2 + P1
22140 kg = 20 kg + 57 kg + 997 kg + 65 kg + 19750 kg Unaccounted material: 1,251 kg
Comment on Input/Output Balance Results (intended for guidance purposes):
After investigating the input/output balance results, no missing sources of data were found, and no calculation errors were found. It is likely that the difference in the input/output balance results from the a combination of the accuracy of the wastewater value (TR1), the air emission value (A1), the waste dust value (DIS1) and the waste filter value (DIS2). The air emission value is based on a baghouse dust collector particulate emission factor of 20 mg/m3, and then an average zinc concentration. The dust collector emission factor, while commonly used as a conservative estimate of baghouse performance, is not site specific and therefore has some margin of error. In addition, the zinc content in the waste (DIS1) and the waste filter (DIS2) are based on a single annual sample for waste characterization. Also, the wastewater discharge concentration is based on daily zinc concentration sampling results, while there may be some variation throughout the day. Therefore, given the variation in data quality of the values used in the input/output balance, the input/output balance results are considered to be reasonable and acceptable.
7.4 Example 4: Wood Furniture Manufacturing Operation
Examples 4-1 to 4-3 provide examples of all the components of toxic substance accounting for a fictional wood furniture manufacturing operation.
Example 4-1: Illustration Showing Stages and Processes of a Wood Furniture (Kitchen Cabinet) Manufacturing Operation (describing Toluene)
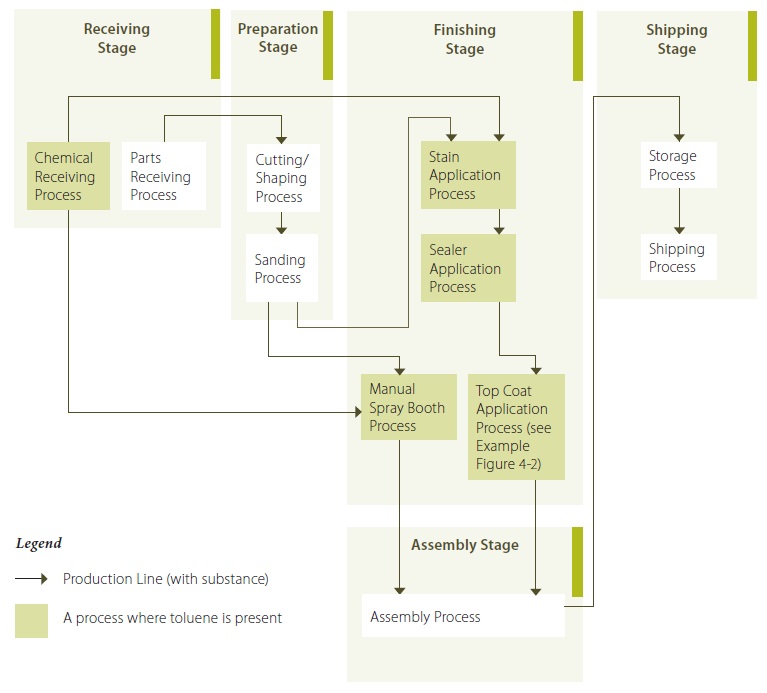
Example 4-1 Description:
During the receiving stage, wood parts are received during the parts receiving process by truck. Stains, coatings, sealers and solvents (some of which contain toluene) are received during the chemical receiving process via truck in drums and pails, and are transferred to a dedicated chemical storage area via forklifts. During the preparation stage, wood parts are cut and shaped to the desired specifications using an automated cutting and shaping process. During the sanding process, the wood parts are then sanded to smooth rough edges and surfaces, either via an automated process, or by hand, depending upon the shape and/or configuration of the part. The sanded parts are transfered to the stain application process in the finishing stage. The chemicals containing toluene are transfered from the chemical receiving process to be used in the stain application process in the finishing stage. The stains, top coats and sealers are applied to the parts using an automated spraying process, whereby the parts are put on conveyors which move the parts through both the enclosed spray chambers, and the curing ovens, within the finishing process. The enclosed spraying chambers are equipped with automated sprayers that are controlled to specify various spraying parameters to minimize overspray. Overspray is collected in trenches in the floors of the chambers and stored for off-site haulage for either disposal or recycling, depending upon the contents, which are periodically tested by the receivers. After each application of stain, top coat or sealer, the parts are dried in curing ovens. Finally, the parts are assembled during the assembly process into the final products, at which time they are stored and ultimately shipped.
The spray guns are purged using a solvent in between manufacturing specification changes. The purge solvent is collected and stored separately, some of which is recycled on-site, or hauled off-site for recycling, depending upon the quality of the purge solvent.
The facility operated an average of 16 hours per day, 6 days per week during 2010.
The facility also operates a manual spray booth process within the finishing stage, for parts that have more complex figurations, or that are manufactured in small quantities. The manual spray booth has an exhaust system equipped with filtration for overspray. There is no collection of liquid from the manual spray booth – very little liquid accumulates within the spray booth, and that which does is simply left to evaporate. The painted parts are manually transfered to a ventilated storage area to dry. The manual spray booth was operated for a total of approximately 800 hours during 2010.
Example 4-2: Process Flow Diagram – Toluene in Top Coat Application Process
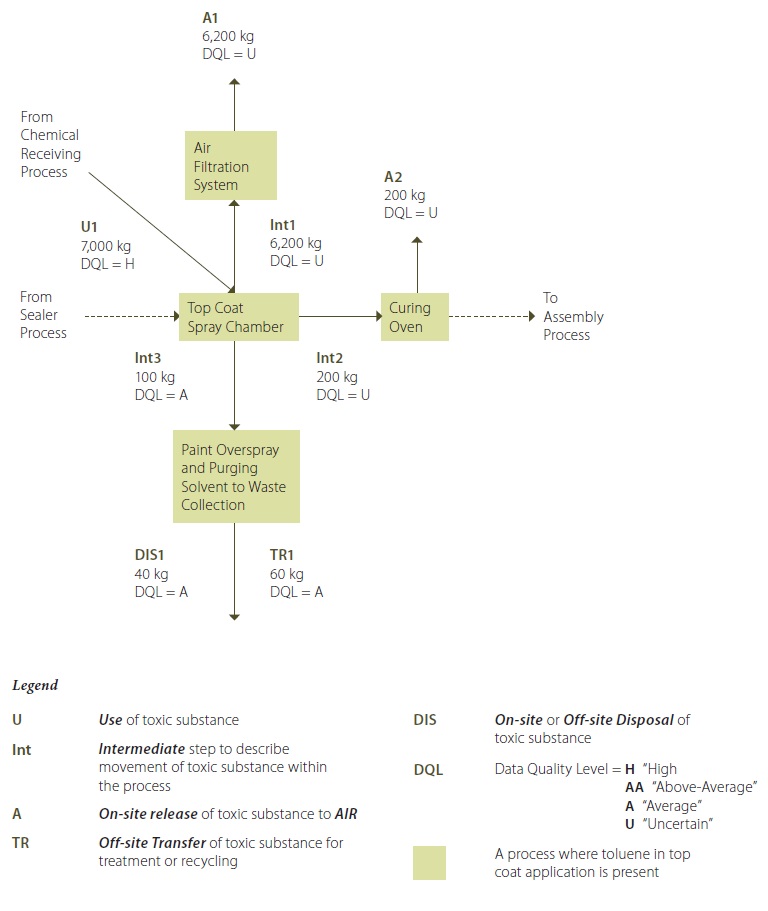
Example Figure 4-2 Description:
Toluene is present in some of the top coats that are transfered from the chemical receiving process, and are applied to the wood components in the top coat spray chamber (U1). Toluene emissions from the top coat spray chamber are vented (moved) to the spray chamber’s air filtration system (Int1) and pass through untreated as an on-site release to air (A1). Any toluene still present in the top coat on the part is transferred to the curing oven (Int2), and is subsequently released to the atmosphere from the curing ovens (A2).
Overspray is collected from the top coat spray booth using a trench that transfers the waste liquids via gravity to a receiving container (Int3). The stored waste liquids are then tested by potential receivers to determine whether the liquids are fit for recycling or for disposal. During 2010, some of the paint overspray collected from the top coat spray chamber was transfered off-site for recycling (TR1), and the remainder was disposed of off-site (DIS1).
** Note that the quantification values shown in this process flow diagram are annual values.
Guidance Notes for Example 4-2:
This guidance document refers only to “Off-Site Transfer TR1” in “Example 4-3: Sample For Tracking & Quantification Calculations”. This is because this example is limited to only this particular calculation. In accordance with the regulation, however, all of the values provided in this process flow diagram would require similar information to that provided for TR1 in “Example 4-3: Sample For Tracking & Quantification Calculations”.
Example 4-3: Sample for Tracking & Quantification
Off-Site Transfer for Recycling: TR1
Quantification Method(s):
Site-specific source testing of solvent waste taken and analyzed by hauler using gas chromatography.
Manifest records showing volumes of waste solvent transferred off-site.
Best Available Method Rationale: Toluene concentration
Prior to transfer, the hauler collects a sample of waste solvent from the container. This sample is tested by the potential receiver/recycler to determine whether the waste solvent is suitable for recycling or for disposal. The facility receives the results of the analysis which include the concentration of toluene. Certain factors, including 1) the collection and analysis of only one sample from each particular shipment of waste solvent, and 2) the lack of control over the manner of sample collection and transfer, yield data quality that has only fair reliability (particularly when used to estimate the total quantity of toluene in the shipment. During the identification and evaluation of other quantification methods, it was concluded that any type of data collection improvement such as continuous monitoring or facility-initiated sampling frequencies were not economically practical, given that this is a waste stream that in some cases incurs cost for transfer.
The current calculation approach, however, is determined to be the best available method when considering other options such as a mass balance approach. For quality purposes, the facility does request a copy of the analytical report and review the report’s quality information and chain of custody information.
Waste Solvent Quantities
The volume of each individual waste solvent shipment is recorded by the hauler at the time of collection. This quantity is cross-checked by the facility’s waste inventory records. This method is therefore considered to be of very good quality. No alternative methods were identified during the best available method evaluation that could provide a more reliable value.
Calculations (intended for guidance purposes only; not required by regulation):
Density of toluene at 20°C (kg/L): 0.86 (chemical property) in 2010)
Range of individual shipment volumes of solvent waste (L): 100 to 350 (individual quantities taken from shipment records)
Range of individual shipment toluene concentrations (%): 20 to 60 (records received from potential receiver/recycler)
Total quantity of toluene transferred for recycling (kg): 60 (sum of each individual toluene concentration result multiplied
TR1 Total toluene off-site transfer for recycling from top coat booth in 2010 (kg): 60
Input/Output Balance (intended for guidance purposes only; not required by regulation):
Use + Creation = Transformed + Destroyed + Contained in Product + On-site or Off-site Release (to Air, Land, Water) + Off-site Transfers (for Treatment, Recycling)
U1 = A1 + A2 + DIS1 + TR1
7,000 kg = 6,200 kg + 200 kg + 40 kg + 60 kg
7,000 kg = 6,500 kg
Unaccounted for material: 500 kg
Comment on Input/Output Balance Results (intended for guidance purposes only):
After investigating the input/output balance results, no missing sources of data were found, and no calculation errors were found. It is likely that the difference in the input/output balance results from a combination of factors, including the following: The air emissions from the spray chamber and the curing oven are based on stack testing that was done in 2010 (providing only two samples) in accordance with the Environmental Compliance Approval (Air) requirement. It should also be noted that the stack tests were performed during maximum emission scenario conditions, which would not reflect conditions throughout the entire year. In addition, the quantities related to off-site disposal and off-site recycling were calculated using test results from the receivers; however, these test results reflect the toluene quantity for liquid from all of the spray chambers, since the overspray from all sources are collected and stored in a single container.
Given these conditions, the calculations were based on estimates of relative quantities of overspray produced from each spray chamber, which is less accurate than if the overspray from the top coat spray chamber was tested on its own. Therefore, given the variation in data quality of the values used in the input/output balance, the input/output balance results are considered to be reasonable and acceptable. In the coming years, the facility will continue to look for alternate methodologies that provide more reliable data for calculating A1 other than by the current best available method of mass balance, and will evaluate and implement these methodologies in accordance with the Act and regulation in the future.
7.5 Example 5: Brick Manufacturing
Examples 5-1 to 5-3 provide examples of all the components of toxic substance accounting for a fictional brick manufacturing facility.
Example 5-1: Description of Stages and Processes of a Brick Manufacturing Operation (describing Hydrogen Fluoride*)
Hydrogen fluoride is a by-product of fluorine. Fluorine is introduced as a constituent in the natural raw materials (including clays and shales). Assay tests showed a range of fluorine concentrations from 0.02 to 0.05 percent by weight for the raw material received in 2010. During the raw material receiving process of the receiving stage, the raw materials are received in bulk by covered dump trucks from an on-site quarry, and are dumped into a hopper which transfers the raw material via an underground conveyor system to a storage area. Chemicals such as pigments are received during the chemical receiving process via truck and are transported to a storage area via forklift. During the preparation stage, the raw material passes through the crushing, grinding and screening processes by mechanical means. During the production stage, the ground, screened clay and shale is mixed with water to a desired consistency, and pigments are added to customers’ specifications. In the forming and cutting process, the mixture is extruded and cut by mechanical means, into bricks sized according to customers’ specifications. The bricks from the forming and cutting process enter the drying process to remove excess moisture from the bricks. The dryers typically are heated to approximately 200 degrees Celsius using waste heat from the cooling zone of the kiln. The dried bricks are collected from the drying process and loaded into the kiln firing and cooling process, where the bricks are fired to temperatures reaching between 500 and 600 degrees Celsius. During both the drying process and the kiln firing and cooling process (see example 5-2), some of the fluorine present in the bricks is transformed to hydrogen fluoride gas by dehydroxylation. Hydrogen fluoride gas is collected and treated using a dry scrubber containing limestone. The cooled bricks are transferred to the shipping stage, where they are packed, stored and eventually shipped.
The brick manufacturing facility generally operates year-round, 24 hours per day, 7 days per week, with the exception of scheduled maintenance. Most of the processes run continuously, with the exception of the drying process and kiln firing and cooling process, which are batch processes that shut down between filling and emptying, since the dryers and kilns must be full before they are run.
Example 5-2: Process Flow Diagram – Hydrogen Fluoride in Kiln Firing and Cooling Process
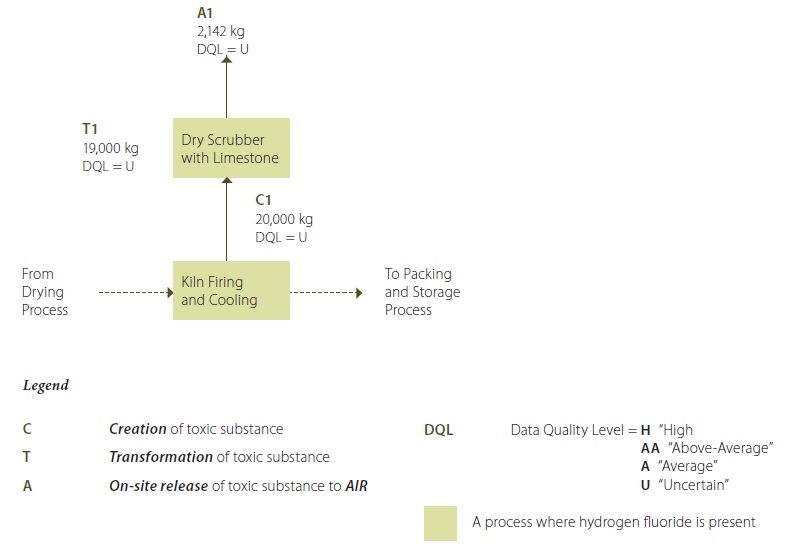
Example 5-2 Description:
Hydrogen fluoride emissions are created (C1) during kiln firing when some of the fluorine present in the raw material is transformed to hydrogen fluoride. The emissions are collected in a dry scrubber that uses limestone as a sorption medium to eliminate some of the hydrogen fluoride emissions, which form a thin layer of calcium fluoride, a Phase II substance (T1), over the limestone granules. This layer is periodically removed from the scrubber and screened. Any hydrogen fluoride which is not captured by the limestone scrubber is released as on-site air emissions (A1).
**Note that the quantification values shown in this process flow diagram are annual values.
Example 5-3: Sample for Tracking & Quantification
On-Site Release to Air: A1 (i.e. untreated hydrogen fluoride emitted to air after limestone scrubber)
Quantification Method(s):
Site-specific source testing of hydrogen fluoride from limestone scrubber
Operator records indicating kiln operating hours
Best Available Method Rationale: Hydrogen fluoride emission rate
Site-specific source tests of the limestone scrubber stack were completed in accordance with the requirements of the facility’s Environmental Compliance Approval (Air). Three air samples were collected and analyzed in 2010. The average of these sample results was used in the calculation of the total hydrogen fluoride emissions to air in 2010. Although site specific source testing generally yields more reliable data than many other estimation methods, it should be noted that these samples are collected during the facility’s “maximum emission scenario”, which is when the kiln is operating at its highest temperature. This yields an overall emission value that therefore may be higher than the actual emission rate. However, the heterogenous nature of the raw material constituents (in this case, fluorine) is such that, overall, three samples taken over the course of one year yields data that, while of reasonable quality, cannot be considered to have extremely high quality.
When compared to other data sources during the analysis of the best available method, however, this method is still considered to be one of the best approaches. Other alternatives that could yield higher quality data include:
- implementation of continuous monitoring; or
- an increase in source testing frequency.
Neither of these alternatives were chosen due to the associated high costs.
Kiln operating hours
Kiln start and finish times are recorded by facility personnel. These values are cross-checked on a weekly basis with kiln temperatures that are automatically recorded on wheel charts. This site- specific method is therefore considered to be of very high quality. Alternative methods that might yield more reliable data were considered, including:
- an automated process that logs start and finish times or
- more frequent cross-checking.
The former alternative is cost-prohibitive, particularly considering the high level of data quality already being achieved. The latter alternative has already been evaluated and implemented in previous years, and the current frequency has proven to be very effective in identifying and correcting any discrepancies.
Calculations (intended for guidance purposes only; not required by regulation):
Hydrogen fluoride emissions from scrubber (g/s): 0.082 (average of three stack test results)
Kiln operation in 2010 (hours): 7255 (sum of the recorded kiln operating times for 2010)
(example calculation: 0.082 g/s × 3600 s/hr × 1⁄1000 kg/g × 7255 hours = 2142 kg)
A1 Total on-site hydrogen fluoride emissions to air from scrubber in 2010 (kg): 2142
Input/Output Balance (intended for guidance purposes only; not required by regulation):
Use + Creation = Transformed + Destroyed + Contained in Product + On-site or Off-site Release + Disposal + Transfer
C1 = T1 + A1
20,000 kg = 19,000 kg + 2,142 kg
Unaccounted for material: 1,142 kg
Comment on Input/Output Balance Results (intended for guidance purposes only):
After investigating the input/output balance results, no missing sources of data were found, and no calculation errors were found. It is likely that the difference in the input/output balance results from a combination of factors, including the following: The creation of hydrogen fluoride from the kilns prior to the scrubber is based on estimates of fluorine concentrations in the raw material, which can be highly variable due to its heterogenous nature, and on the assumption that all of the fluorine is transformed into hydrogen fluoride during the drying process and kiln firing and cooling process. This may be an overly conservative assumption. Also, the destruction of hydrogen fluoride is based on the efficiency specifications of the scrubber, which may not reflect actual conditions. Finally, only three stack tests are used for the on-site emissions to air from the scrubber, which may not be presenting very accurate conditions considering the high variability in fluorine concentrations in the raw material, and the possible differences in hydrogen fluoride emission rate with temperature changes in the kiln during firing and cooling. Therefore, given the variation in data quality of the values used in the input/output balance, the input/output balance results are considered to be reasonable and acceptable.