This page is no longer current and is provided for archival and research purposes.
Tracking and Quantification
We’ve made changes to the Toxics Reduction Program to eliminate duplication with the federal government’s Chemicals Management Plan, (under the Canadian Environmental Protection Act, 1999) and reduce burden for industry.
On December 31, 2021, the Toxics Reduction Act, 2009 will be repealed and its associated regulations revoked, ending the Toxics Reduction Program. Until this time, facilities must continue to meet the requirements of the Toxics Reduction Act, 2009 and its associated regulations.
As a result of regulatory changes, facilities no longer need to prepare new toxic substance reduction plans or review their existing plans. Facilities with existing plans are still required to report annually on substances included in their plans that meet the thresholds.
The ministry is currently updating this Toolkit for Toxic Substance Accounting to reflect the legislative and regulatory changes. The updated version will be provided shortly.
After a facility has identified in the process flow diagrams how the substance moves through each process, the next step is to track and quantify (i.e. toxic substance accounting). This section of the toolkit provides some suggestions as to how a facility might meet these requirements.
The regulation requires that:
“…the owner and the operator of a facility shall create the following records in respect of the toxic substance…
3. A record of the tracking and quantification of the substance for each calendar year in which section 9 of the Act applies in respect of the substance.”
(O. Reg. 455/09, s. 12 (2) 3.)
The regulation also states that:
“Section 9 of the Act does not apply in respect of amounts of a toxic substance that enter a process or are created, destroyed, transformed, released, disposed of, transferred or contained in product, if, under the NPRI Notice, the amounts are excluded from the determination of whether the criteria for reporting under the NPRI Notice are met.”
(O. Reg. 455/09, s. 13)
The regulation requires that the owner and operator create a record for the tracking and quantification for each prescribed toxic substance at the process level for the calendar year. The process-level quantification may then be used to determine facility-wide quantifications as required for the annual Report.
There is an important provision in the regulation that states that the rules in the NPRI notice with regard to calculating amounts also apply to the calculations for toxic substance accounting. This provision is aimed to leverage the exemption rules as set out in NPRI that states that a facility does not have to look for the substance in certain activities or “things”. For example, the article exemption that applies for NPRI quantifications also applies for Ontario’s toxic substance accounting. The owner and operator are encouraged to review the Gazette Notice and NPRI guidance to become familiar with these rules.
There may be many approaches to creating the record for tracking and quantification. A spreadsheet or database may already be used at the facility to keep track of the inventory of substances, materials containing the substance, or due to NPRI, the tracking of emissions, disposals, and transfers of the substances. If it is possible to use these existing tracking methods for the purpose of tracking at the process level, then a facility may reference these systems in the record.
Once a substance has been tracked throughout a process, the prescribed toxic substances must be quantified for the amount that enters the process, is created, transformed, destroyed, transferred for recycling, disposed of, released, and contained in product. Methods for tracking and quantification are described in Section 5.1.
The regulation states that:
“A process flow diagram mentioned in paragraph 2 of subsection (2) may specify the quantifications made under section 9 of the Act in respect of the toxic substance.”
(O. Reg. 455/09, s. 12 (4))
A facility may choose to use a process flow diagram to show actual quantities used, created, transformed, destroyed and released, disposed of, transferred and contained in product, but it is not required.
Figure 11: Cyanides in Ore Extraction Process Flow
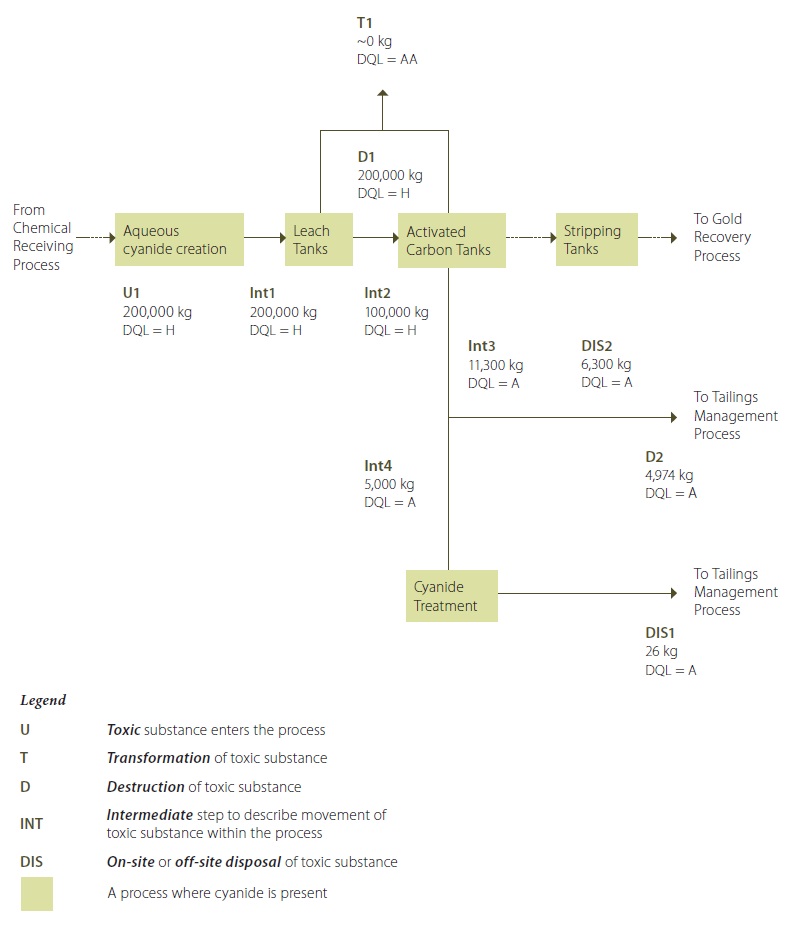
Figure 11 Description:
Cyanide salt (ionic) is added to water to create an aqueous ionic cyanide in a solution (U1). This ionic cyanide solution is added to the raw ore slurry leach tanks. Some of the ionic cyanide bonds with the gold to form aurocyanide in solution. The ionic cyanide that bonds with gold to form aurocyanide is considered to be destroyed. The slurry mixture coming out of the leach tanks (containing water, ground ore, ionic cyanide and aurocyanide (D1) is transferred to activated carbon tanks, where the aurocyanide is adsorbed onto the activated carbon. The slurry in the leach tanks and activated carbon tanks is maintained at a pH of greater than 12 by adding lime to the tanks. This largely avoids the transformation of ionic cyanide to hydrogen cyanide that is released to the air from these activities (T1) (although by nature of the chemical reaction, it is less likely to have zero releases of hydrogen cyanide; however, reducing these releases to less than1% is possible). The gold-loaded carbon from the activated carbon tanks is then transferred to stripping vessels where the gold is removed from the carbon into a solution. The gold solution is then transfered to the recovery process. The spent ore slurry containing the remaining ionic cyanide from the activated carbon tanks (Int3) is routed to a cyanide treatment area during the coldest six months of 2010 (Int4). In the cyanide treatment area, most of the ionic cyanide is destroyed by being converted into cyanate (D2). The treated spent ore slurry, containing the destroyed cyanide along with a small quantity of untreated ionic cyanide, is transferred to the tailings management process (DIS1). During the warmest six months of 2010, the spent ore slurry from the activated carbon tanks was transfered directly to the tailings management process, bypassing the cyanide treatment area (DIS2).
Refer to the Example Figure 2-4: Sample Calculations for supporting information and calculations for Destruction D2.
Refer to the Example Figure 2-3: Sample Calculations for supporting information and calculations for Creation C1.
Refer to either Example Figure 2-3 or Example Figure 2-4 for an input/output balance calculation.
**Note that the quantification values shown in this process flow diagram are annual values.
Figure 11 provides an example showing labeled pathways and calculated annual quantities in a process flow diagram.
Documenting the calculation is not a regulatory requirement but it may be helpful to give further context to the quantifications provided.
For example for the pathway U1, the supporting calculation is provided below:
Calculation for Amounts of Ionic Cyanide Entering the Process* (U1):
During this process, ionic cyanide enters the process when sodium cyanide (a salt, which is not a prescribed toxic substance) is added to water to create an aqueous solution containing sodium ions and cyanide ions. The chemical equation for this reaction is:
NaCN < – > Na+ + CN−
- NaCN
- is sodium cyanide salt
- Na+
- is the sodium ion
- CN−
- is the cyanide ion
Ionic cyanide is a prescribed toxic substance, and includes the salts of hydrogen cyanide such as sodium cyanide.
It can be reasonably assumed that all of the sodium salt dissolves into ionic form. Since it is known that a total of 377,360 kg of sodium cyanide salt was added to the process in 2010, the quantity of cyanide ion entering the process can be calculated using simple stoichiometry:
Based on the equation above, it is evident that one mole of NaCN yields one mole of Na+ and one mole of CN− in aqueous solution. The atomic weights of the individual elements can be found from a periodic table:
Atomic weight of Na = 22.99 grams per mole
Atomic weight of C (carbon) = 12.01 g/mol
Atomic weight of N (nitrogen) = 14.01 g/mol
Molar mass of NaCN = 22.99 + 12.01 + 14.01 = 49.01 g/mol
Molar mass of CN− = 12.01 + 14.01 = 26.02 g/mol
By dividing the molar mass of CN− by the molar mass of NaCN, one can then determine the weight percentage of the sodium cyanide salt that consists of ionic cyanide, when in solution.
26.02 g/mol divided by 49.01 g/mol = 0.53, or 53%
If 53% of the weight of the cyanide salt used in2010 was converted into ionic cyanide, then 377,360 kg of sodium cyanide would yield 377,360 × *53%, or 200,000 kg, of ionic cyanide.
*based on amounts of cyanide ions
Sample calculations are provided in Section 7.0 for several manufacturing examples. For each route or pathway, the quantification method must be described. For the examples provided in Section 7.0, data quality levels have also been assigned.
If a facility identifies the various pathways by coding them according to type of input and output stream, then it is a simple exercise to add all the similarly coded streams to create the ‘roll- up’ total facility amount required for reporting.
6.1 Analysis – Input / Output Balances
The input/output balance is a quantitative tool for making a qualitative decision. The intent of an input/output balance exercise is not to obtain a zero balance and it is recognized that this will rarely be achieved. The intent is to use the input/ output balance as a qualitative indicator, to evaluate the approaches chosen for tracking and quantifying the substance and identify where significant data gaps may exist. Reasons for data gaps may be due to a number of factors, such as missing processes or a missing route or pathway on a process flow diagram, or an inaccurate data accounting method, etc. It is acceptable to have a non-zero balance. If a facility determines through input/output balance that the sum of the inputs of the process is not approximately equal to the sum of the outputs, a facility must provide an explanation that describes the cause of the discrepancy. The record outlining the reasons why there is not an approximate balance between inputs and outputs is kept at the facility.
It is acknowledged that toxic substance accounting may be limited by the quality and availability of data. Some instances that may result in unbalanced input/output quantities are:
- Many processes have numerous process streams, many of which affect various environmental media;
- The exact composition of many streams is unknown and cannot be easily analyzed;
- Phase changes occur within the process, requiring multimedia analysis and correlation;
- Plant operations or product mix change frequently, so the material flows cannot be accurately characterized by a single process flow diagram;
- Many sites lack sufficient historical data to characterize all streams.
- The input/output balance approach allows a facility to confirm that operations that use, create, destroy or transform prescribed toxic substances and those that contribute to appreciable transfers, disposals or releases have not been missed. This helps to ensure that all toxic substance reduction opportunities can be identified. These balances allow a reviewer or decision maker the opportunity to go back and obtain better data if required.
The input/output balance would be represented as follows, for a prescribed toxic substance (using the annual quantities calculated for these values):
Enters the Process + Created = Transformed + Destroyed + Leaves Process
The term “Leaves Process” may include any combination of the following scenarios:
- Contained in product
- Released as air emissions
- Released as liquid or solid waste
- Disposed of
- Transferred off-site for treatment or recycling
The regulation also states that:
“The record required under paragraph 4 of subsection (2) shall be completed on or before June 1 in the year following the calendar year in which the sums specified in that subsection do not approximately equal each other.”
(O. Reg. 455/09, s. 12 (5))
For some examples the input/output balance is zero. For others, a discrepancy is shown. For each example, the results of the input/output balance is discussed in the context of what the information yields, i.e., is the discrepancy (if one exists) acceptable and if so, why is it acceptable.