Child and youth deaths in Ontario and Canada: trends over time
While deaths of children and youth comprise a small percentage of those investigated by the OCC, each of these deaths is challenging from emotional and investigative perspectives. It is important to consider the findings published in the Annual Report within the broader context of childhood deaths in Canada.
While the OCC defines the paediatric age group from live birth to the nineteenth birthday, adolescent data provided by Statistics Canada also includes the nineteenth year (i.e. up to the twentieth birthday). For the purpose of the comparisons demonstrated in Charts 1 – 4, data from the OCC includes investigations of adolescent deaths up until the twentieth birthday as well. Over the previous five years, on average, the OCC has investigated 60 deaths of individuals in their nineteenth year per year.
Chart 1 illustrates the number of child and youth deaths per year and compares the number of cases investigated by the OCC with the provincial and national numbers. Between 2005 and 2018 the year to year totals have remained fairly consistent.
Chart 1: Comparison of child and youth deaths in Canada and Ontario with Ontario coroner’s cases 0-19 years of age (2005-2018)
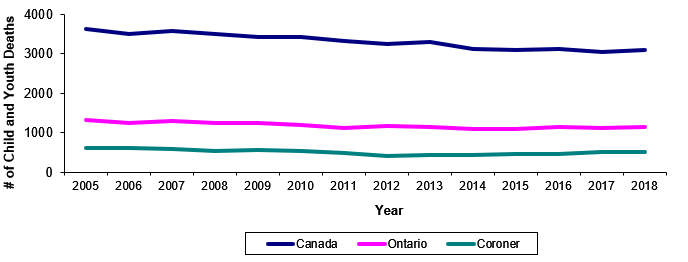
Chart 2 provides the actual numbers of child and youth deaths per year and shows the percentage of paediatric deaths in Ontario as a proportion of the national total. Between 2005 and 2018, the year to year totals have remained fairly consistent.
| Year | Paediatric population – Canada (total) | Paediatric population – Ontario (total) | Percent of Ontario paediatric population versus Canada | Paediatric deaths - Canada (total) | Paediatric deaths - Ontario (total) | Percent of Ontario paediatric deaths versus Canada |
|---|---|---|---|---|---|---|
| 2005 | 7,874,686 | 3,129,130 | 40% | 3640 | 1335 | 37% |
| 2006 | 7,865,435 | 3,127,664 | 40% | 3513 | 1249 | 36% |
| 2007 | 7,859,930 | 3,116,390 | 40% | 3591 | 1297 | 36% |
| 2008 | 7,869,257 | 3,112,369 | 40% | 3517 | 1237 | 35% |
| 2009 | 7,867,349 | 3,101,042 | 39% | 3423 | 1247 | 36% |
| 2010 | 7,850,628 | 3,087,884 | 39% | 3424 | 1201 | 35% |
| 2011 | 7,833,278 | 3,074,838 | 39% | 3245 | 1122 | 35% |
| 2012 | 7,828,135 | 3,062,498 | 39% | 3247 | 1166 | 36% |
| 2013 | 7,848,394 | 3,069,969 | 39% | 3295 | 1157 | 35% |
| 2014 | 7,843,048 | 3,051,984 | 39% | 3135 | 1092 | 35% |
| 2015 | 7,886,794 | 3,062,245 | 39% | 3112 | 1086 | 35% |
| 2016 | 7,949,667 | 3,079,434 | 39% | 3120 | 1134 | 36% |
| 2017 | 8,002,039 | 3,096,032 | 39% | 3043 | 1110 | 36% |
| 2018 | 8,072,495 | 3,122,693 | 39% | 3092 | 1138 | 37% |
| Average | 7,889,367 | 3,092,441 | n/a | 3314 | 1184 | n/a |