Office of the Chief Coroner and the context of child and youth deaths in Ontario
Child and Youth Deaths in Ontario and Canada: Trends Over Time
While deaths of children and youth comprise a small percentage of those investigated by the OCC, each of these deaths is challenging from emotional and investigative perspectives. It is important to consider the findings published in the annual report within the broader context of deaths among children and youth in Canada.
While the OCC defines the paediatric age group from live birth to the nineteenth birthday, CYDRA reviews the deaths of youth up to 23 years of age. This is consistent with Policy Directive CW 003-23 which has effectively increased the age limit for youth that receive continued care and support from Children's Aid Societies or Child and Family Well-being Agencies.
Chart 1: Comparison of child and youth deaths in Canada and Ontario with Ontario coroner investigations (age 0—19 years, 2010—2021)
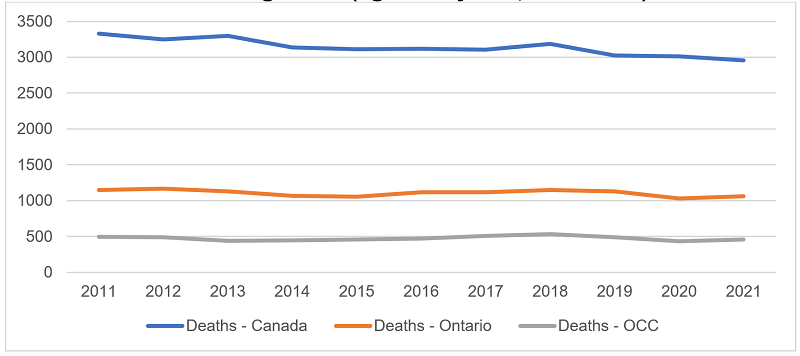
Chart 1 illustrates the number of child and youth deaths per year and compares the number of deaths investigated by the OCC with the provincial and national numbers. Between 2010 and 2021, the year-to-year totals have remained relatively consistent.
Chart 2: Child and youth population vs deaths in Ontario compared with Canadian totals (age 0—19, 2010—2021)
| Year | Population: Ontario | Population: Canada | Percent of Ontario populations vs Canada | Deaths: Ontario | Deaths: Canada | Percent of Ontario deaths vs Canada |
|---|---|---|---|---|---|---|
| 2010 | 3,107,458 | 7,871,049 | 39% | 1,201 | 3,424 | 35% |
| 2011 | 3,102,449 | 7,865,018 | 39% | 1,151 | 3,331 | 35% |
| 2012 | 3,089,543 | 7,857,935 | 39% | 1,166 | 3,247 | 36% |
| 2013 | 3,078,716 | 7,858,925 | 39% | 1,132 | 3,295 | 34% |
| 2014 | 3,070,164 | 7,870,897 | 39% | 1,066 | 3,135 | 34% |
| 2015 | 3,062,245 | 7,886,794 | 39% | 1,058 | 3,112 | 34% |
| 2016 | 3,079,434 | 7,949,667 | 39% | 1,116 | 3,120 | 36% |
| 2017 | 3,095,381 | 8,002,681 | 39% | 1,119 | 3,107 | 36% |
| 2018 | 3,119,061 | 8,072,580 | 39% | 1,147 | 3,179 | 36% |
| 2019 | 3,131,045 | 8,122,020 | 39% | 1,132 | 3,018 | 38% |
| 2020 | 3,130,254 | 8,139,158 | 38% | 1,029 | 3,010 | 34% |
| 2021 | 3,094,198 | 8,078,797 | 38% | 1,062 | 2,957 | 36% |
Chart 2 provides the actual number of child and youth deaths per year and shows the percentage of deaths in Ontario as a proportion of the national total. Between 2010 and 2021, the year-to-year totals have remained fairly consistent. From 2019 to 2020, there was a slight decrease in the proportion of deaths in Ontario in comparison to the national total, however it increased again in 2021.
Chart 3: Distribution of child and youth deaths across age groups, 2019—2021
| Age group | Ontario deaths 2019 | OCC deaths 2019 | Proportion of deaths investigated by coroner 2019 | Ontario deaths 2020 | OCC deaths 2020 | Proportion of deaths investigated by coroner2020 | Ontario deaths 2021 | OCC deaths 2021 | Proportion of deaths investigated by coroner 2021 |
|---|---|---|---|---|---|---|---|---|---|
| 0-4 | 729 | 193 | 26% | 669 | 166 | 25% | 683 | 161 | 24% |
| 5-9 | 63 | 33 | 52% | 42 | 26 | 62% | 53 | 29 | 55% |
| 10-14 | 73 | 50 | 68% | 84 | 54 | 64% | 67 | 43 | 64% |
| 15-19 | 267 | 215 | 81% | 234 | 190 | 81% | 259 | 223 | 86% |
| Total | 1,132 | 491 | 43% | 1,029 | 436 | 42% | 1,062 | 456 | 43% |
Chart 3.1: Proportion of Ontario death investigation by the OCC across age groups, 2019—2021
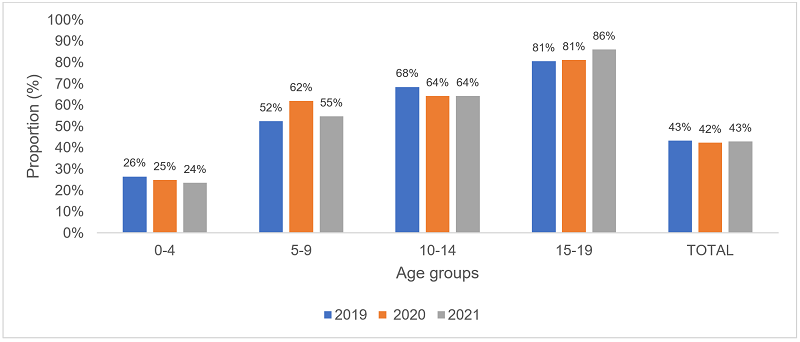
Charts 3 and 3.1 illustrate that between 2019 and 2021, approximately 43% of all child and youth deaths in Ontario were investigated by the OCC. When broken down by age groups, the proportion of deaths investigated increases as the age of the young people increase. For example, for all three years the OCC investigated less than 26% of all deaths for children between the age of 0 and 4 years, whereas, more than 80% of deaths were investigated for youth between the age of 15 and 19 years.
Chart 4: Manner of death in OCC investigations, ages 0—19, 2019—2021
Please note that approximately 2% of the manner of deaths reported for 2021 are preliminary and may change in future reports.
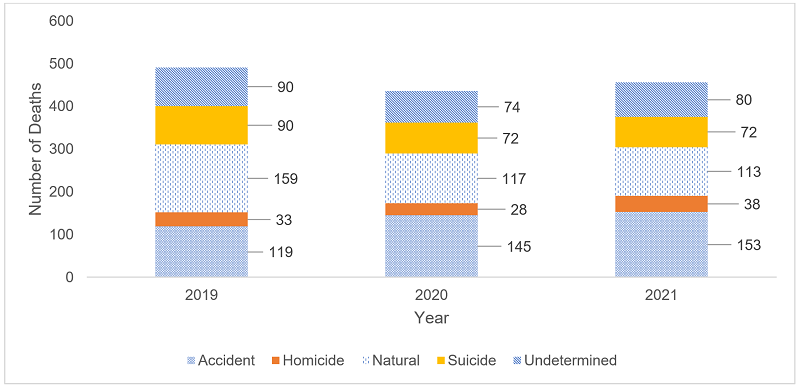
In 2019, natural deaths were most common deaths investigated by the OCC, followed by accident. However, in the following two years, accident was the most common manner of death, followed by natural deaths. Across all the three years, homicide was the least common manner of death.
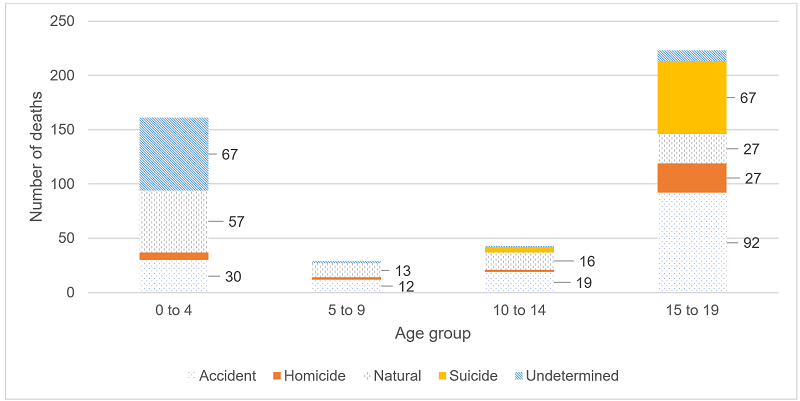
Chart 4.1: Manner of death in OCC investigations - Distribution across age groups (2021)
The highest number of children between the age of 0 and 4 years died of undetermined causes, followed by natural deaths. For children between the ages of 5 and 14 years, natural and accident were the most common manners of death. For youth between the ages of 15 and 19 years, accident was the most common manner of death, followed by suicide.
Accidental deaths
Chart 4.2: Most common death factors for accidental deaths in 2021
| Death factor | Percent of total accidental deaths |
|---|---|
| Acute Drug toxicity | 29% |
| Trauma - Motor Vehicle Collision | 27% |
| Drowning – Lakes, Ponds, Rivers et cetera | 5% |
In 2021, there were 153 deaths where the manner of death was classified as accident. The most common cause of death was acute drug toxicity which accounted for 29% of all accidental deaths investigated by the OCC. Most of the deaths from acute drug toxicity occurred among youth between the ages of 15 and 19 years. The second most common death factor was trauma as a result of motor vehicle collision, which accounted for 27% of all accidental deaths investigated by the OCC.