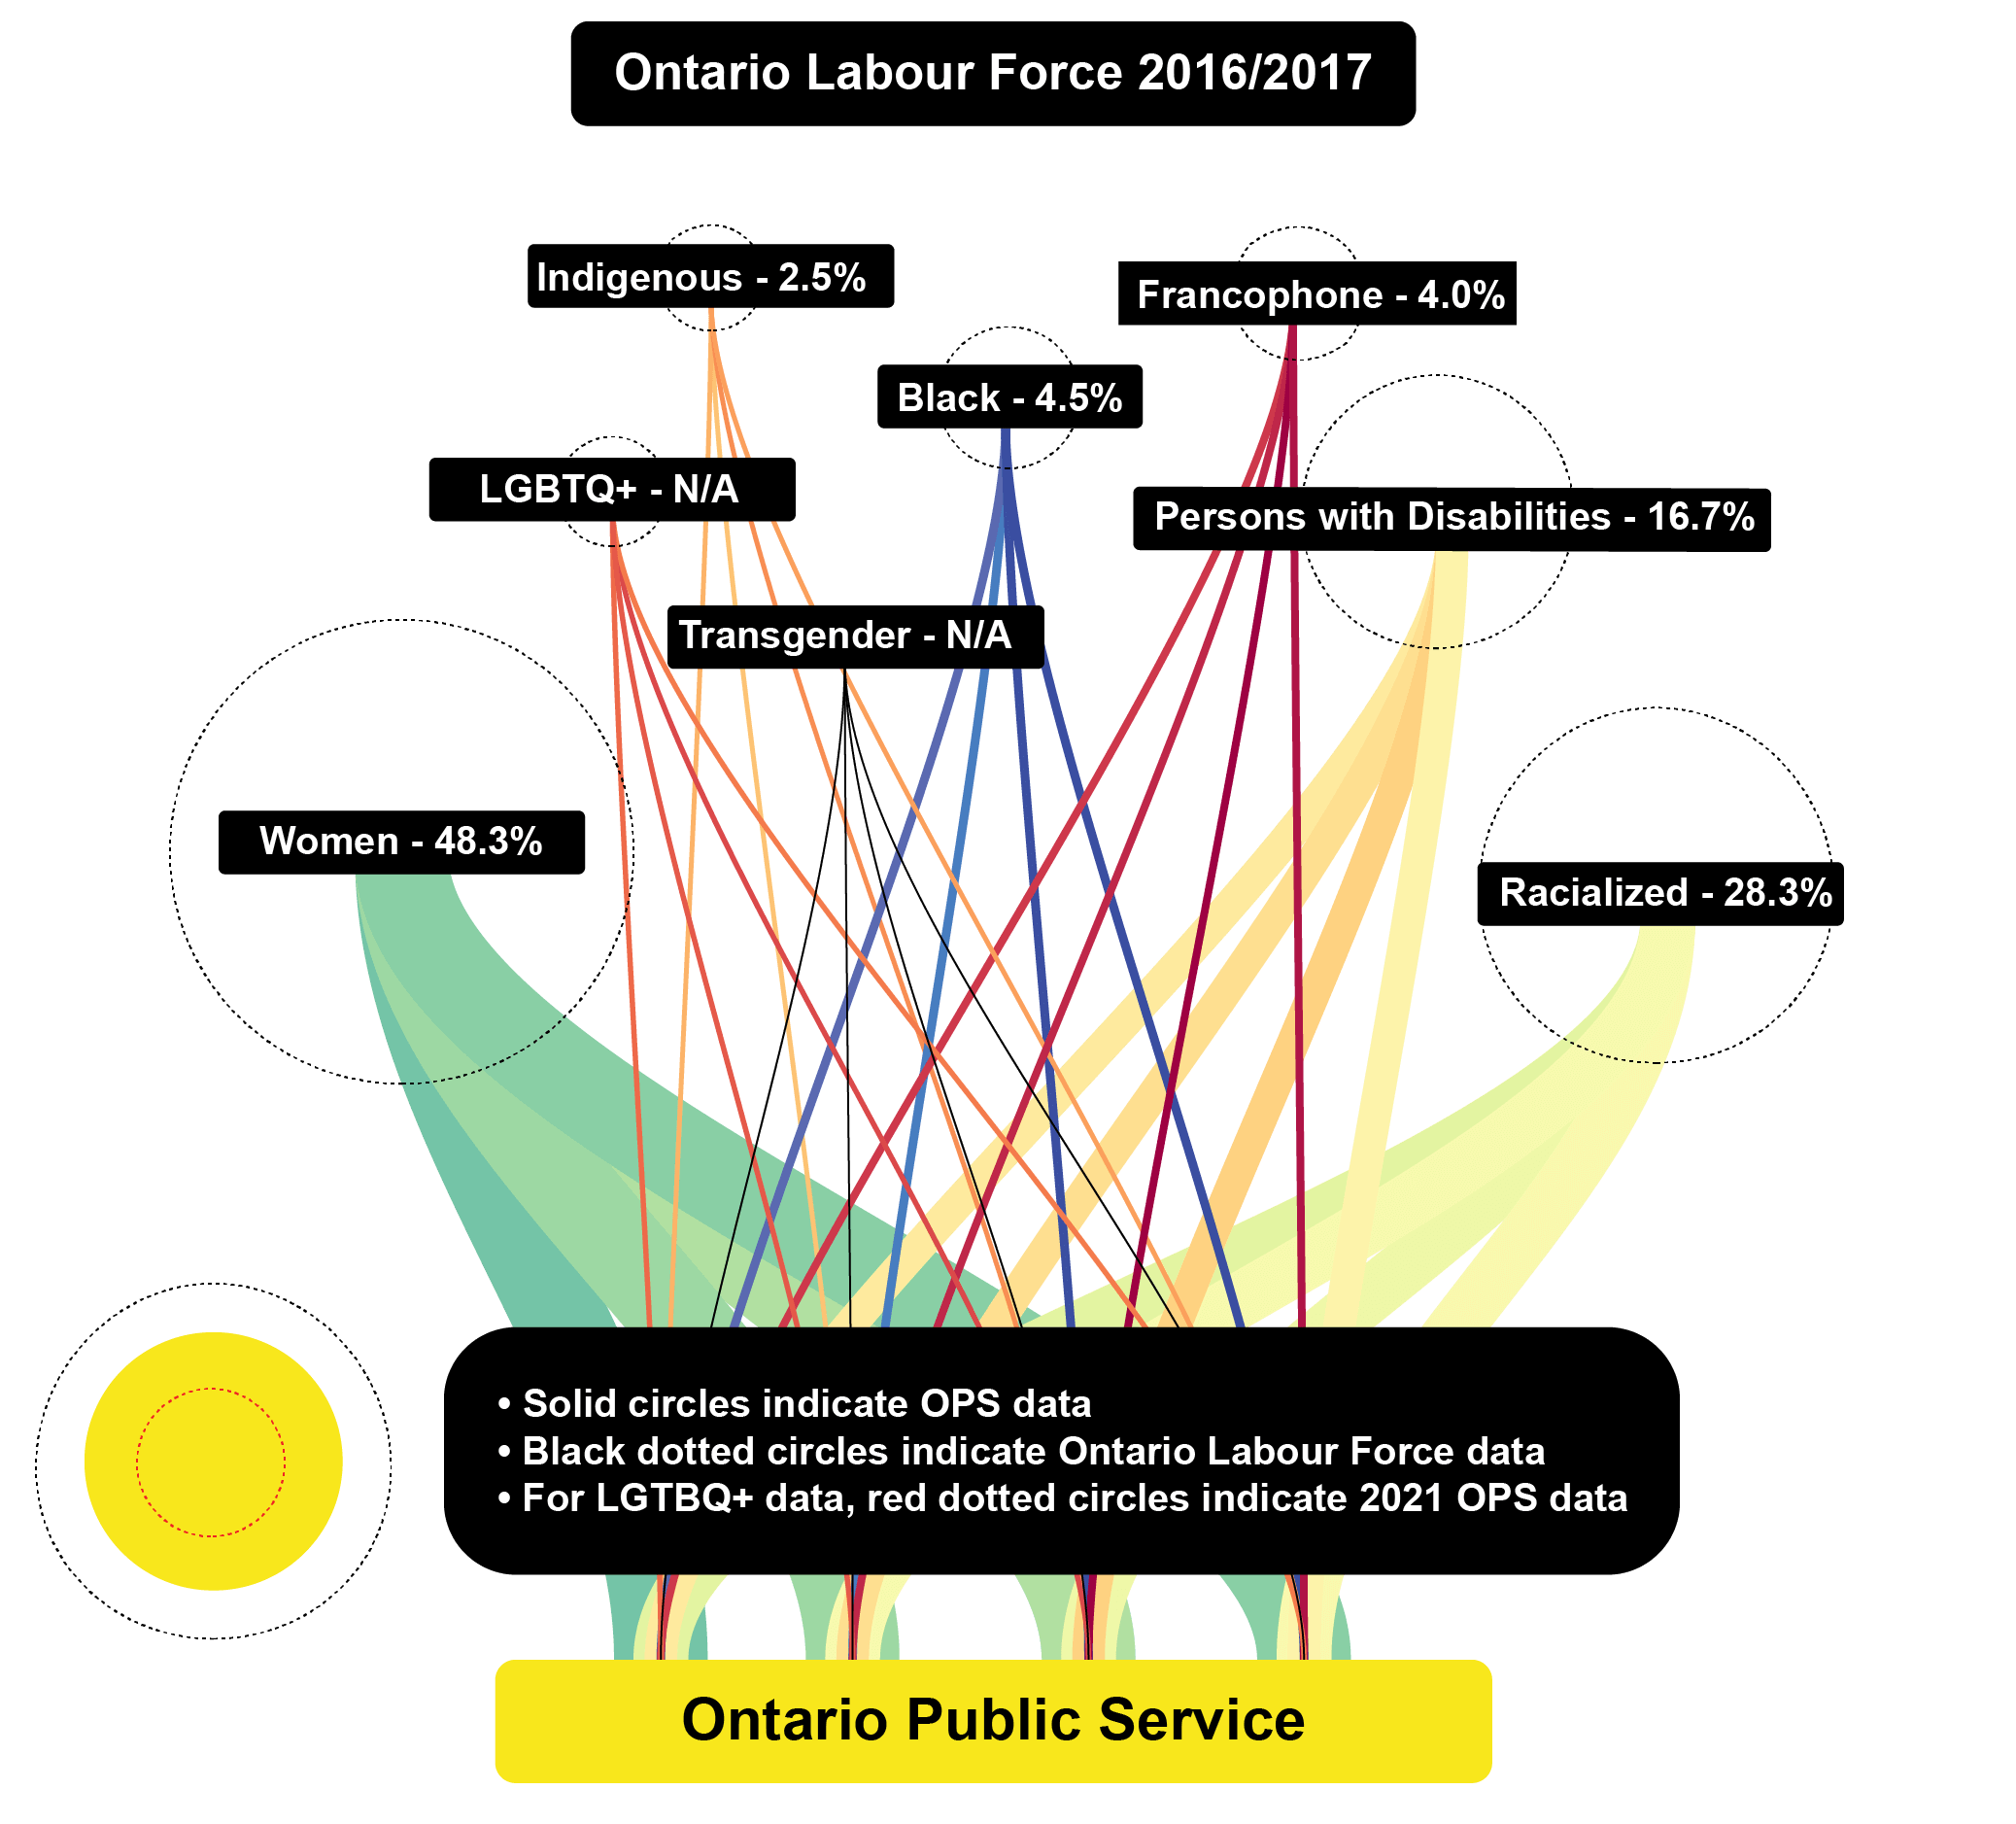
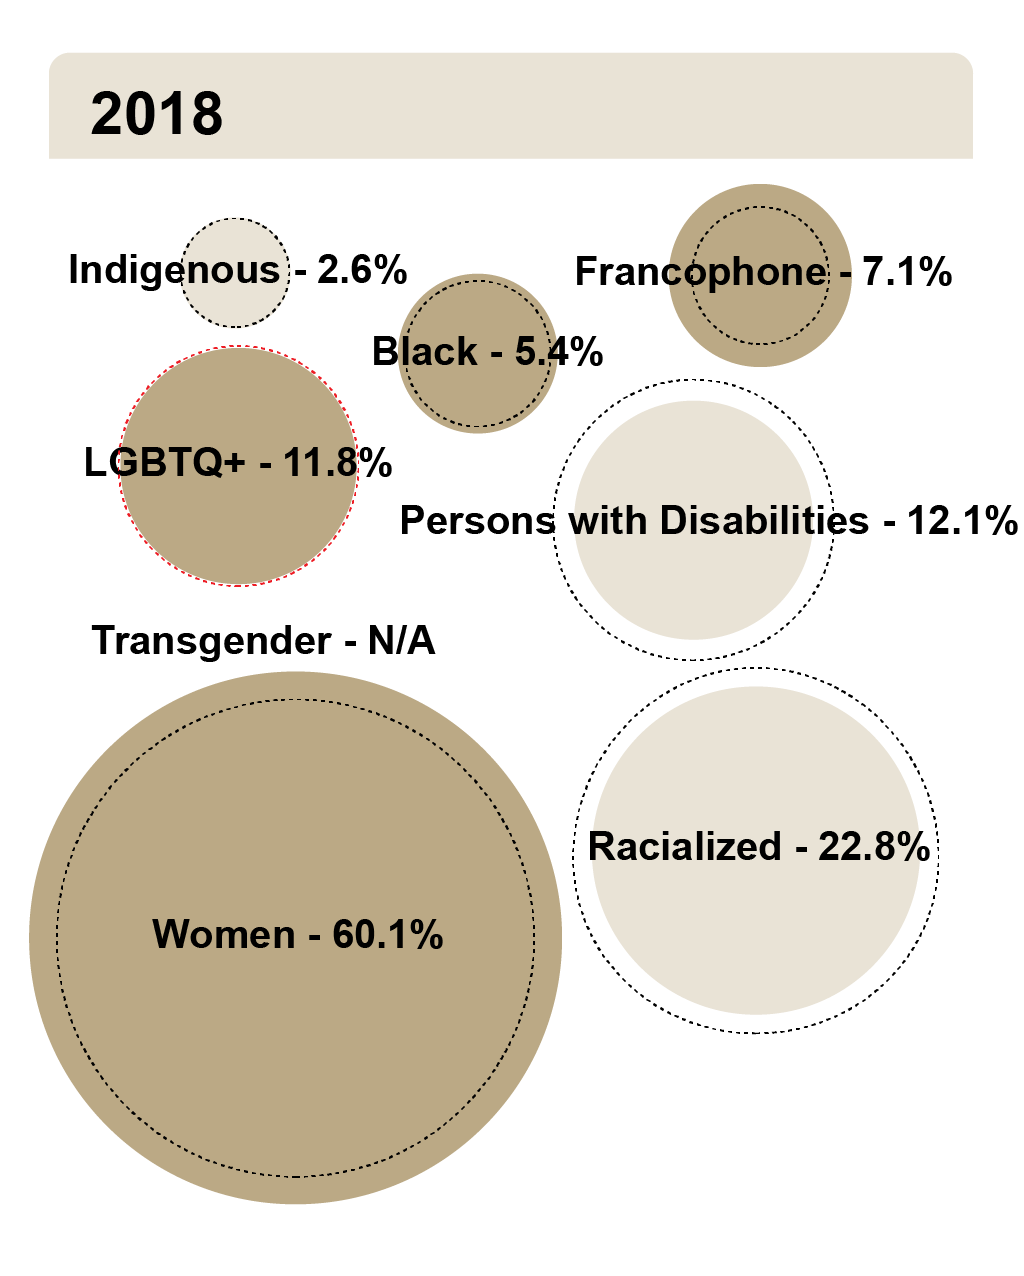
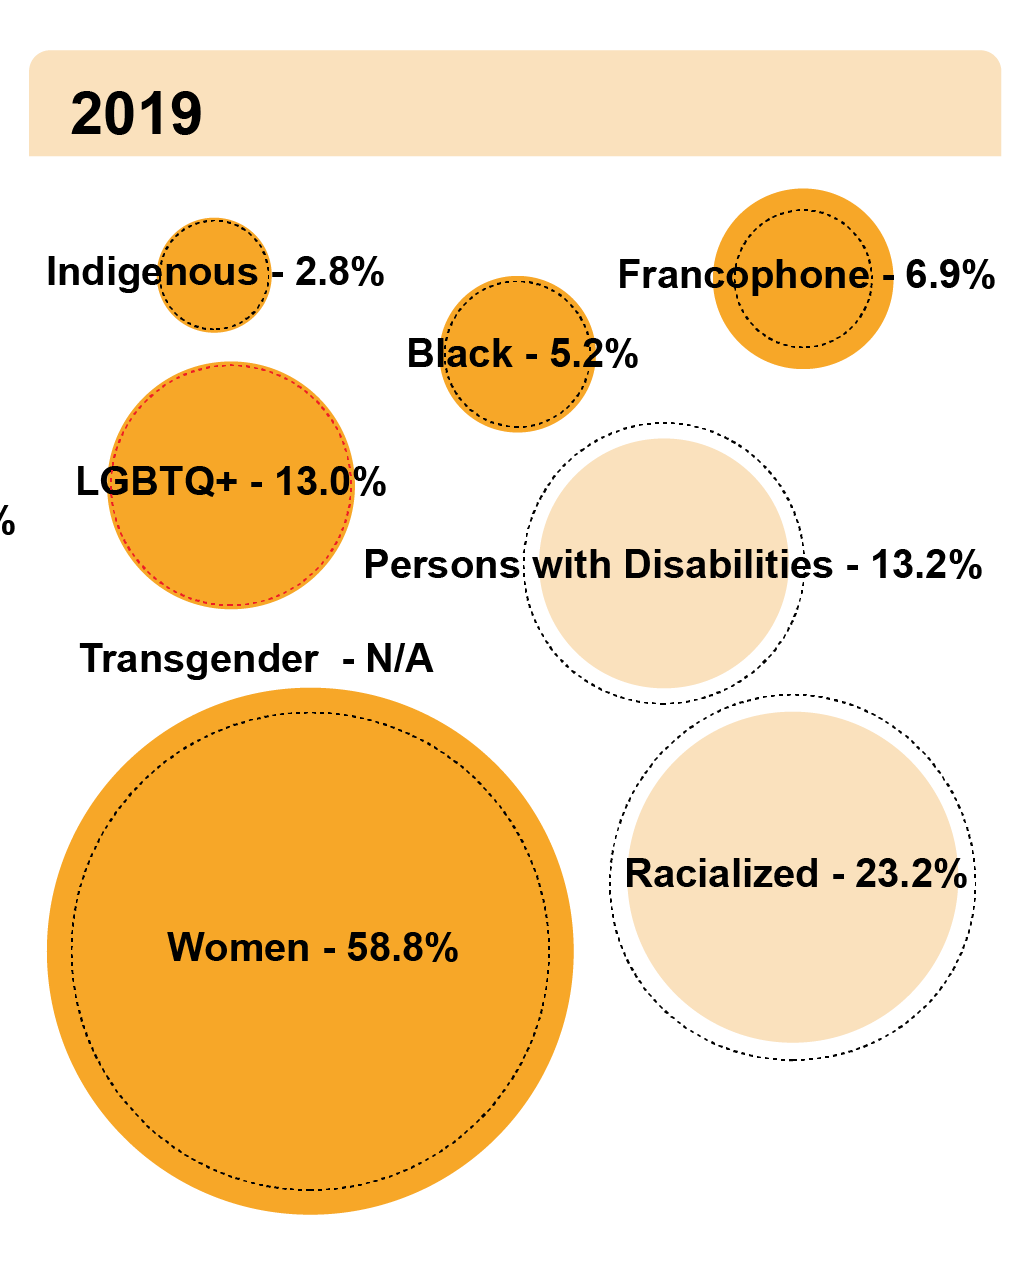
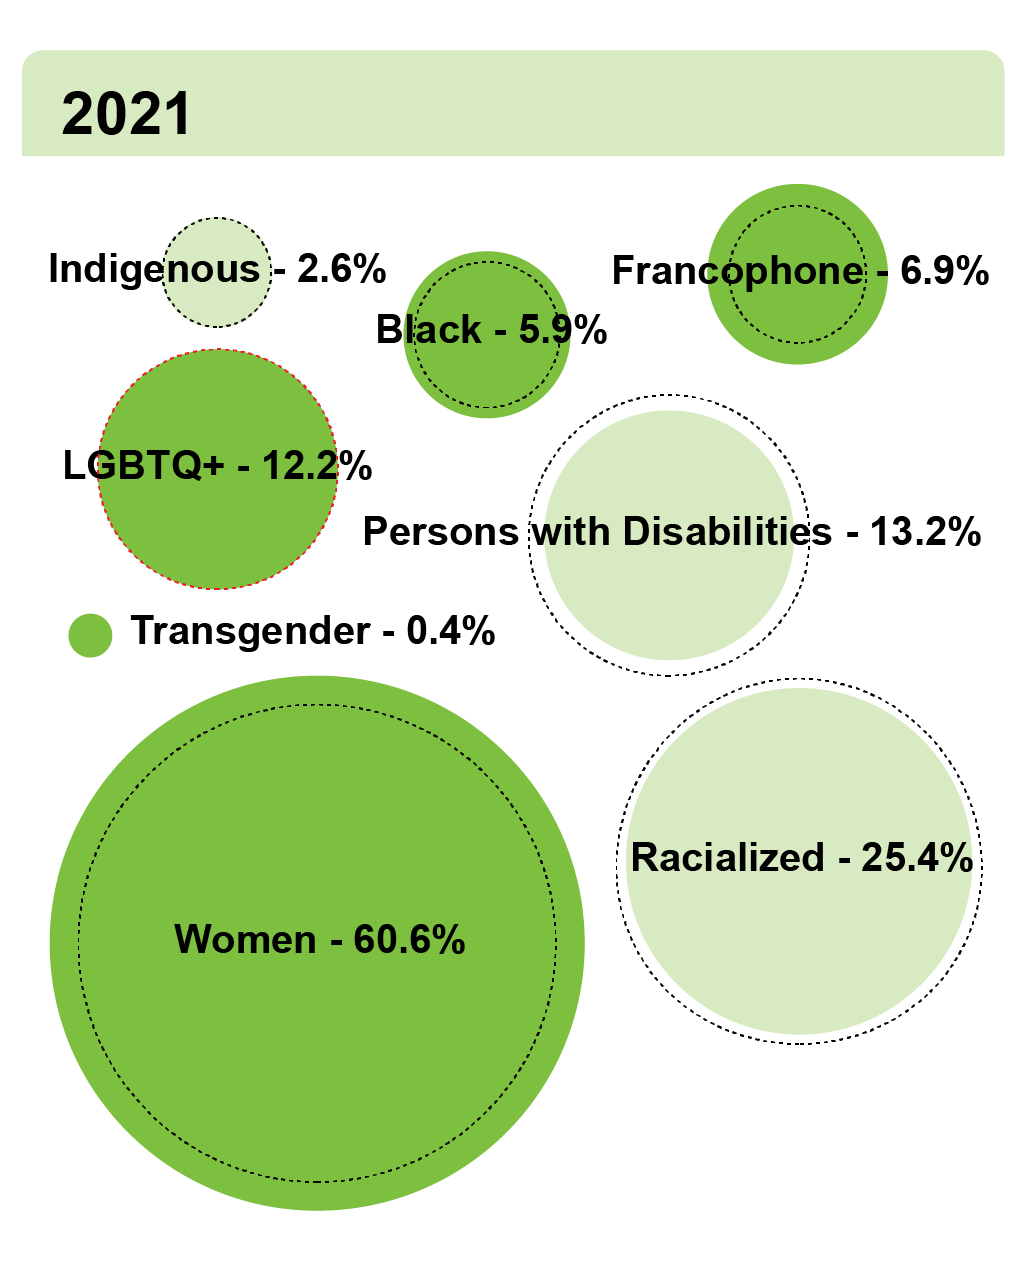
Diversity of OPS senior leadership compared to the OPS overall and to the Ontario labour force
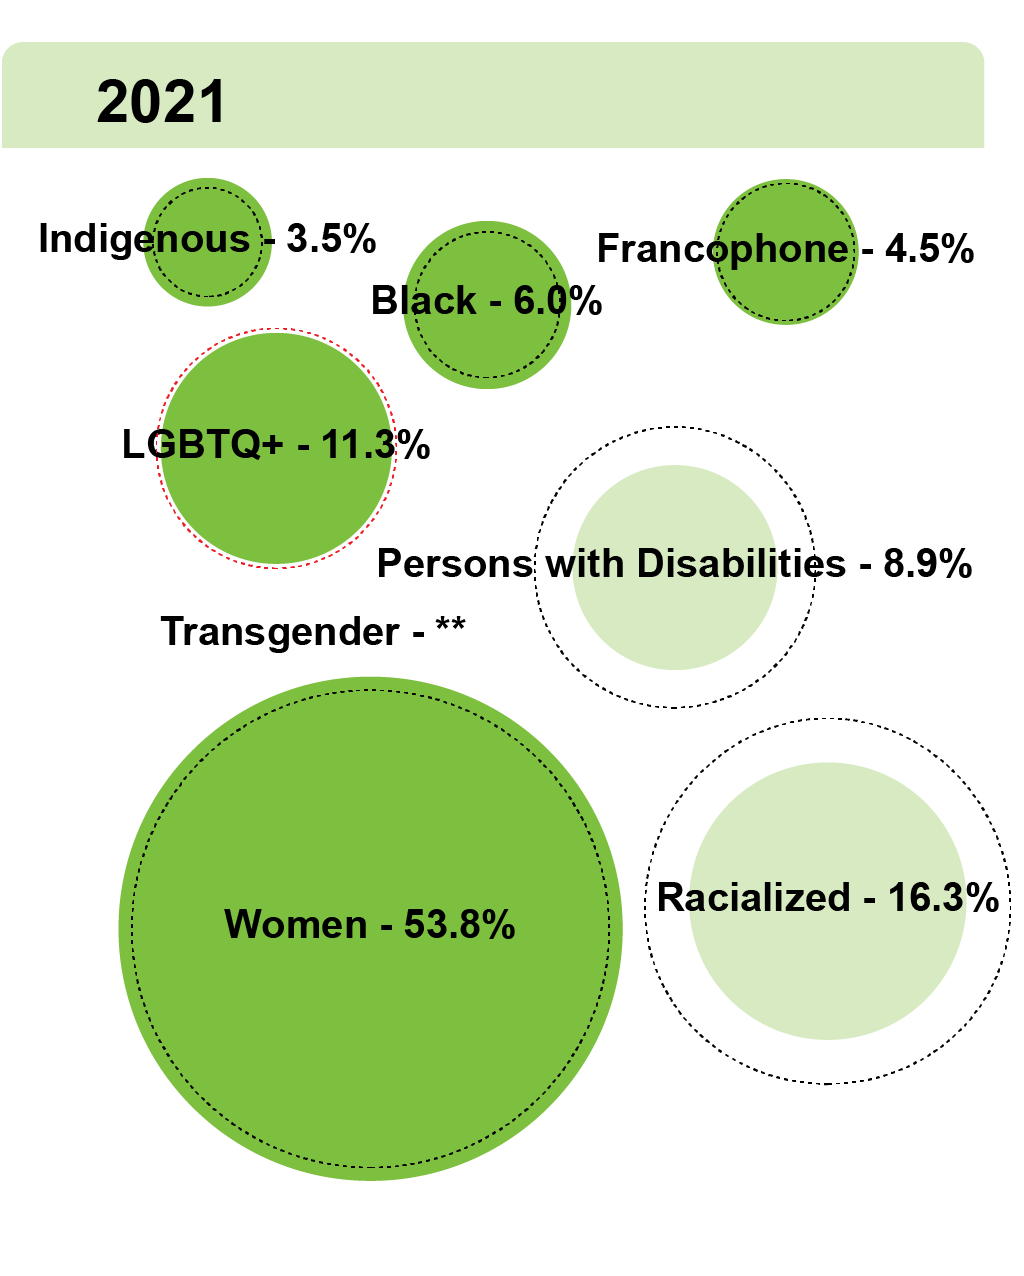
OPS senior leadership socio-demographic profile, 2018-2021
Note: This figure is for visual reference only. See the tables below this figure for the full data.
Ontario Public Service
When compared to the Ontario labour force, racialized employees and employees with disabilities have lower representation in the OPS.
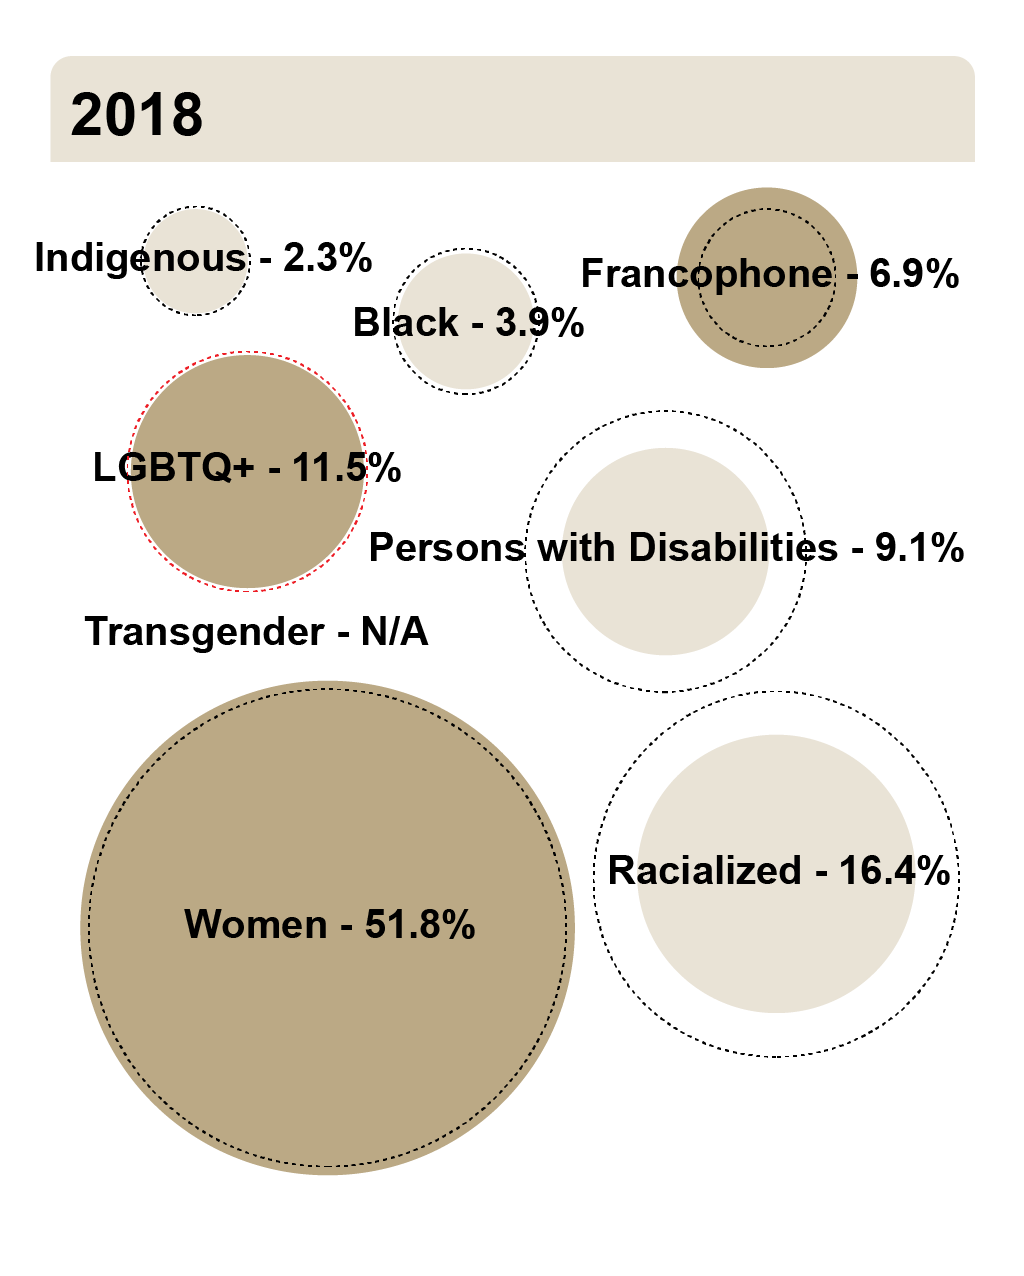
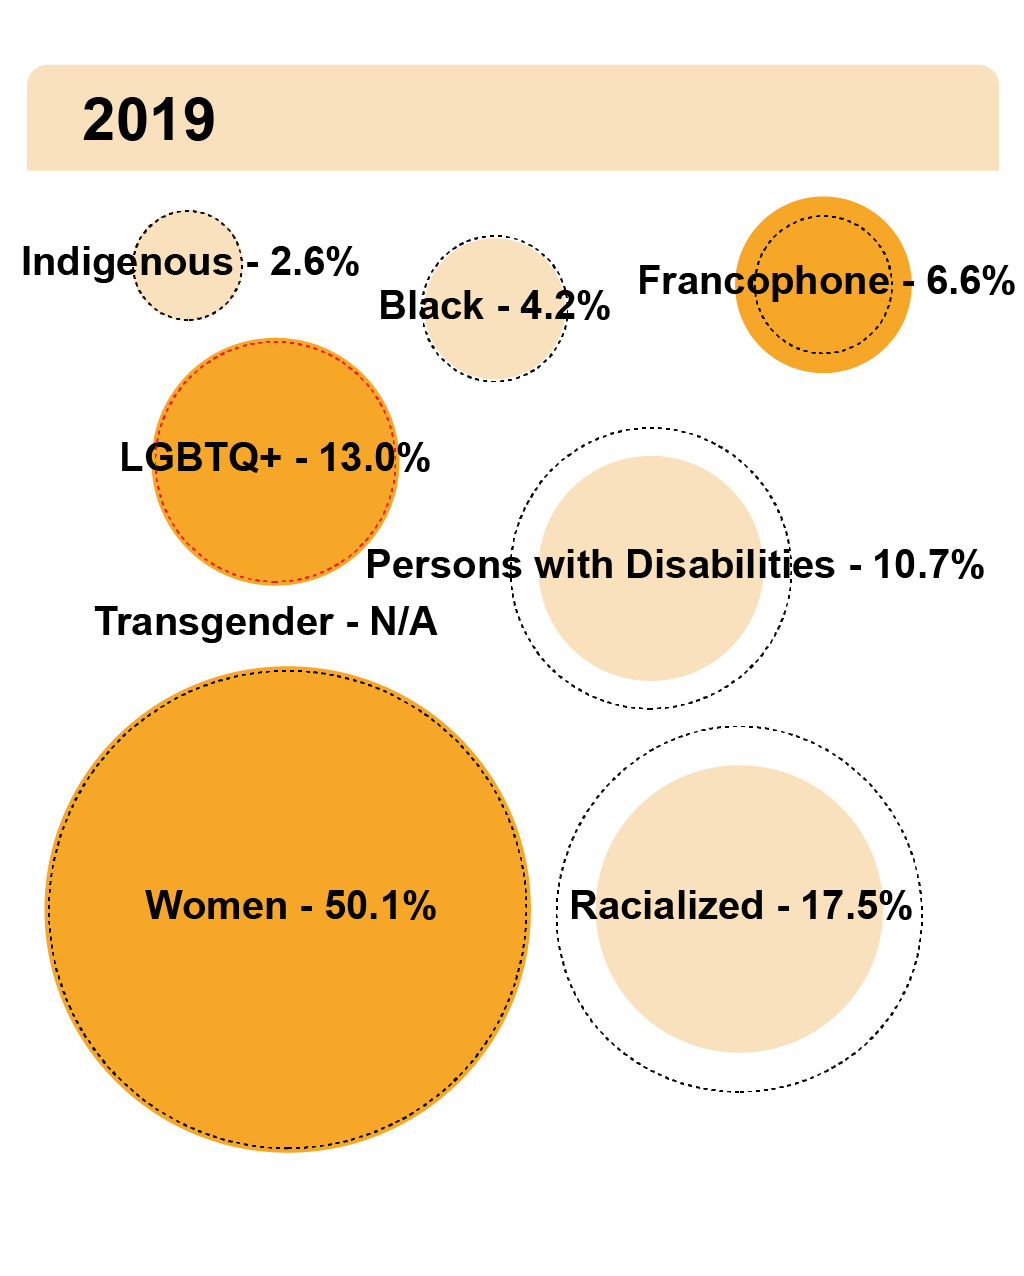
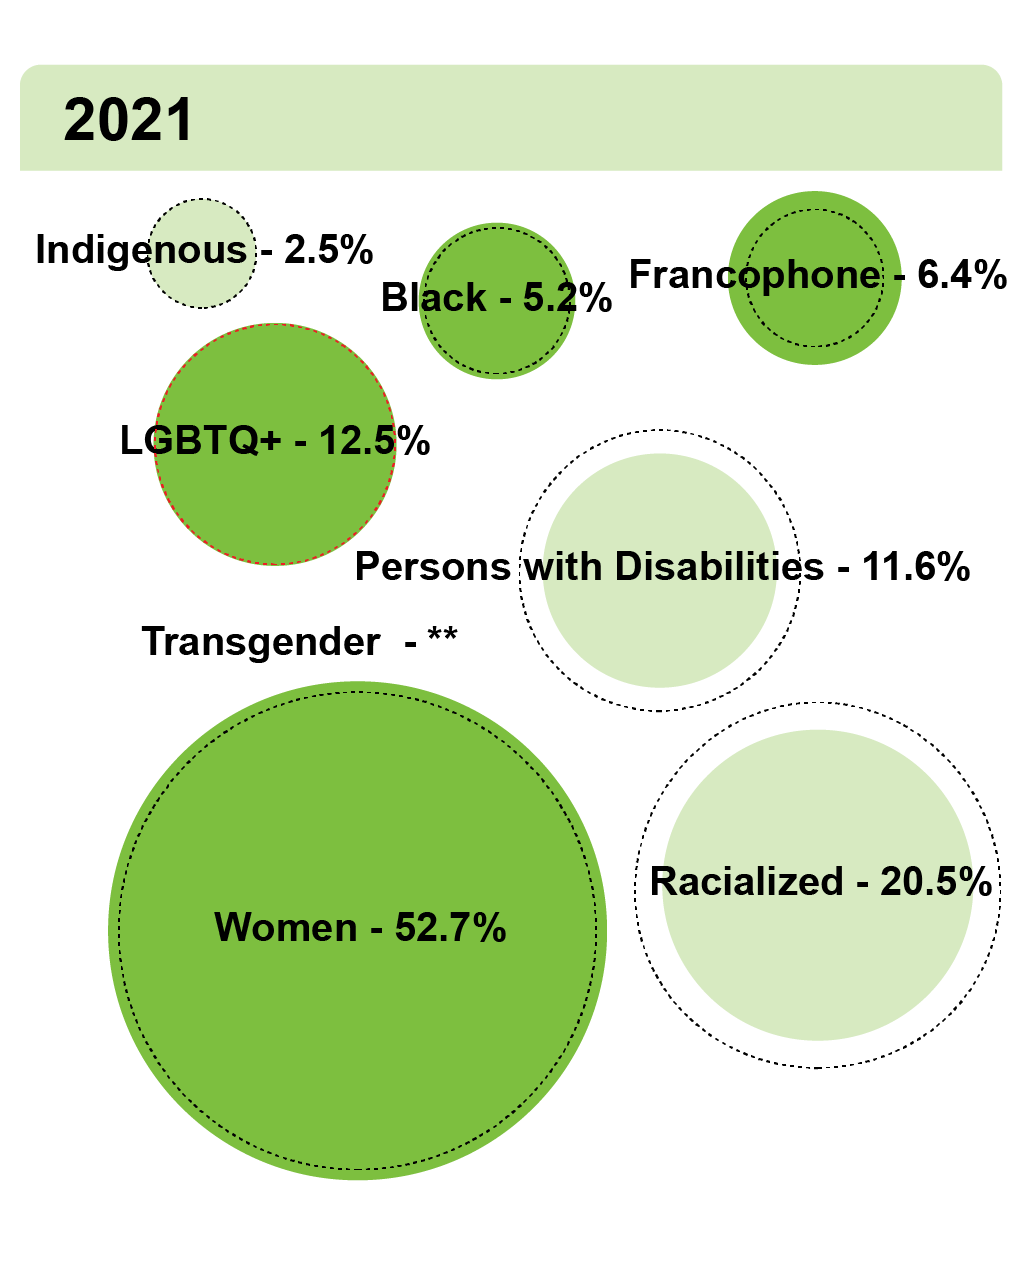
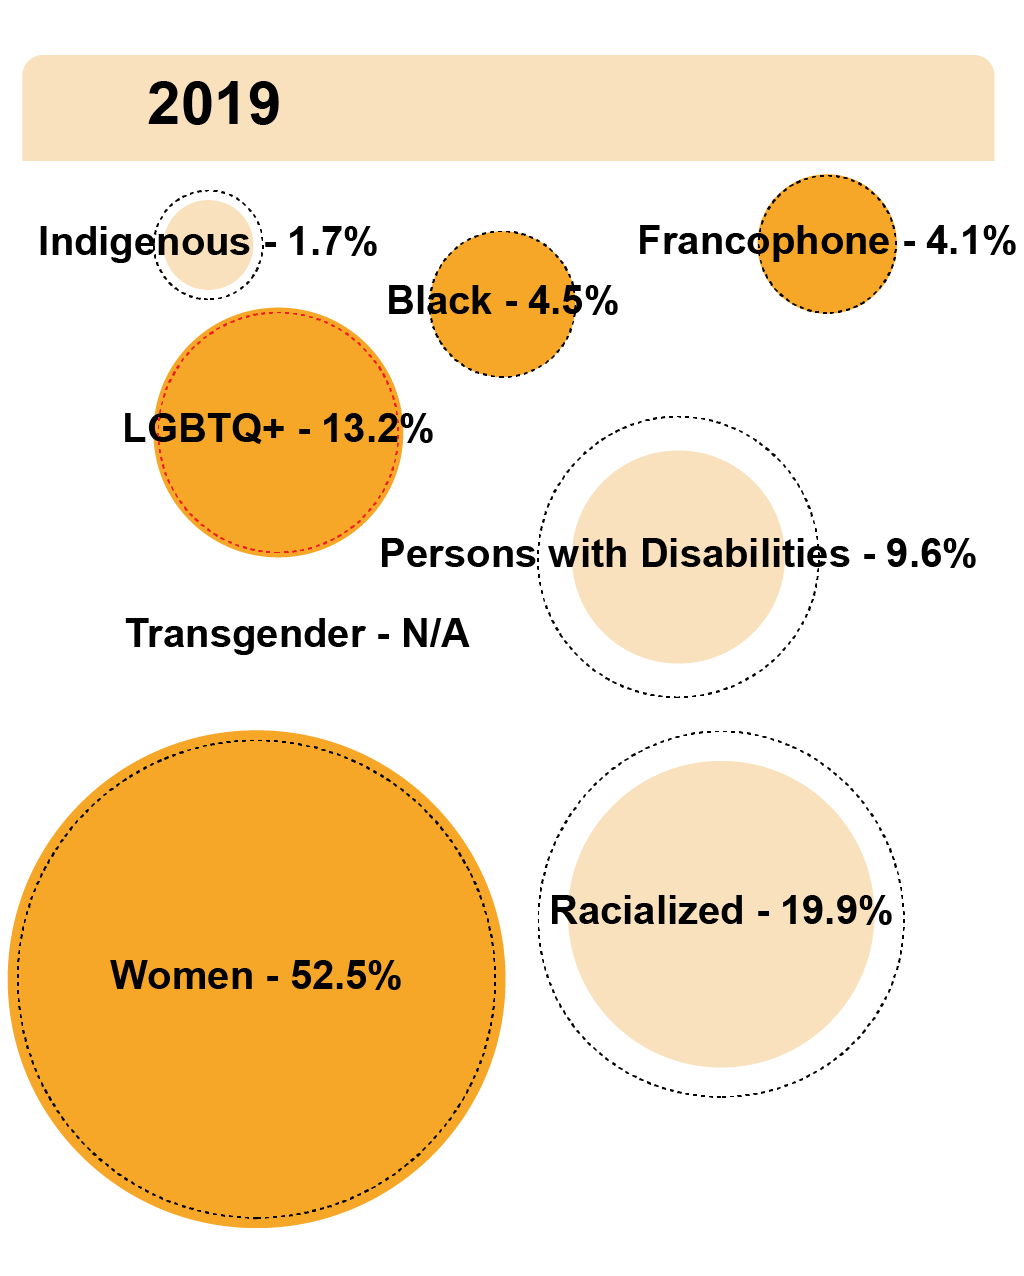
Managers
When compared to the Ontario labour force, racialized employees and employees with disabilities have lower representation in OPS management.
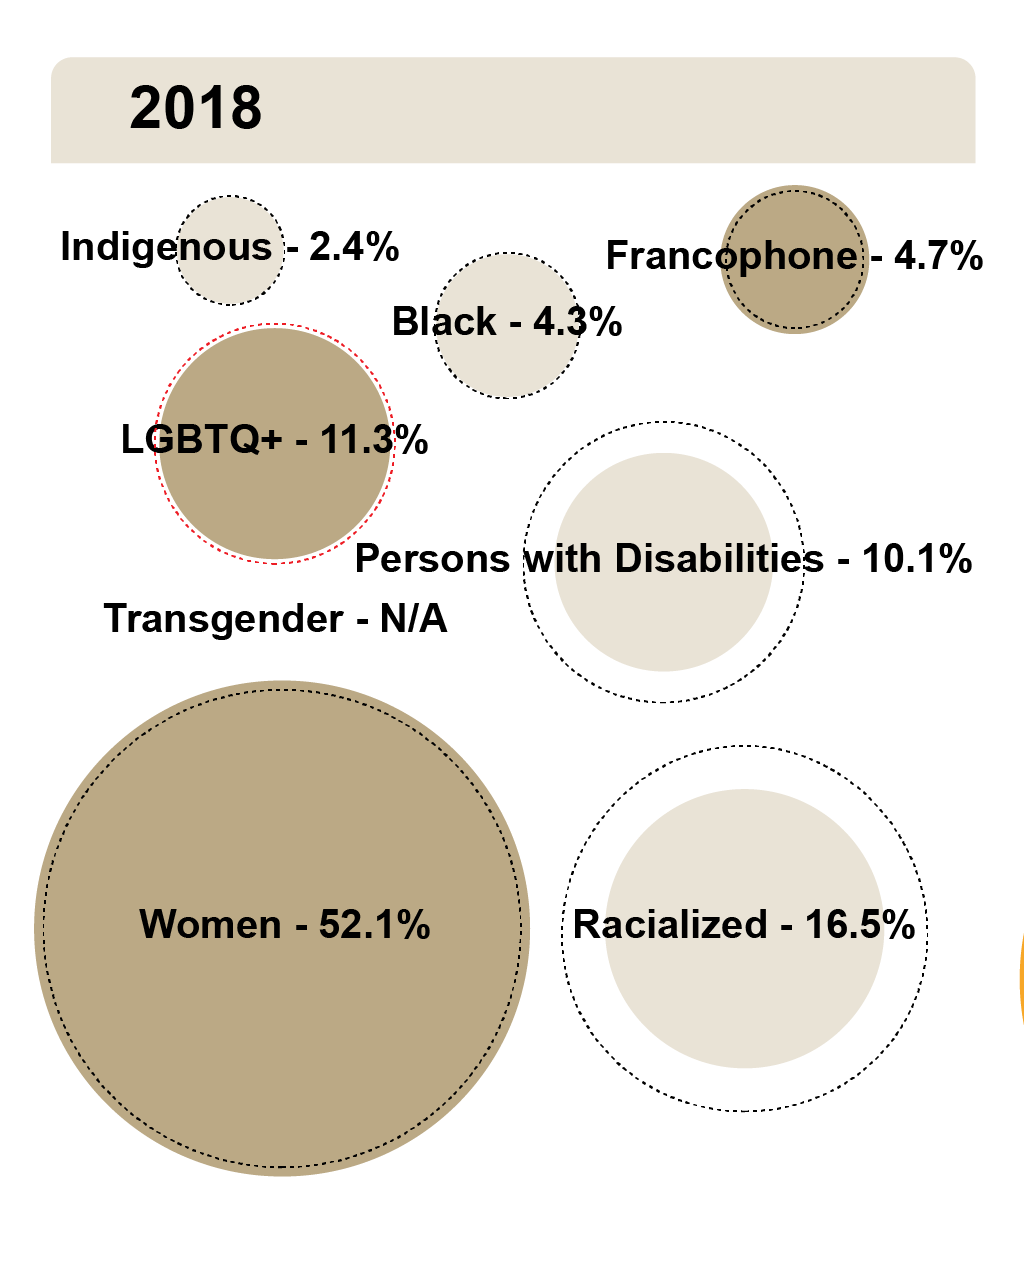
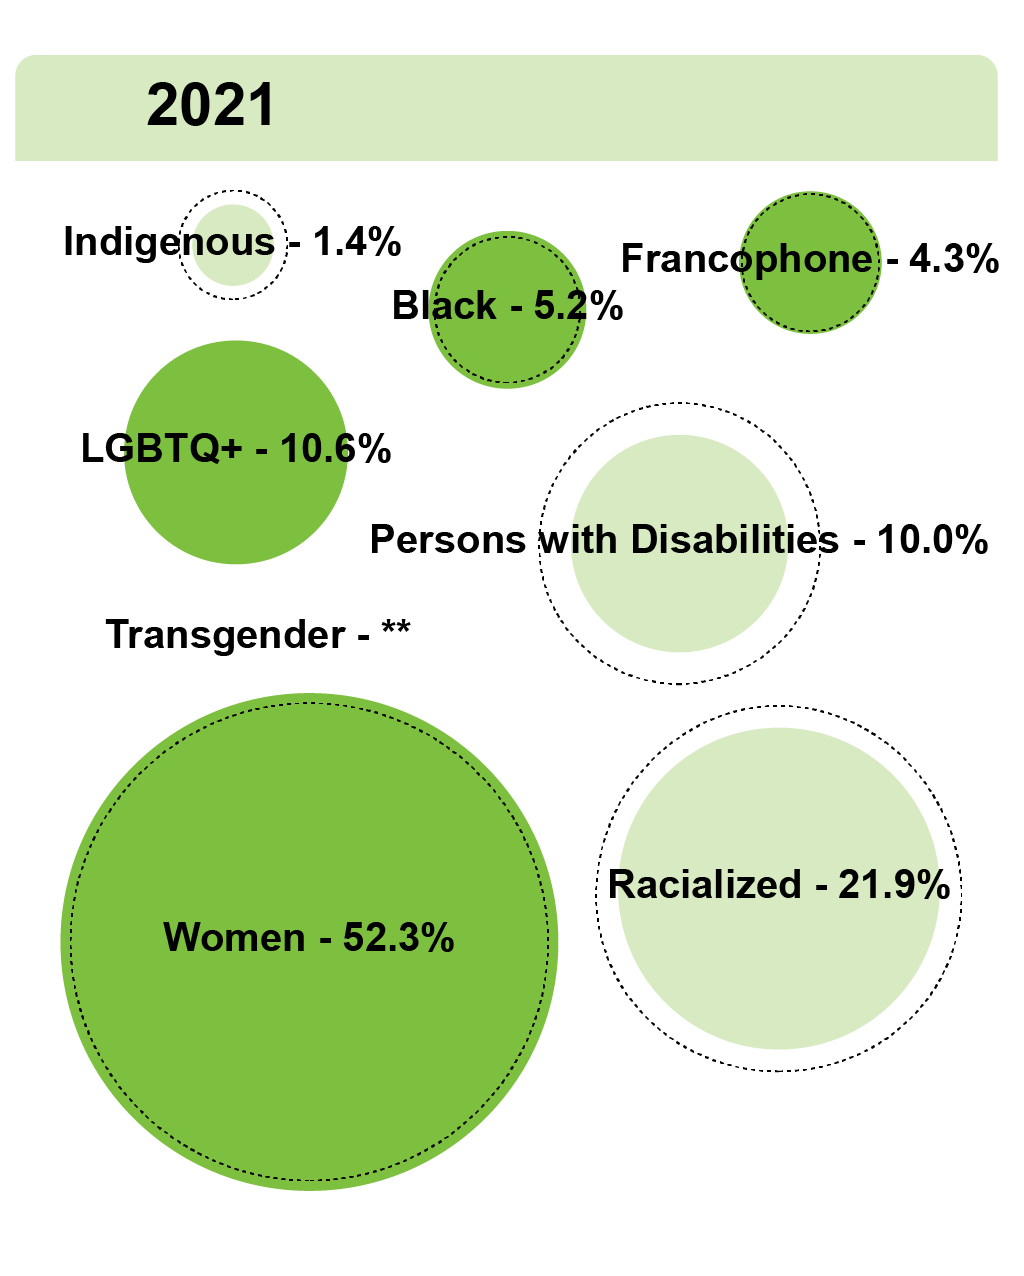
EXEC 2
When compared to the Ontario labour force, Indigenous employees, racialized employees and employees with disabilities have lower representation among directors.
EXEC 3-4 and above
Representation of racialized employees and employees with disabilities further decreases among assistant deputy ministers and deputy ministers.
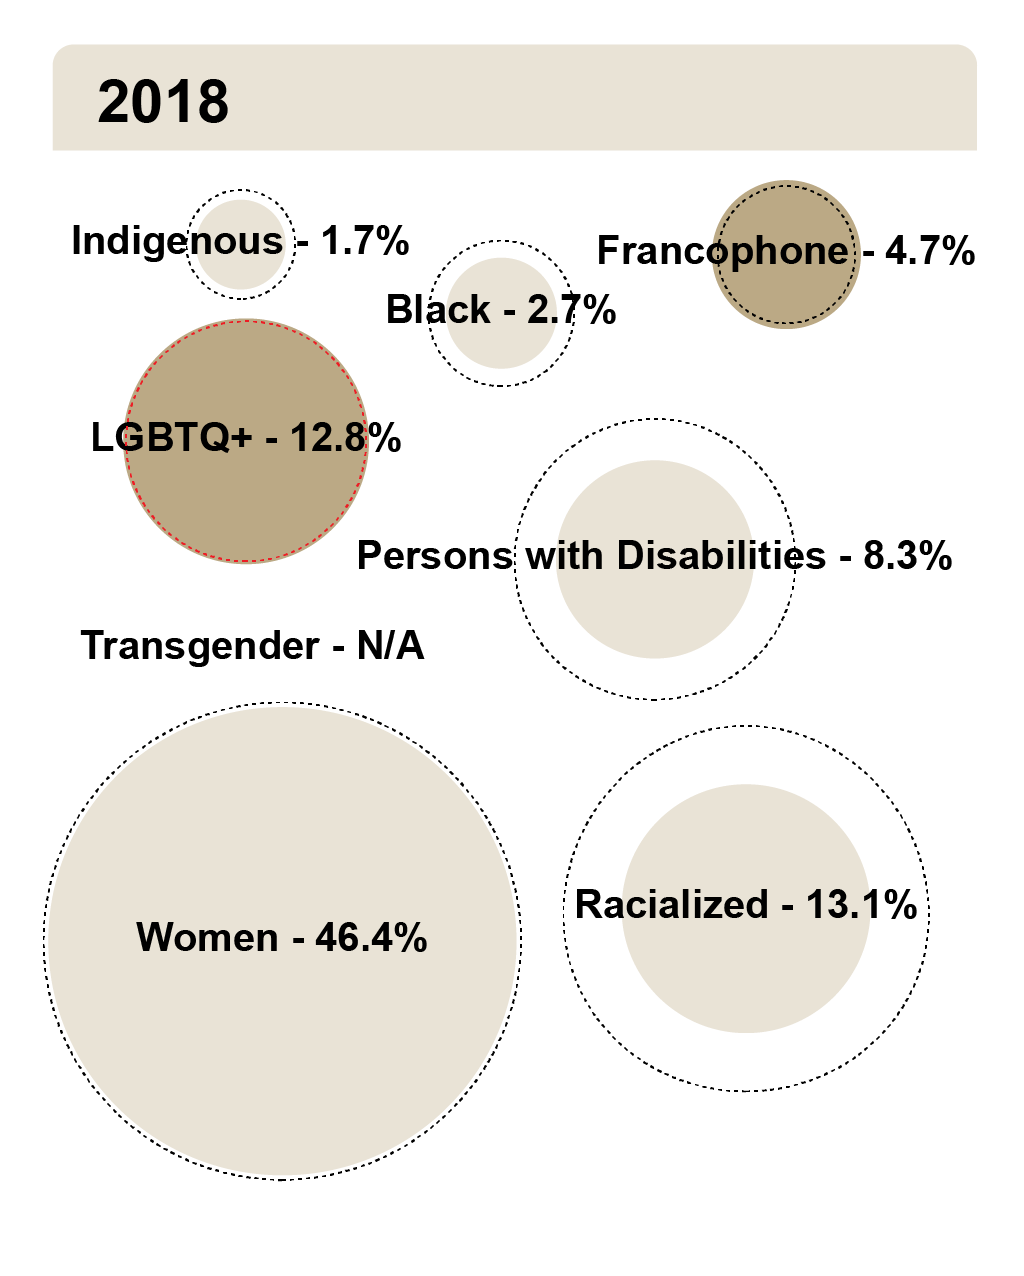
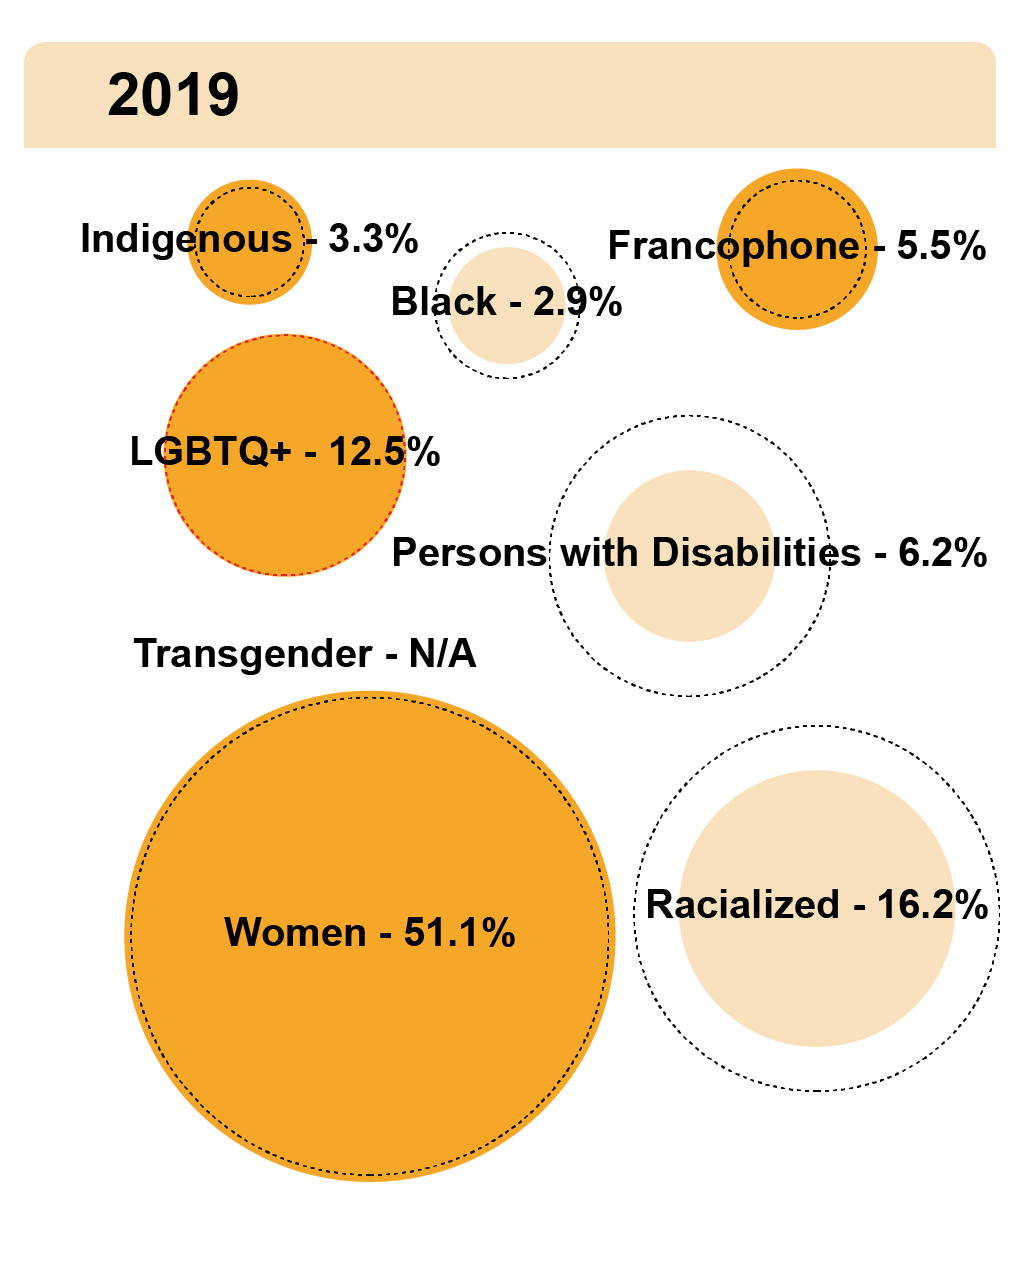
The table below shows the diversity of OPS senior leadership compared to the OPS overall and the Ontario labour force. Notes for data sources are provided in Appendices A and B.
| OPS senior leadership socio-demographic profile, 2018-2021 | Ontario labour force 2016/2017 | OPS 2018 | OPS 2019 | OPS 2021 | Managers 2018 | Managers 2019 | Managers 2021 | EXEC 2 2018 | EXEC 2 2019 | EXEC 2 2021 | EXEC 3-4 and above 2018 | EXEC 3-4 and above 2019 | EXEC 3-4 and above 2021 |
|---|---|---|---|---|---|---|---|---|---|---|---|---|---|
Gender identity |
|||||||||||||
| Men | 51.7% | 39.5% | 40.9% | 38.9% | 48.0% | 49.6% | 46.9% | 47.9% | 47.0% | 47.7% | 52.8% | 48.9% | 46.2% |
| Non-Binary and/or Two-Spirit | N/A | 0.4% | 0.4% | 0.6% | ** |
0.3% | 0.4% | 0.0% | ** |
** |
** |
0.0% | ** |
| Women | 48.3% | 60.1% | 58.8% | 60.6% | 51.8% | 50.1% | 52.7% | 52.1% | 52.5% | 52.3% | 46.4% | 51.1% | 53.8% |
| Francophone | 4.0% | 7.1% | 6.9% | 6.9% | 6.9% | 6.6% | 6.4% | 4.7% | 4.1% | 4.3% | 4.7% | 5.5% | 4.5% |
| LGBTQ+ | N/A | 11.8% | 13.0% | 12.2% | 11.5% | 13.0% | 12.5% | 11.3% | 13.2% | 10.6% | 12.8% | 12.5% | 11.3% |
Sexual orientation |
|||||||||||||
| Straight or Heterosexual | 97.3% | 88.2% | 87.0% | 87.1% | 88.5% | 87.0% | 87.1% | 88.7% | 86.8% | 88.8% | 87.2% | 87.5% | 87.8% |
| Asexual | N/A | 4.9% | 6.4% | 5.8% | 4.8% | 6.7% | 5.9% | 3.3% | 3.5% | 2.8% | ** |
** |
** |
| Bisexual | N/A | 1.9% | 2.0% | 2.7% | 1.4% | 1.4% | 1.9% | 1.9% | 2.9% | 1.8% | ** |
** |
** |
| Gay | N/A | 1.8% | 1.7% | 1.8% | 2.3% | 2.1% | 2.4% | 4.2% | 3.8% | 4.2% | 6.4% | 5.7% | 6.1% |
| Lesbian | N/A | 1.0% | 0.9% | 0.9% | 1.5% | 1.2% | 1.2% | 1.4% | ** |
1.5% | ** |
** |
** |
| Pansexual | N/A | N/A | 0.3% | 0.5% | N/A | 0.3% | 0.3% | N/A | 0.0% | ** |
N/A | 0.0% | 0.0% |
| Queer | N/A | N/A | 0.4% | 0.7% | N/A | 0.3% | 0.5% | N/A | ** |
** |
N/A | ** |
** |
| Questioning | N/A | 0.3% | 0.3% | 0.4% | ** |
** |
0.4% | ** |
** |
0.0% | ** |
** |
0.0% |
| Two-Spirit | N/A | N/A | 0.1% | 0.1% | N/A | ** |
** |
N/A | 0.0% | 0.0% | N/A | ** |
0.0% |
| Transgender | N/A | N/A | N/A | 0.4% | N/A | N/A | ** |
N/A | N/A | ** |
N/A | N/A | ** |
| Persons with disabilities | 16.7% | 12.1% | 13.2% | 13.2% | 9.1% | 10.7% | 11.6% | 10.1% | 9.6% | 10.0% | 8.3% | 6.2% | 8.9% |
Severity of disability |
|||||||||||||
| Mid/Moderate | N/A | N/A | N/A | 10.1% | N/A | N/A | 9.5% | N/A | N/A | 7.7% | N/A | N/A | 7.6% |
| Severe/Very Severe | N/A | N/A | N/A | 1.5% | N/A | N/A | 0.9% | N/A | N/A | 0.5% | N/A | N/A | 0.6% |
| Indigenous | 2.5% | 2.6% | 2.8% | 2.6% | 2.3% | 2.6% | 2.5% | 2.4% | 1.7% | 1.4% | 1.7% | 3.3% | 3.5% |
| First Nations | 1.5% | 1.3% | 1.2% | 1.3% | 1.3% | 1.2% | 1.3% | 1.3% | ** |
** |
** |
** |
** |
| Inuit | 0.0% | ** |
** |
** |
** |
0.0% | 0.0% | 0.0% | 0.0% | 0.0% | ** |
** |
** |
| Métis | 0.9% | 1.1% | 1.4% | 1.3% | 0.9% | 1.3% | 1.1% | ** |
** |
** |
** |
** |
** |
| Racialized | 28.3% | 22.8% | 23.2% | 25.4% | 16.4% | 17.5% | 20.5% | 16.5% | 19.9% | 21.9% | 13.1% | 16.2% | 16.3% |
Race categories |
|||||||||||||
| Black | 4.5% | 5.4% | 5.2% | 5.9% | 3.9% | 4.2% | 5.2% | 4.3% | 4.5% | 5.2% | 2.7% | 2.9% | 6.0% |
| East/Southeast Asian | 9.9% | 7.9% | 8.1% | 8.6% | 5.2% | 5.3% | 6.4% | 4.1% | 4.3% | 4.7% | 2.7% | 3.5% | 2.8% |
| Latino/Latina/Latinx | 1.7% | 1.4% | 1.5% | 1.5% | 1.1% | 1.1% | 1.2% | 0.3% | 0.8% | 1.2% | 1.4% | 1.7% | 1.4% |
| Middle Eastern | 2.3% | 1.7% | 1.8% | 1.9% | 1.2% | 1.4% | 1.4% | 1.1% | 2.2% | 2.7% | 2.7% | 3.5% | 0.5% |
| South Asian | 8.4% | 7.5% | 7.8% | 8.4% | 5.8% | 6.1% | 7.0% | 7.5% | 8.9% | 9.3% | 4.5% | 5.2% | 5.6% |
| Another Race Category | 0.8% | 2.8% | 2.3% | 1.9% | 2.0% | 1.6% | 1.9% | 3.0% | 3.2% | 1.8% | 2.3% | 1.7% | 0.5% |
| White | 74.2% | 74.2% | 74.4% | 72.6% | 80.8% | 80.3% | 77.1% | 79.6% | 77.9% | 76.7% | 83.8% | 80.3% | 82.8% |
| Response rate | Not applicable | 61.3% | 56.9% | 63.0% | 77.5% | 77.0% | 68.8% | 86.2% | 75.6% | 98.0% | 97.5% | 81.4% | 94.6% |
Intersectional results for OPS and OPS senior leadership, 2021
The following tables present two dimensions of diversity each and include results for the OPS overall and OPS senior leadership.
Gender identity and disability
Note: This figure is for visual reference only. See the tables below this figure for the full data.
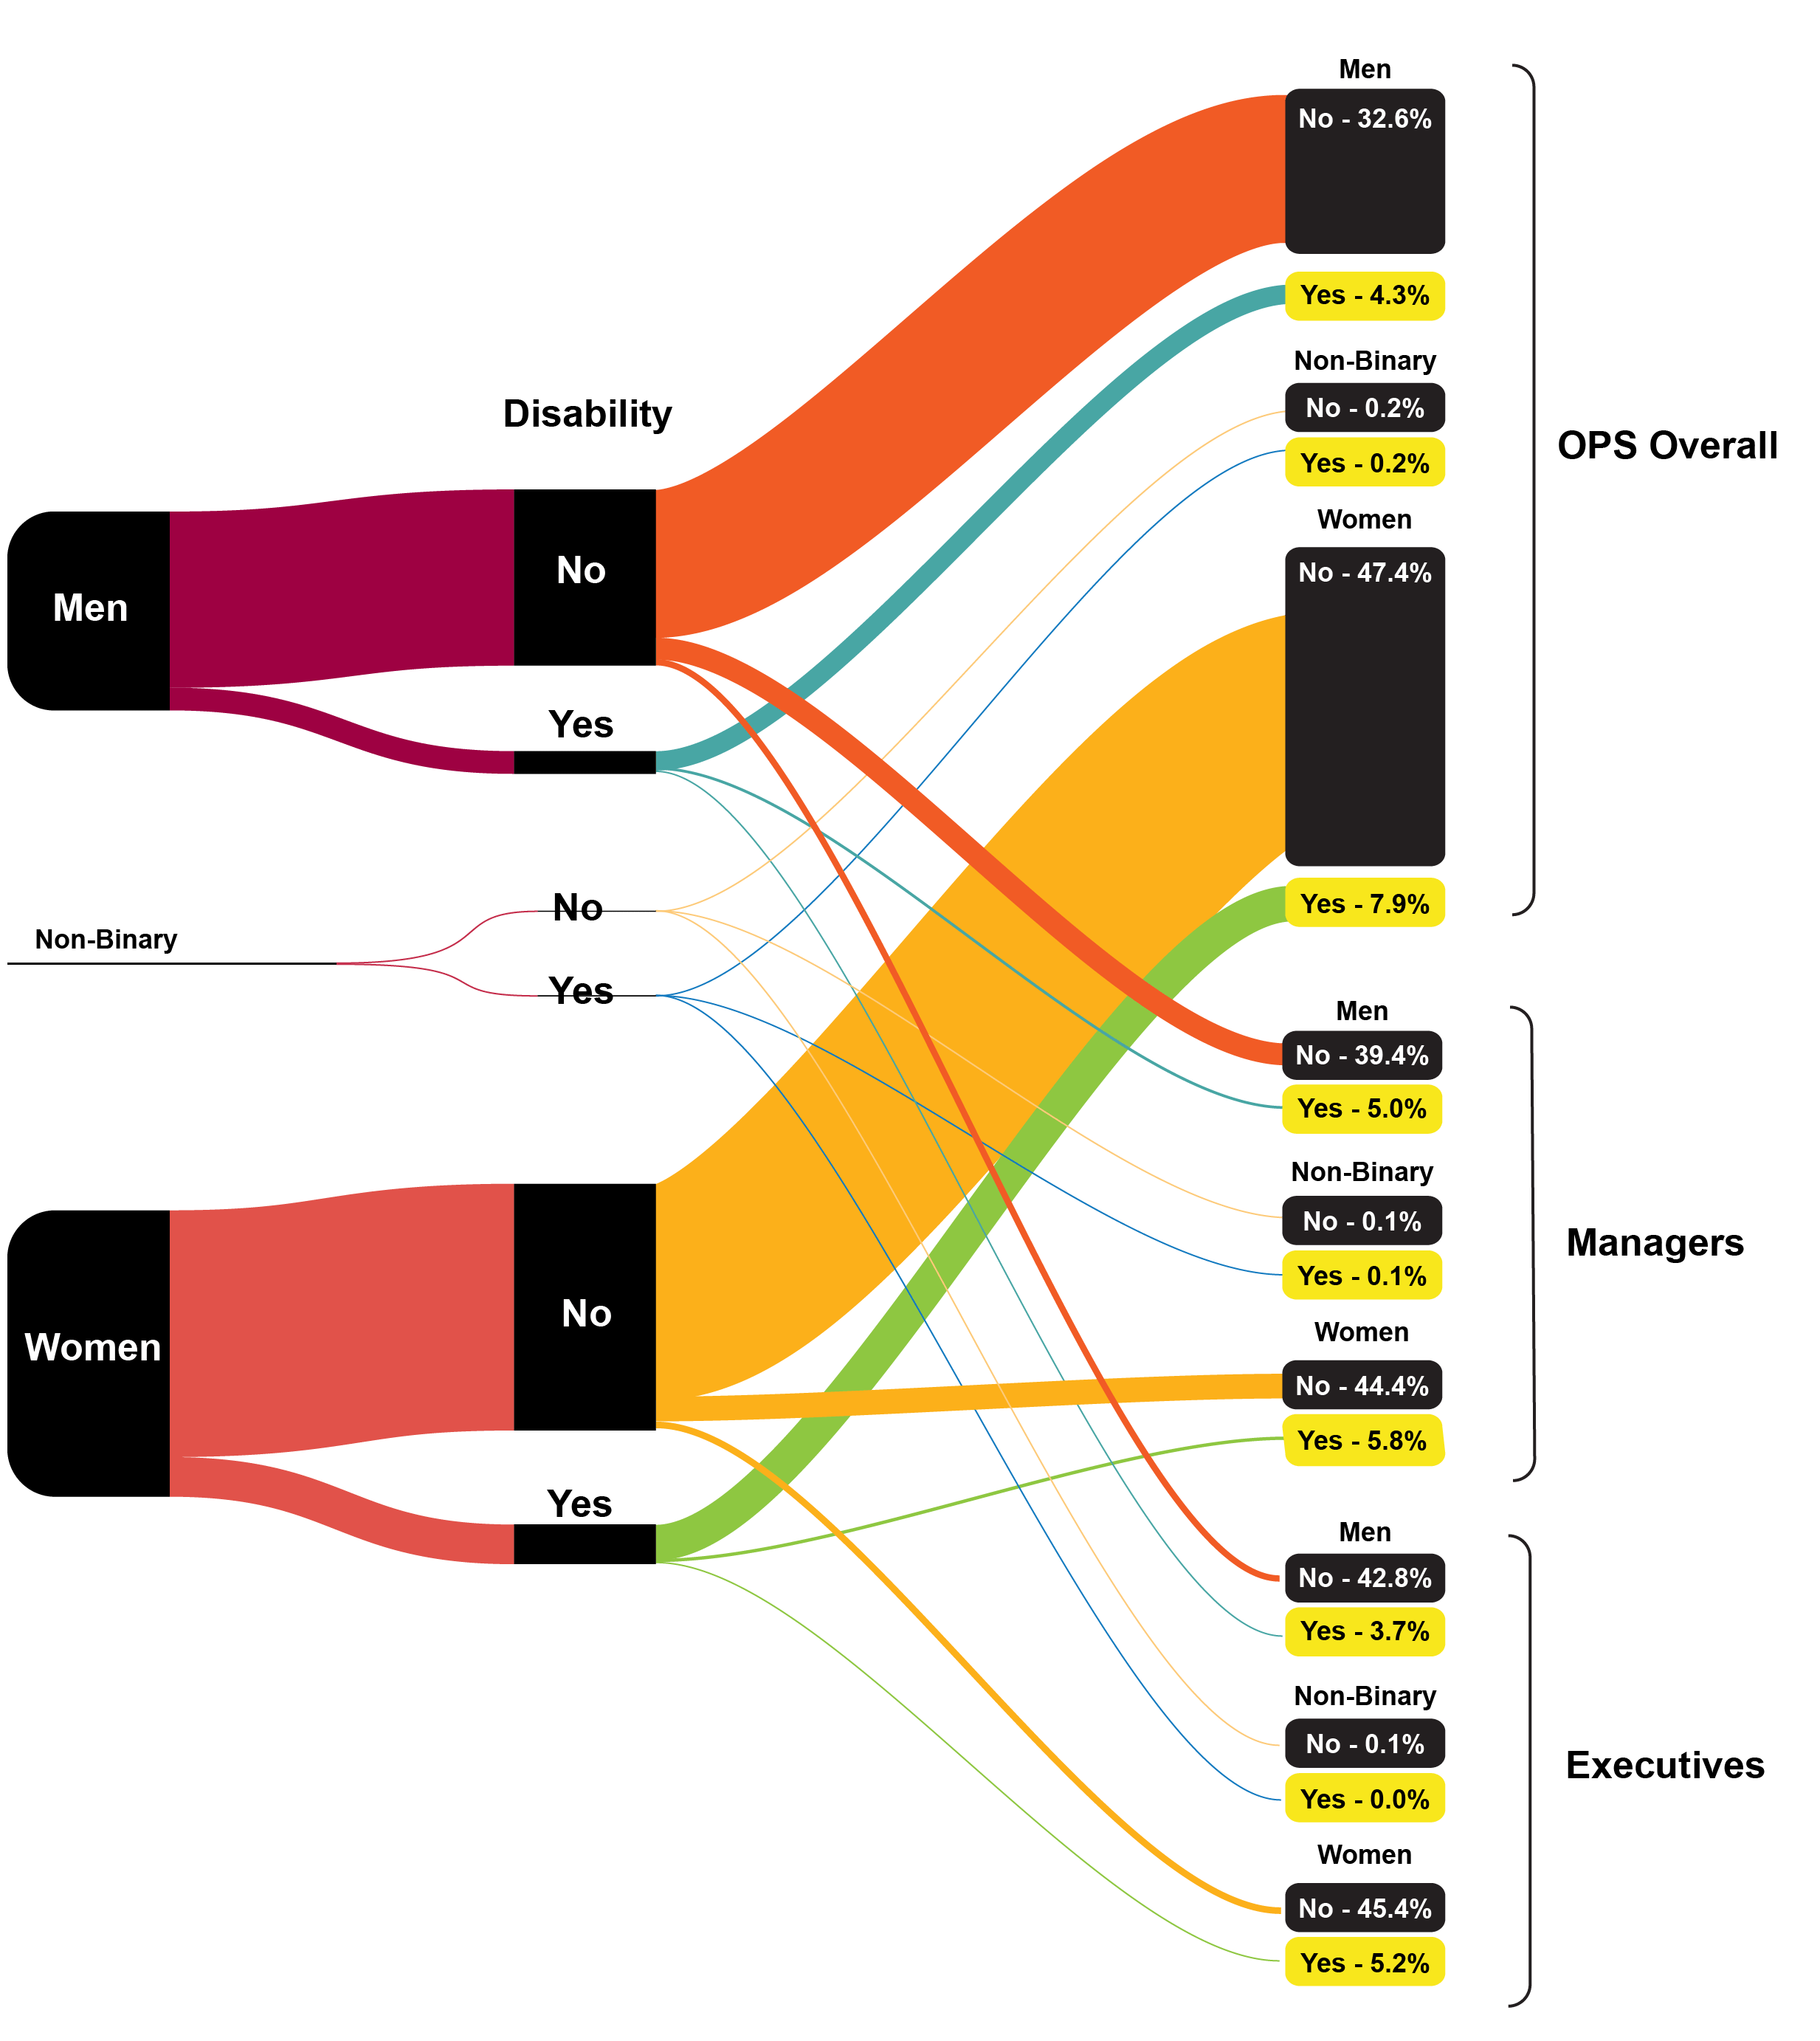
| Gender identity and disability | OPS overall | Managers | Executives |
|---|---|---|---|
| Men with disabilities | 4.3% | 5.0% | 3.7% |
| Women with disabilities | 7.9% | 5.8% | 5.2% |
| Non-Binary and/or Two-Spirit with disabilities | 0.2% | 0.1% | 0.0% |
| Men without disabilities | 32.6% | 39.4% | 42.8% |
| Women without disabilities | 47.4% | 44.4% | 45.4% |
| Non-Binary and/or Two-Spirit without disabilities | 0.2% | 0.1% | 0.1% |
Gender and Indigenous identity
Note: This figure is for visual reference only. See the tables below this figure for the full data.
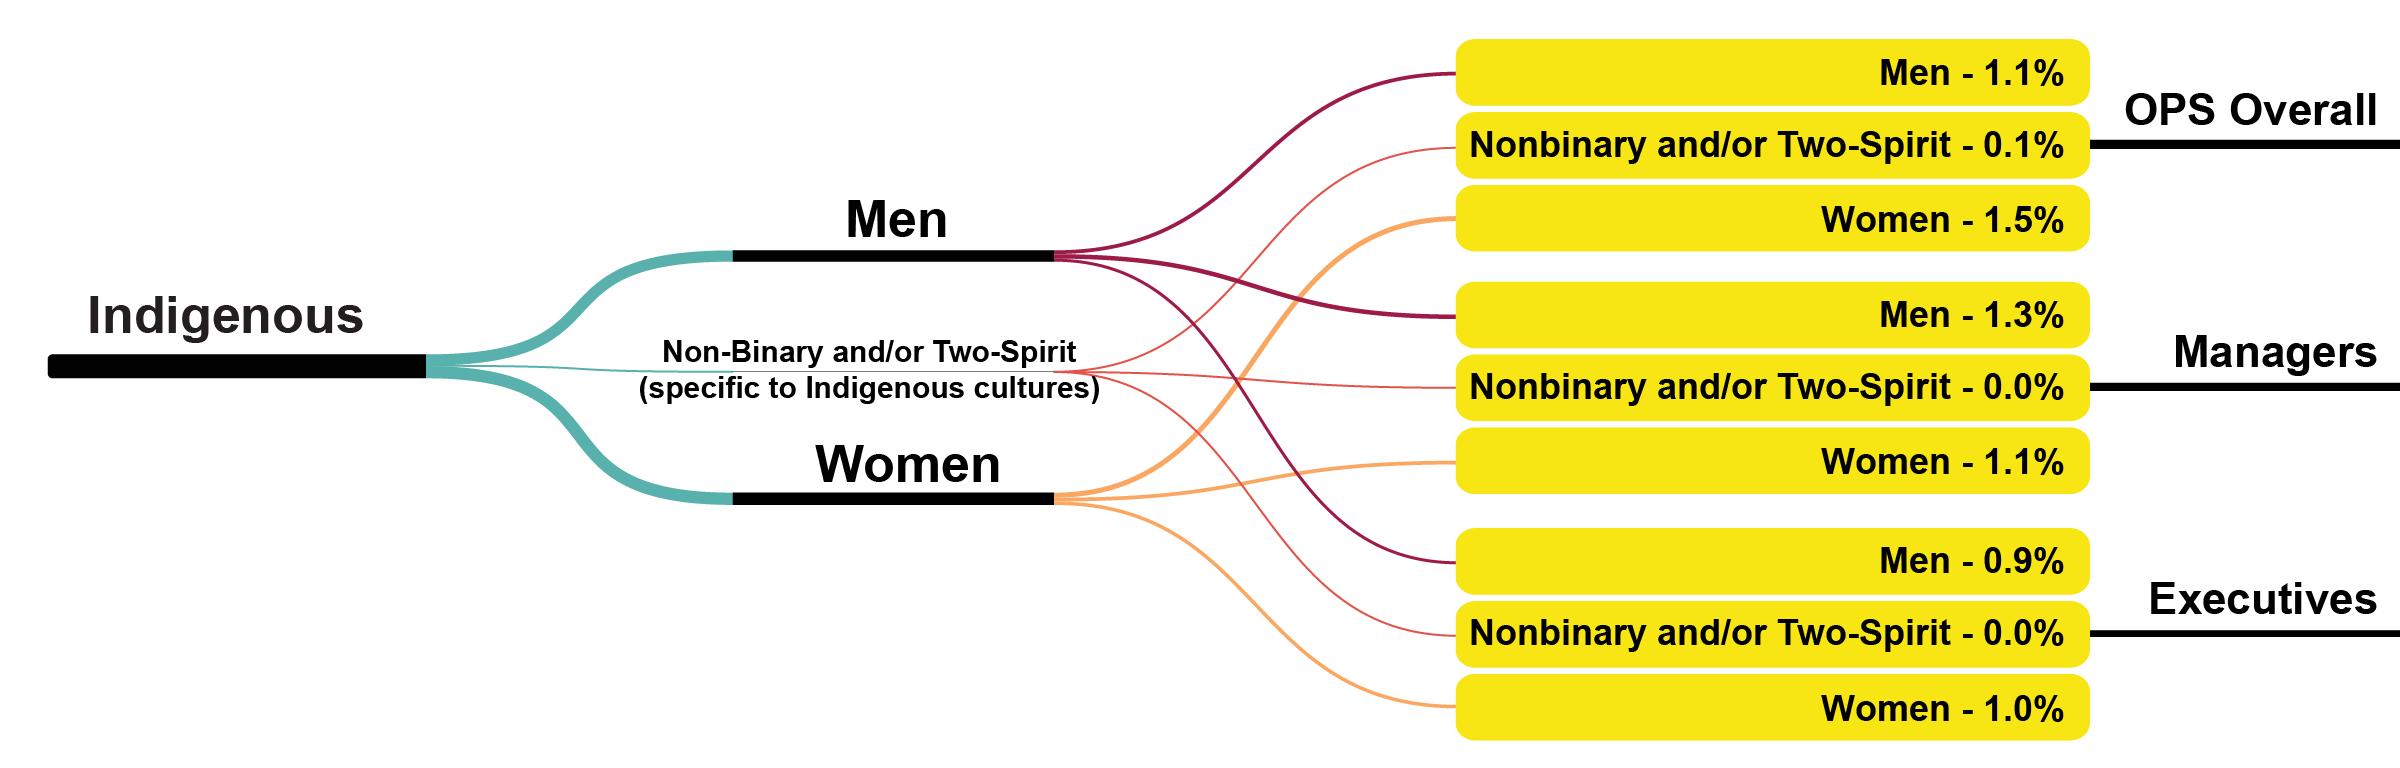
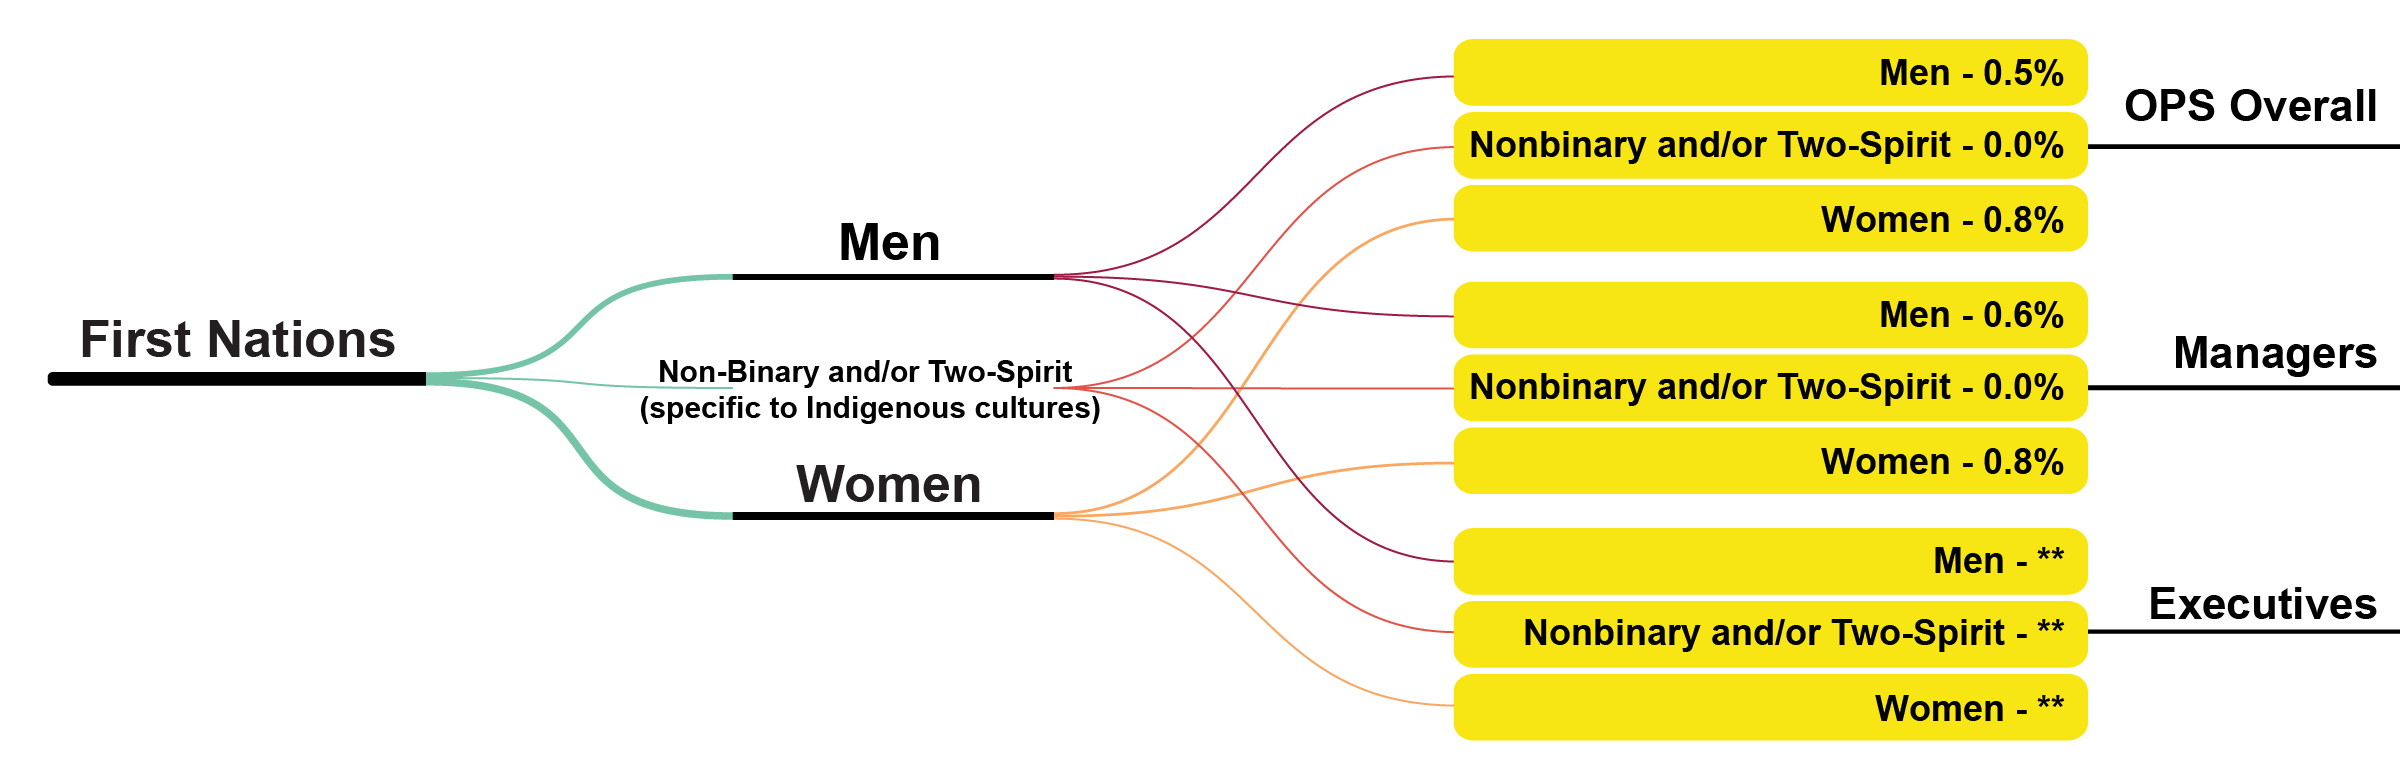
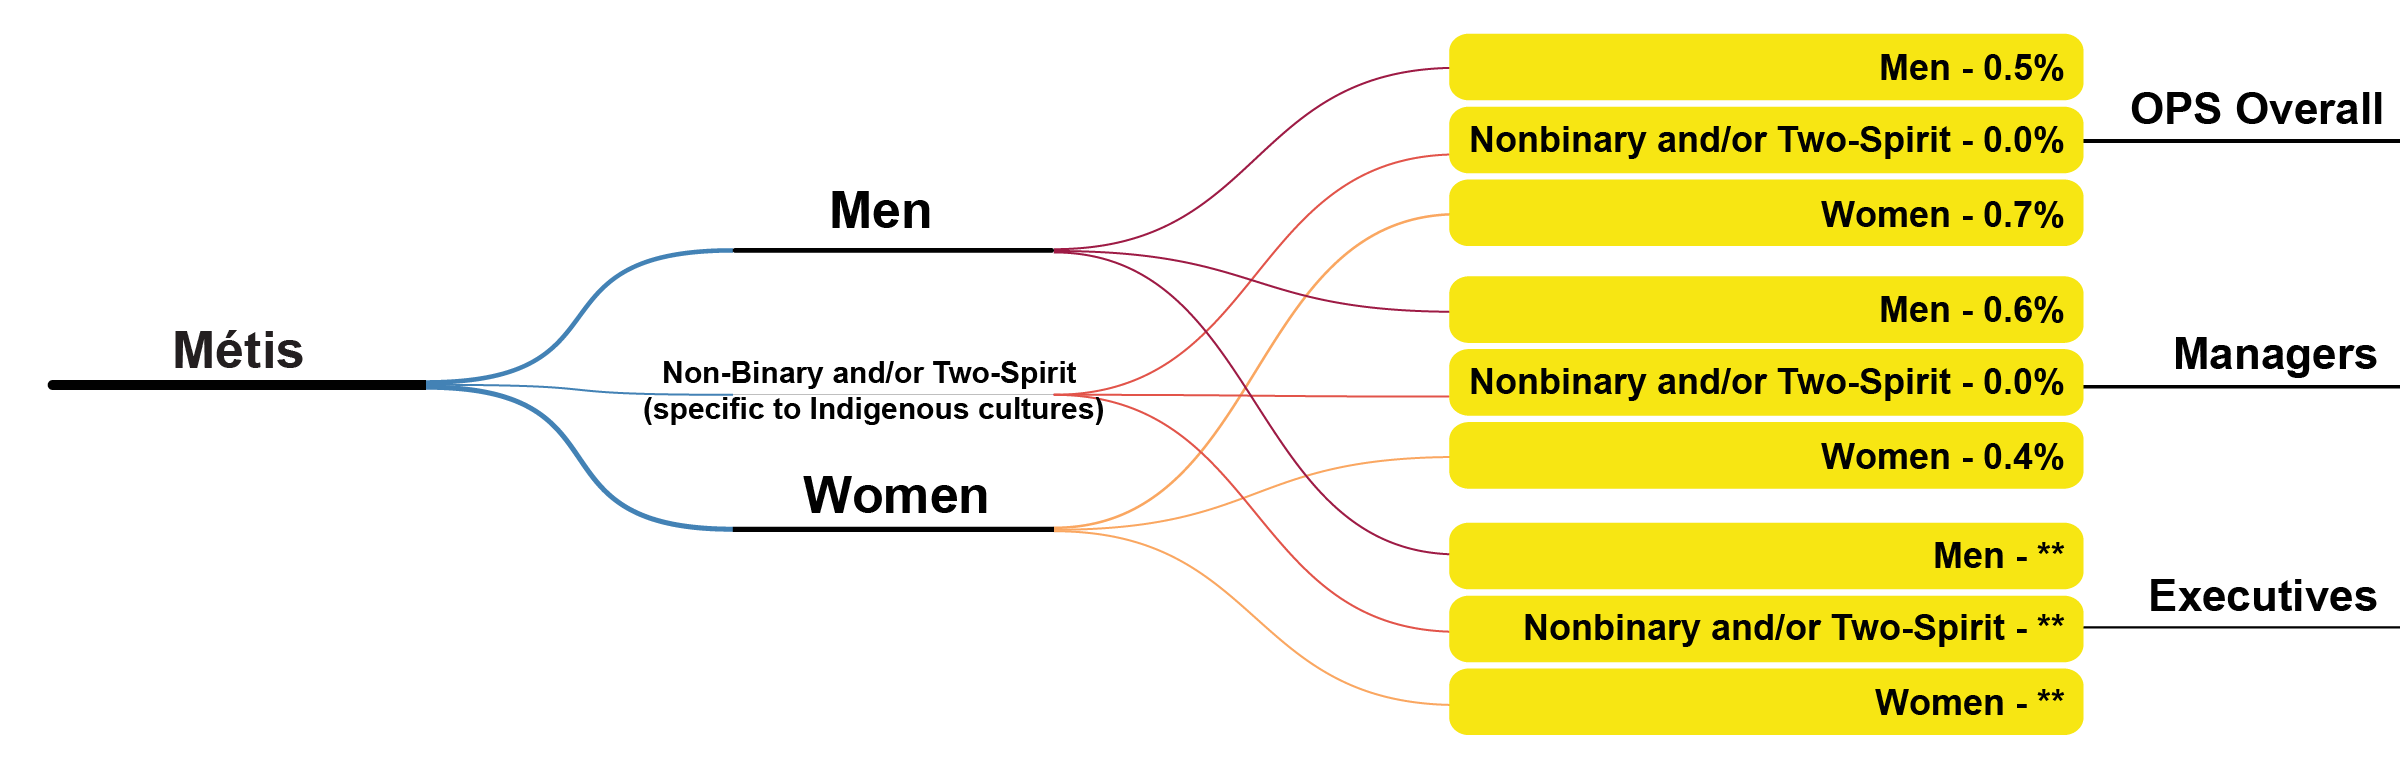
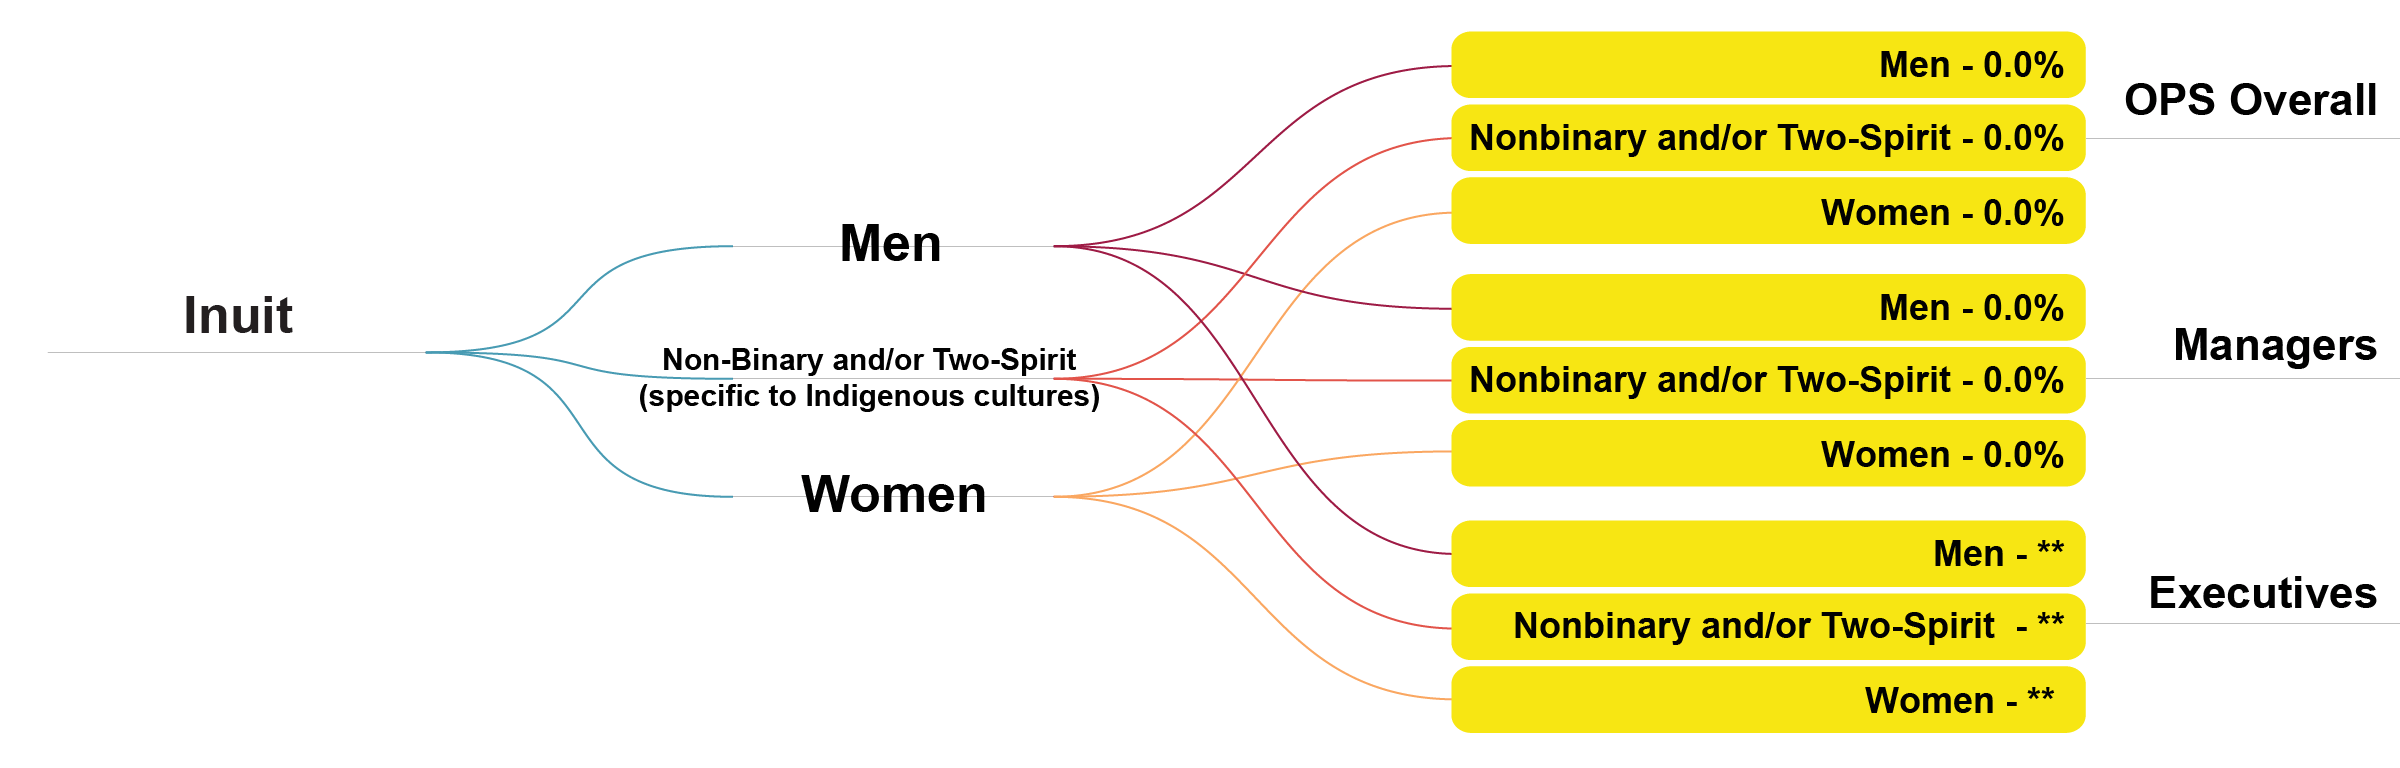
| Gender and Indigenous identity | OPS overall | Managers | Executives |
|---|---|---|---|
| Indigenous men | 1.1% | 1.3% | 0.9% |
| First Nation men | 0.5% | 0.6% | ** |
| Inuit men | 0.0% | 0.0% | ** |
| Métis men | 0.5% | 0.6% | ** |
| Indigenous women | 1.5% | 1.1% | 1.0% |
| First Nation women | 0.8% | 0.8% | ** |
| Inuit women | 0.0% | 0.0% | ** |
| Métis women | 0.7% | 0.4% | ** |
| Indigenous Non-Binary and/or Two-Spirit | 0.1% | 0.0% | 0.0% |
| First Nation Non-Binary and/or Two-Spirit | 0.0% | 0.0% | ** |
| Inuit Non-Binary and/or Two-Spirit | 0.0% | 0.0% | ** |
| Métis Non-Binary and/or Two-Spirit | 0.0% | 0.0% | ** |
| Non-Indigenous men | 36.4% | 43.7% | 45.7% |
| Non-Indigenous women | 55.1% | 50.0% | 50.6% |
| Non-Indigenous Non-Binary and/or Two-Spirit | 0.3% | 0.2% | 0.1% |
Gender identity and race
Note: This figure is for visual reference only. See the tables below this figure for the full data.
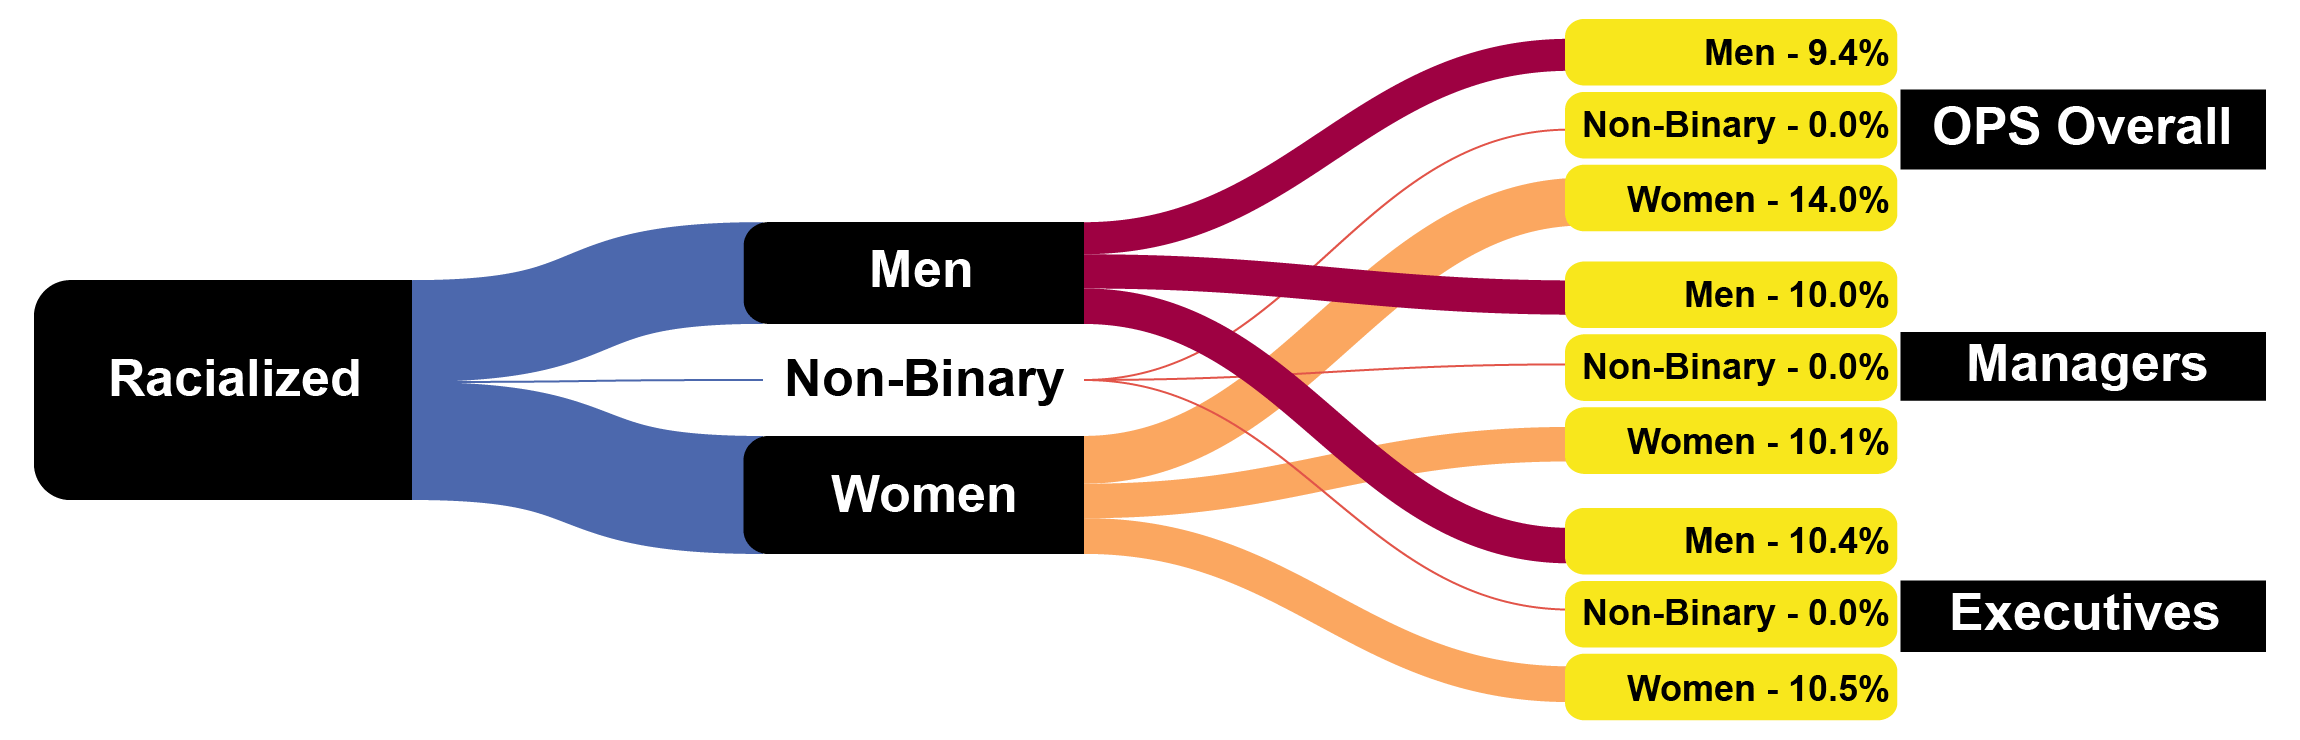
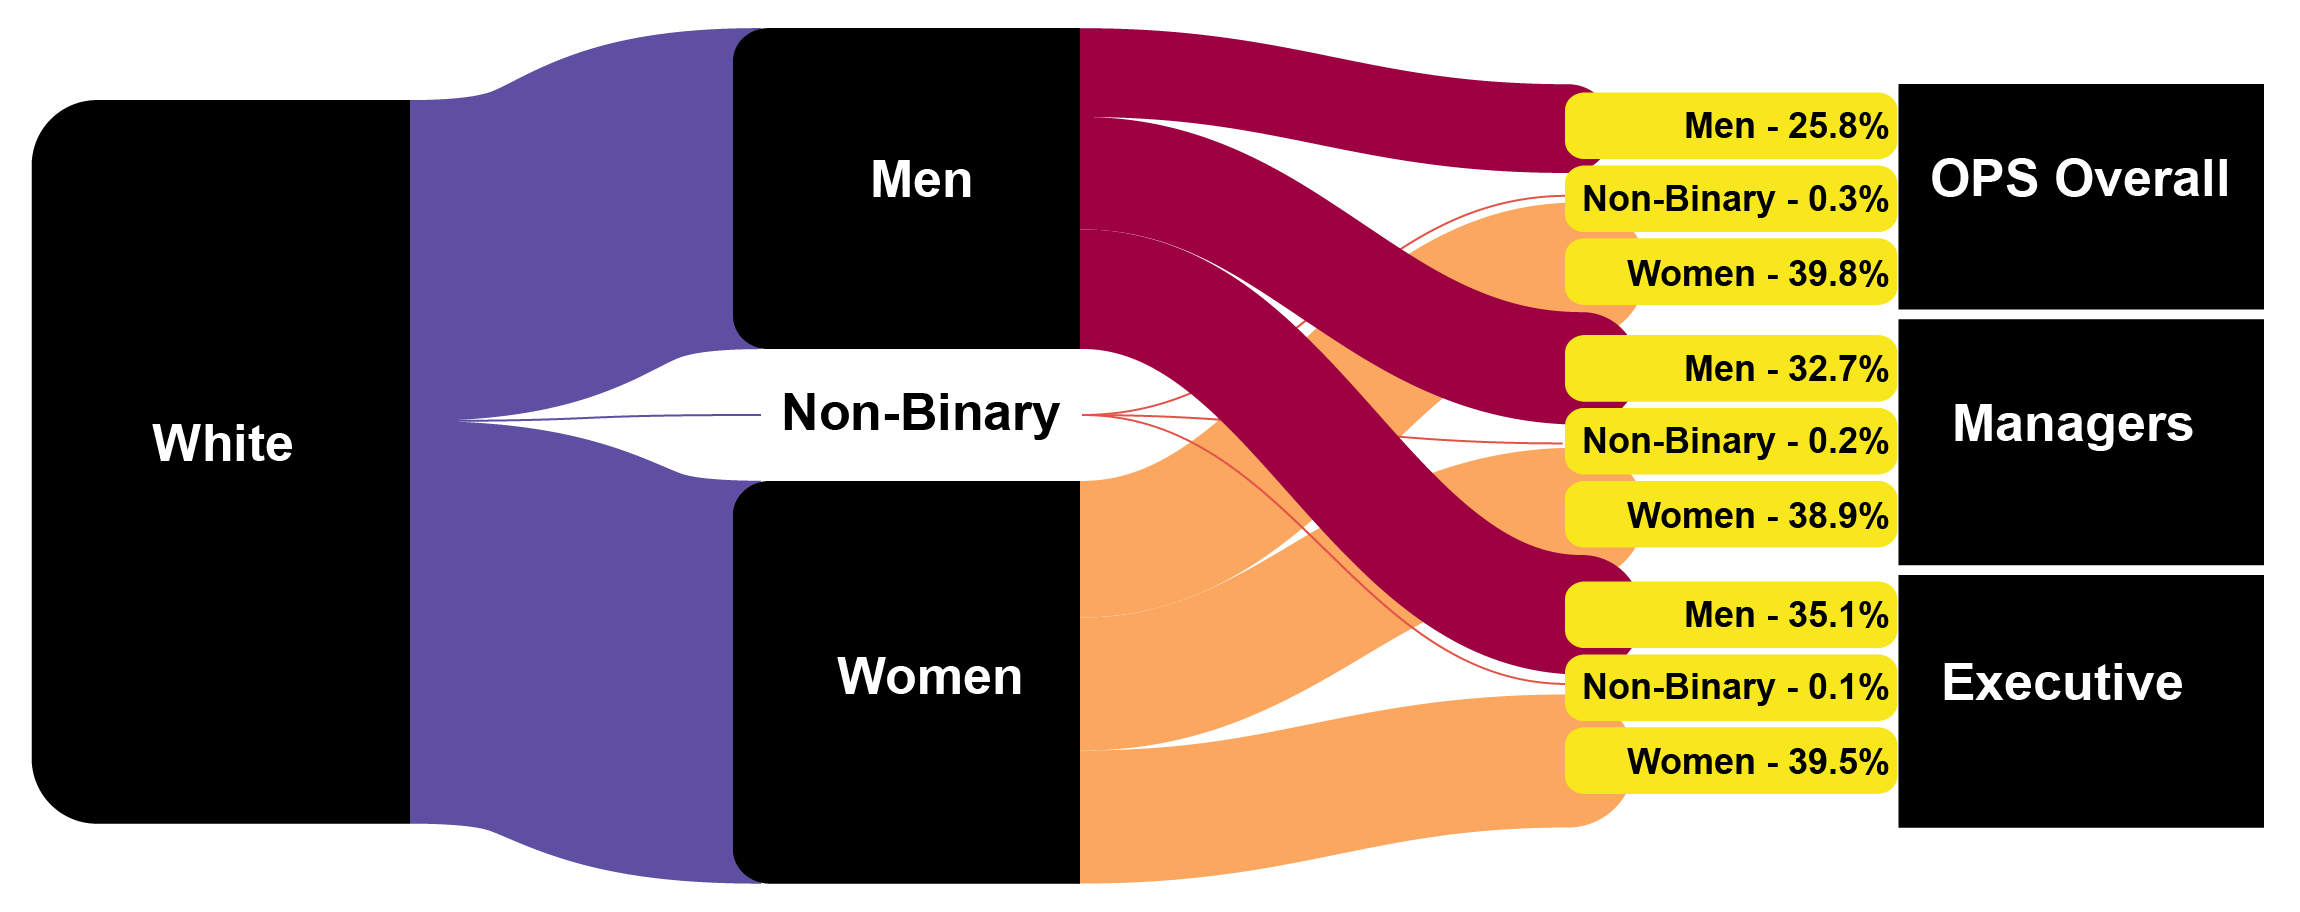
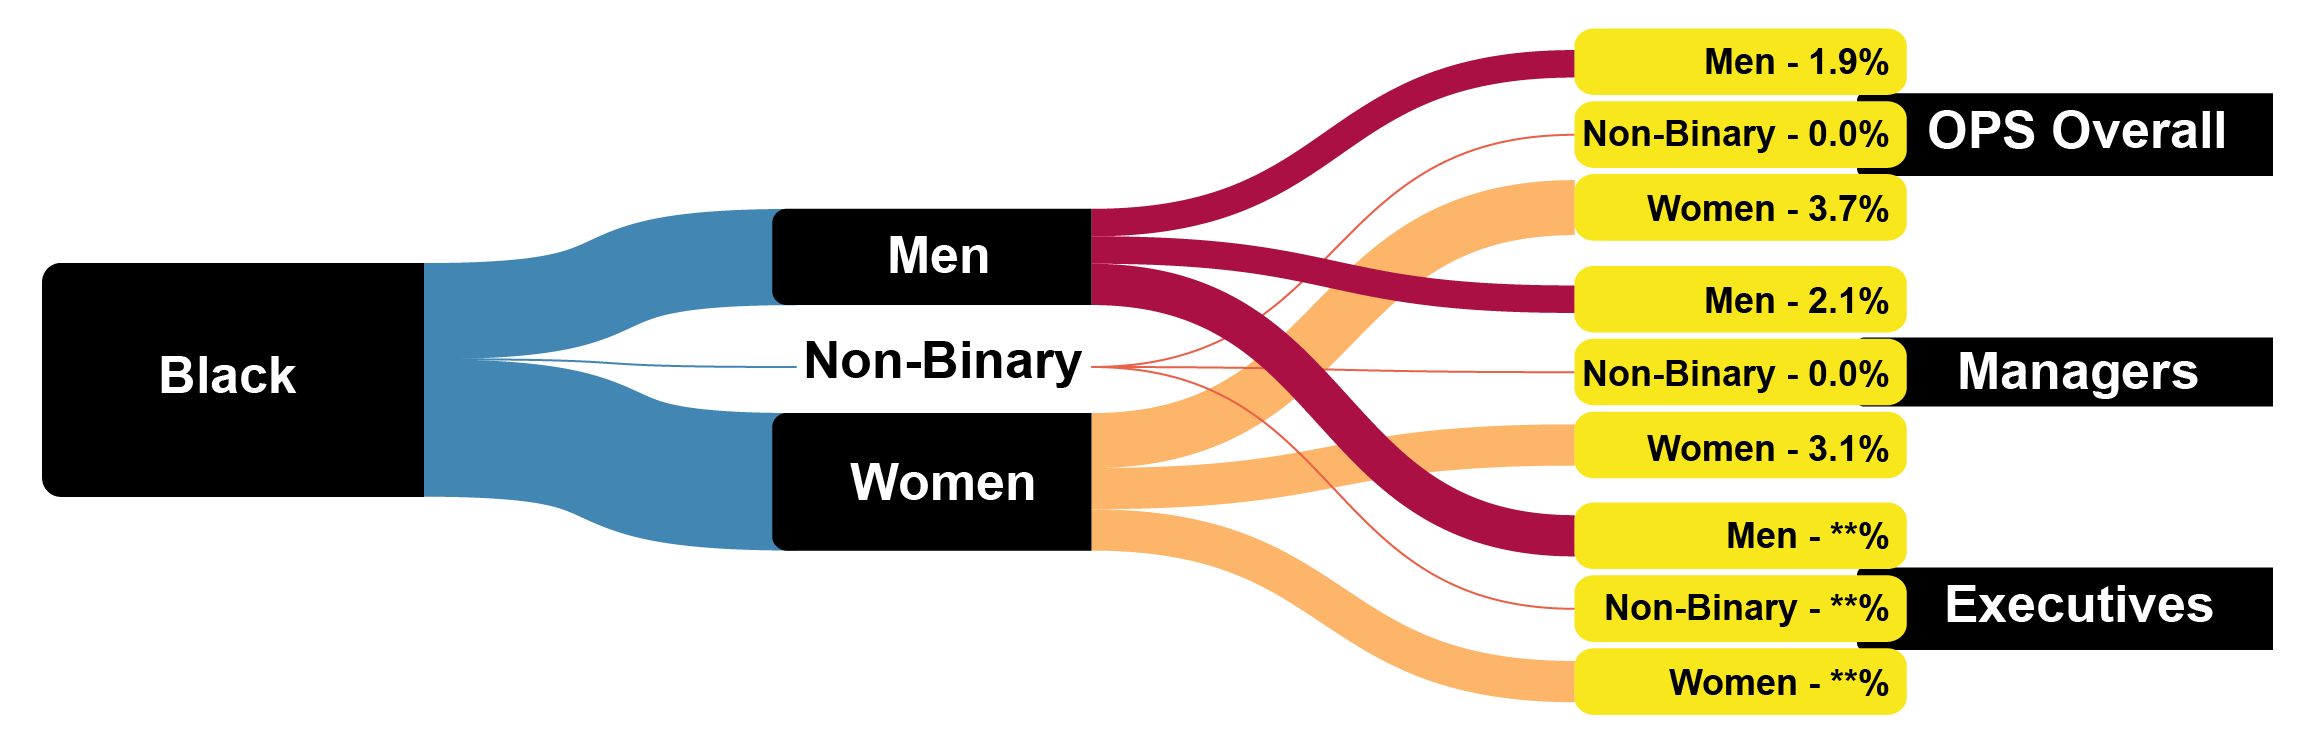
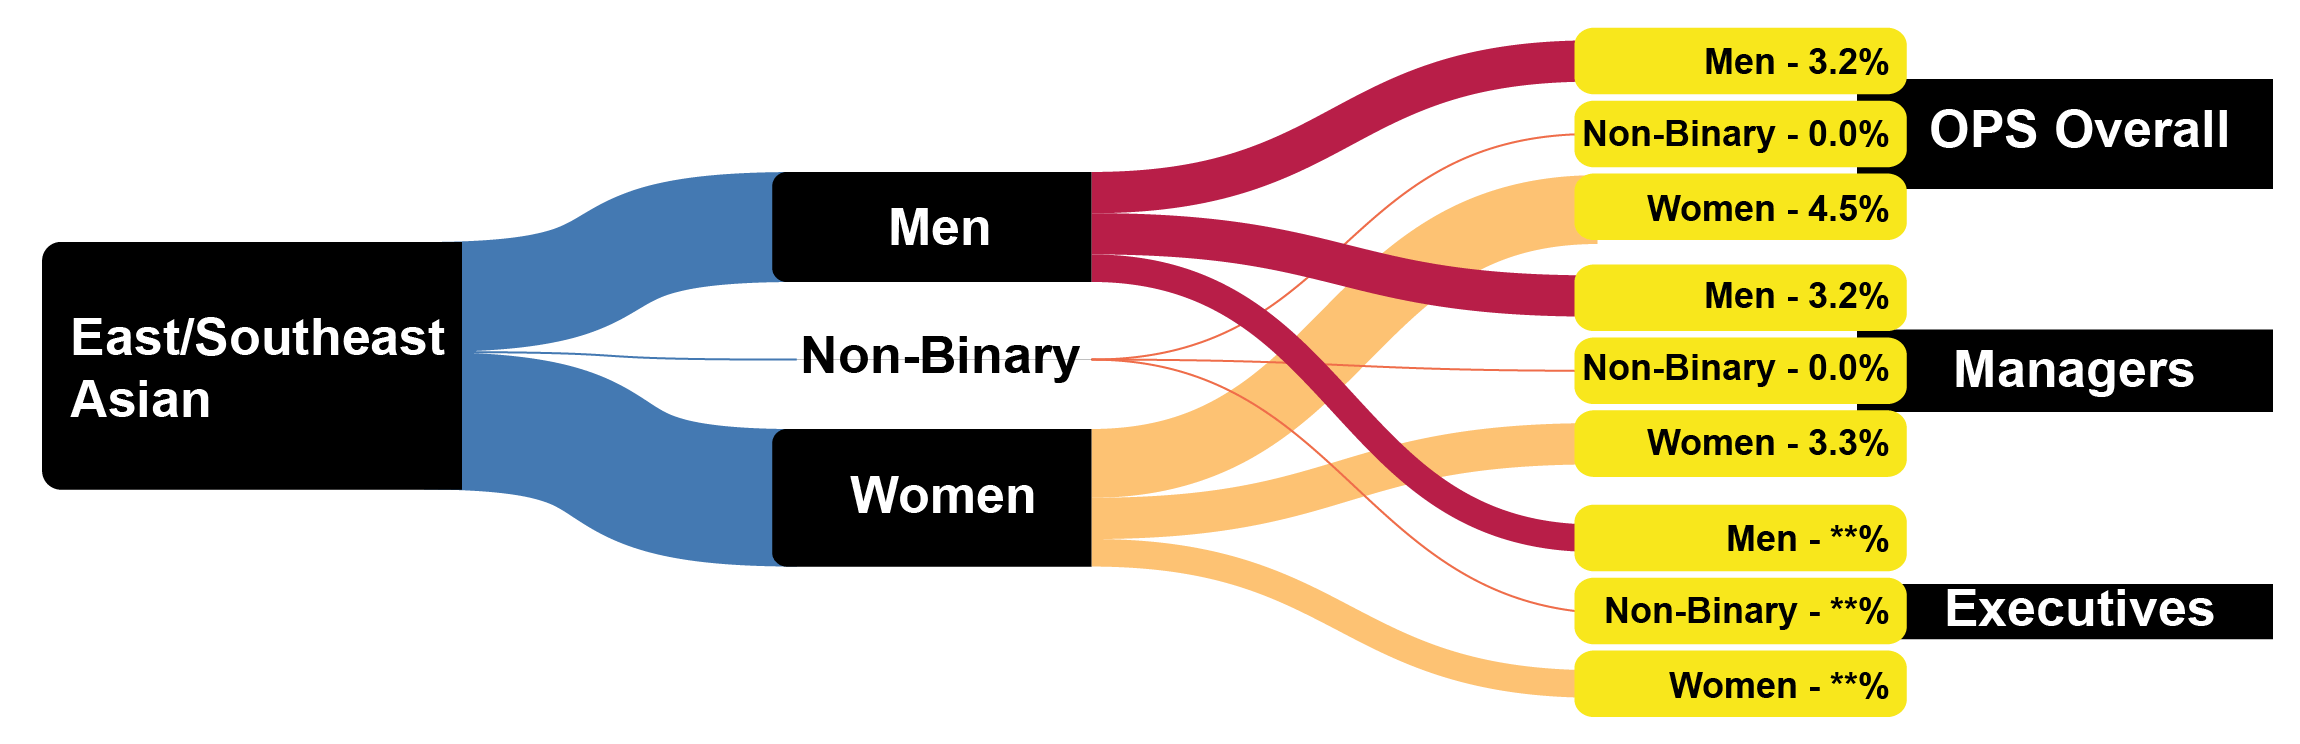
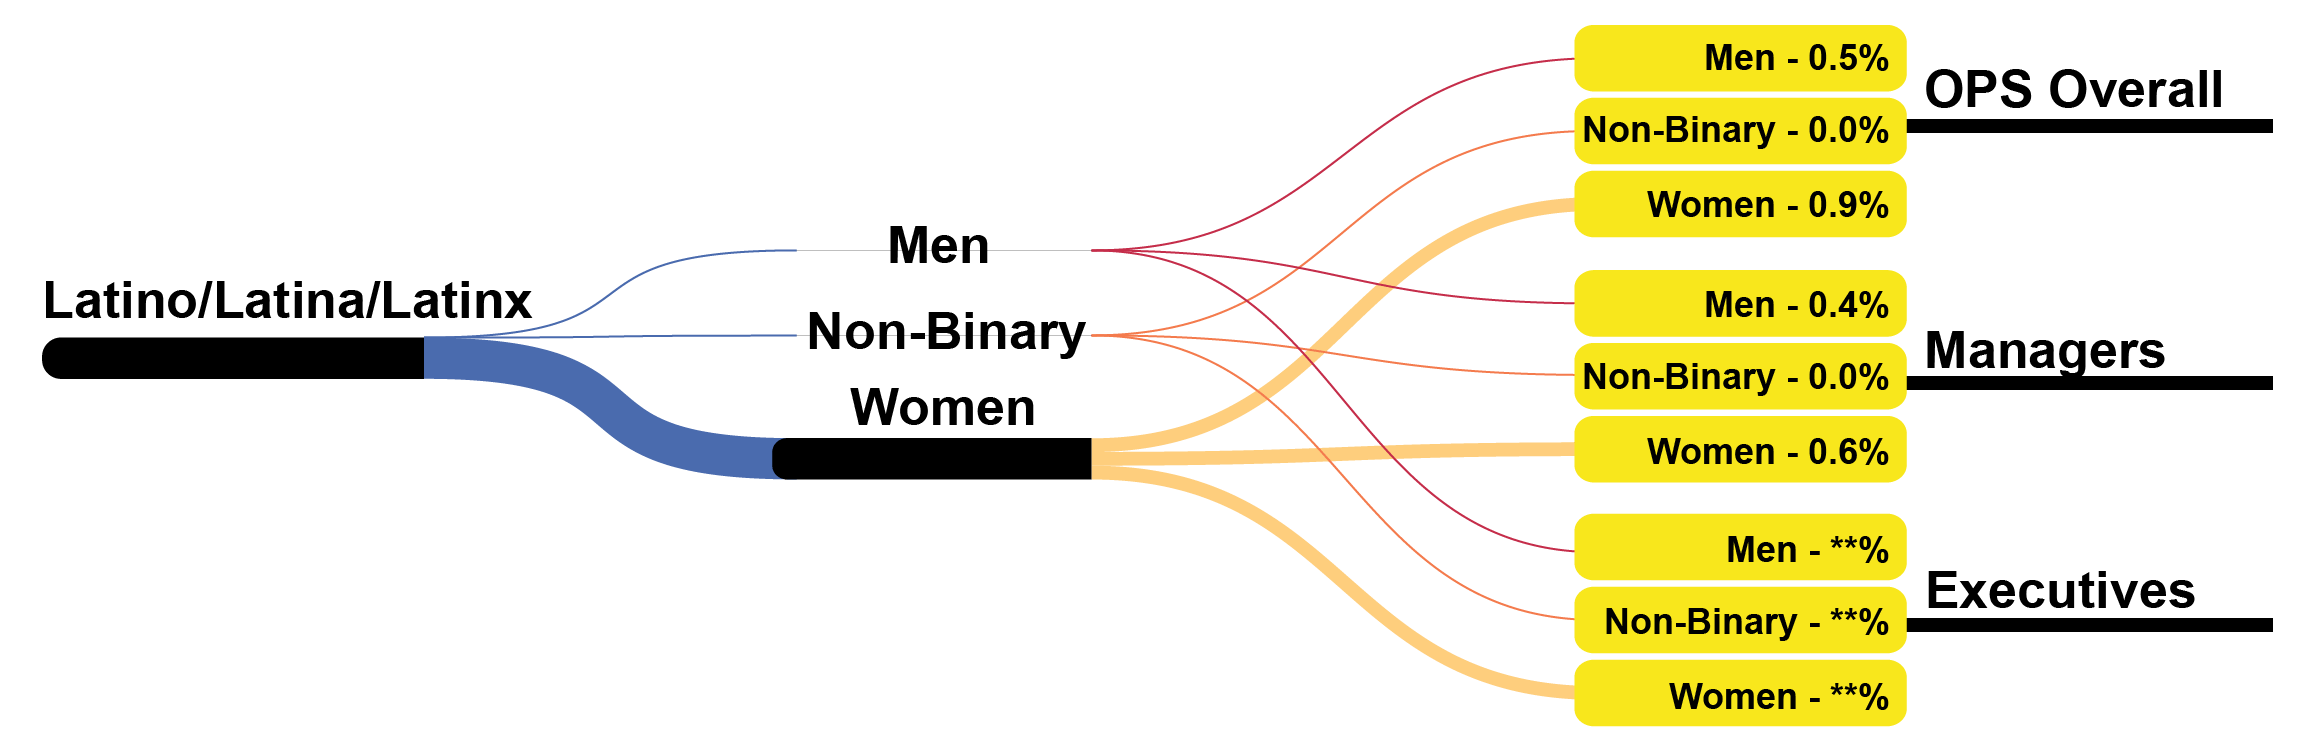
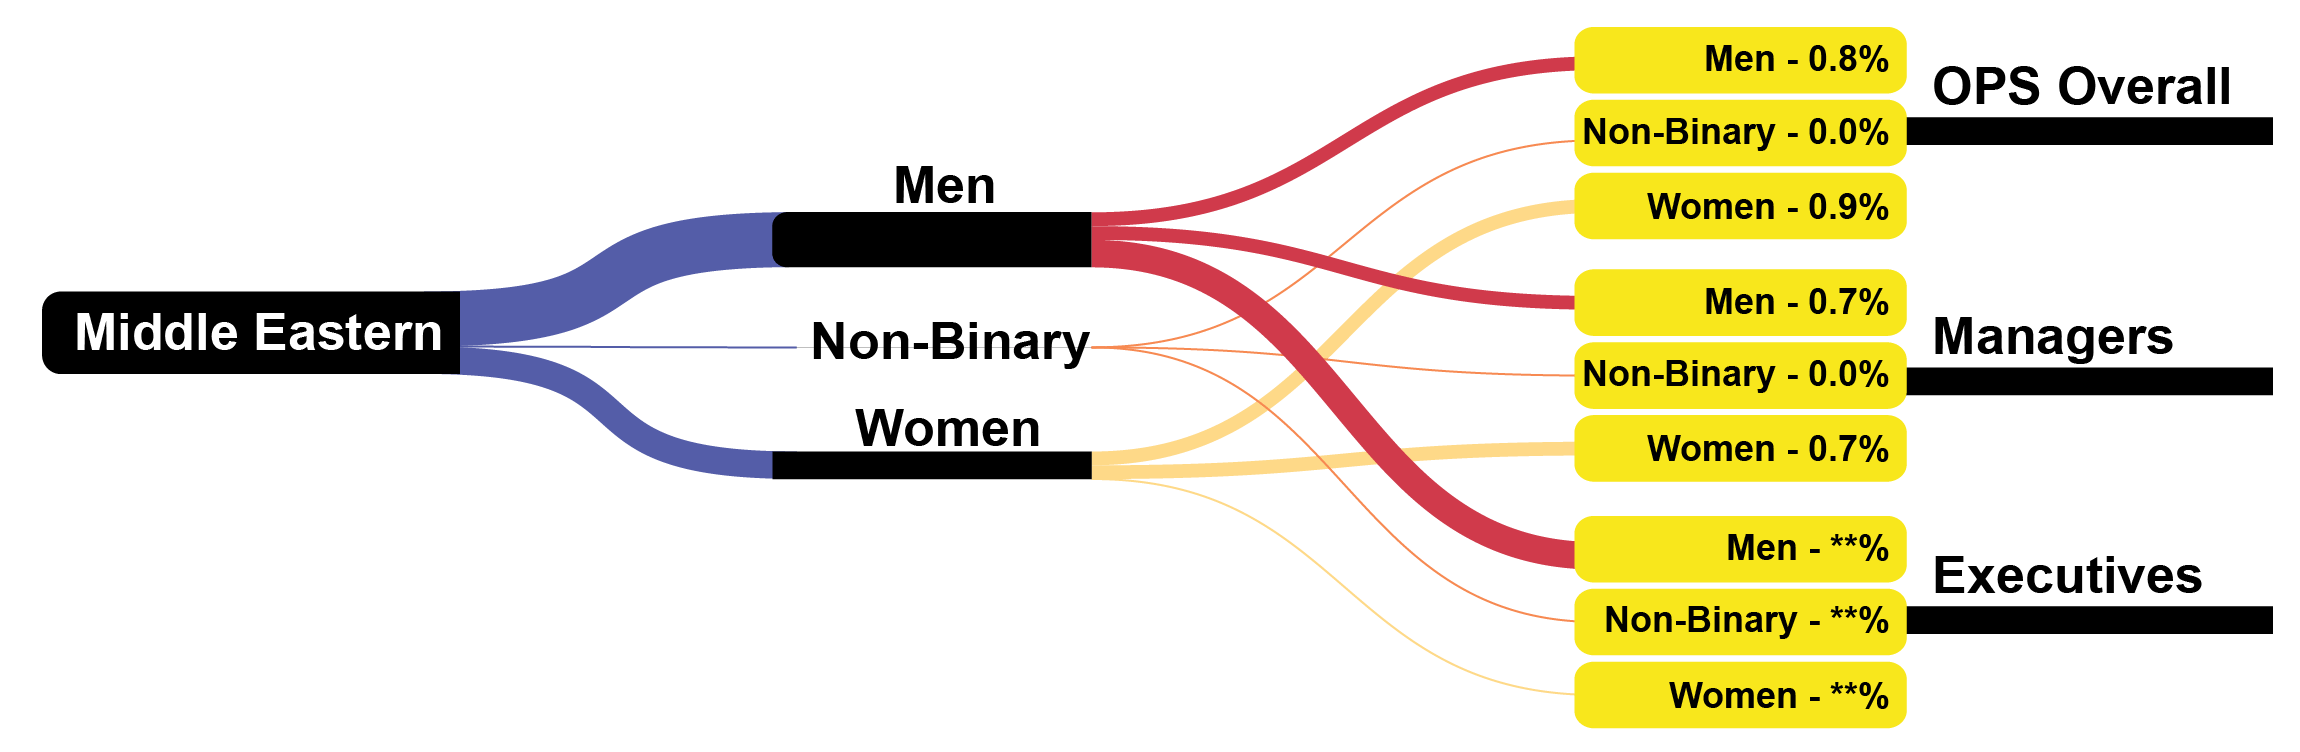
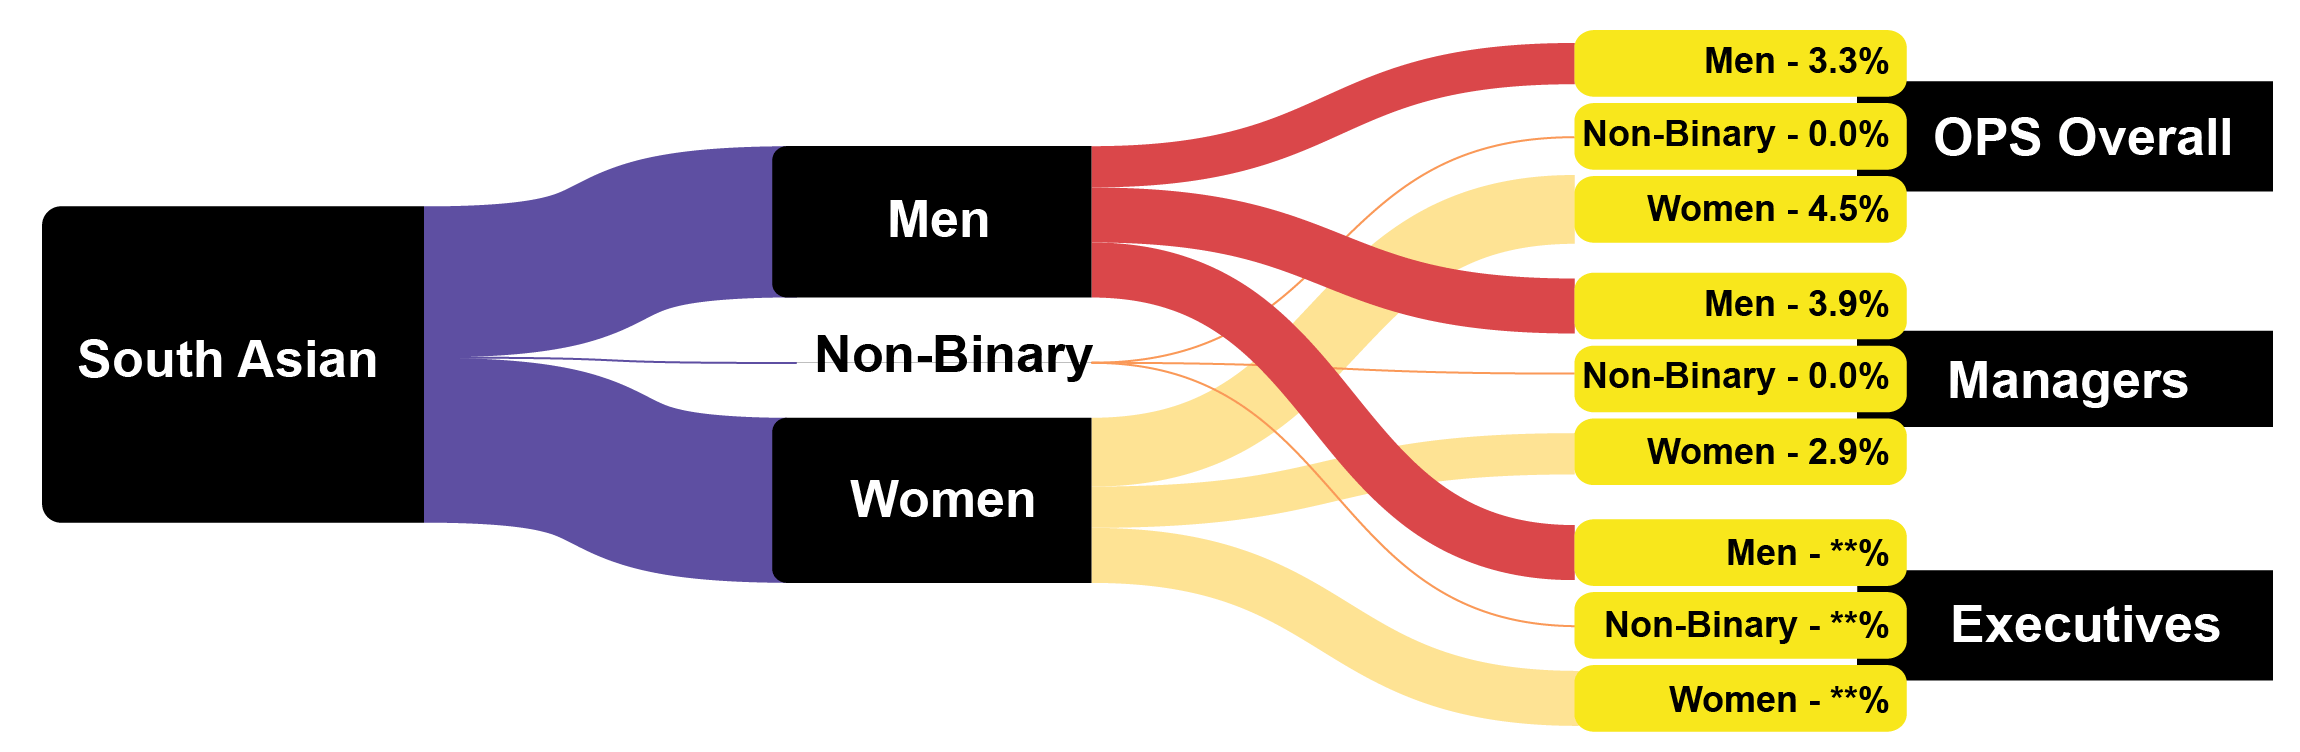
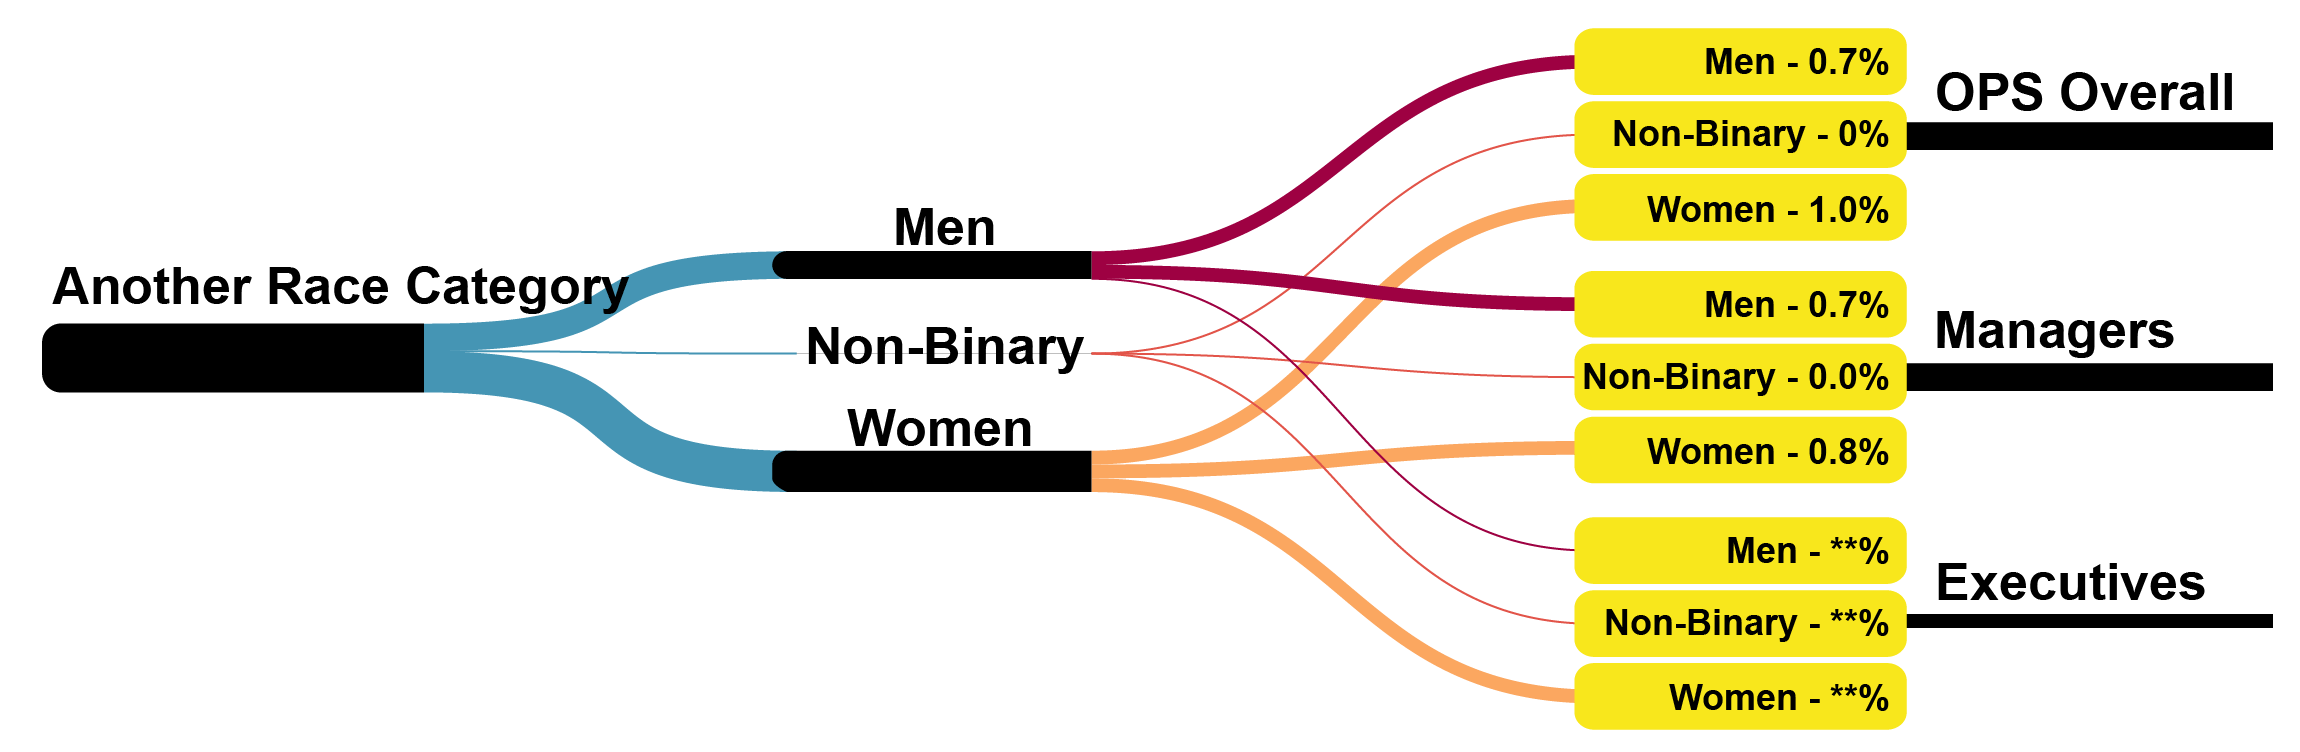
| Gender identity and race | OPS overall | Managers | Executives |
|---|---|---|---|
| Racialized men | 9.4% | 10.0% | 10.4% |
| Racialized women | 14.0% | 10.1% | 10.5% |
| Racialized Non-Binary and/or Two-Spirit | 0.0% | 0.0% | 0.0% |
| Black men | 1.9% | 2.1% | ** |
| Black women | 3.7% | 3.1% | ** |
| Black Non-Binary and/or Two-Spirit | 0.0% | 0.0% | ** |
| East/Southeast Asian men | 3.2% | 3.2% | ** |
| East/Southeast Asian women | 4.5% | 3.3% | ** |
| East/Southeast Asian Non-Binary and/or Two-Spirit | 0.0% | 0.0% | ** |
| Latino/Latina/Latinx men | 0.5% | 0.4% | ** |
| Latino/Latina/Latinx women | 0.9% | 0.6% | ** |
| Latino/Latina/Latinx Non-Binary and/or Two-Spirit | 0.0% | 0.0% | ** |
| Middle Eastern men | 0.8% | 0.7% | ** |
| Middle Eastern women | 0.9% | 0.7% | ** |
| Middle Eastern Non-Binary and/or Two-Spirit | 0.0% | 0.0% | ** |
| South Asian men | 3.3% | 3.9% | ** |
| South Asian women | 4.5% | 2.9% | ** |
| South Asian Non-Binary and/or Two-Spirit | 0.0% | 0.0% | ** |
| Another Race Category Men | 0.7% | 0.7% | ** |
| Another Race Category Women | 1.0% | 0.8% | ** |
| Another Race Category Non-Binary and/or Two-Spirit | 0.0% | 0.0% | ** |
| White men | 25.8% | 32.7% | 35.1% |
| White women | 39.8% | 38.9% | 39.5% |
| White Non-Binary and/or Two-Spirit | 0.3% | 0.2% | 0.1% |
Notes
Results for each intersection are from the 2021 Employee Experience Survey. Results are for the percentage each combined group constitutes of the total number of employees at each level (for example, as a proportion of the whole OPS, all managers and all executives).
Additional intersections were explored, including:
- disability and Indigenous identity
- disability and race
- Francophone identity and race
- sexual orientation and race
This did not result in minimum response counts for privacy protection and reporting purposes.
Results are available for respondents who answered both questions for each intersection. Respondents who only answered one question were omitted.
See appendix B for further information on the calculation of the ‘racialized’ variable.
Footnotes
- footnote[1] Back to paragraph Fields are marked with a double asterisk (**) where there are fewer than 10 respondents when combining results for two questions, or where results were omitted due to data reliability issues.