References and Appendices
References (8.0)
Adams, B. J., and Bontje, J. B., Microcomputer Applications of Analytical Models for Urban Drainage Design. Proceedings of the Conference on Emerging Computer Techniques for Stormwater and Flood Management, ASCE, pp. 138-162, 1983.
Adams, L. W., Franklin, T. M., Dove, L. E., and Duffield, J. M., Design Considerations for Wildlife in Urban Stormwater Management, Trans. North American Wildlife And Natural Resource Conference, 51: 249-259, 1986.
Adams, B. J., Fraser, H. G., Howard, C. D. D., and Hanafy, M. S., Meteorological Data Analysis for Drainage System Design, Journal of Environmental Engineering, ASCE, 112(5): 827-848, 1986.
American Society of Civil Engineers, Urban Runoff Quality – Impact and Quality Enhancement Technology, 1986.
Andrews, E. D., Hydraulic Adjustment of the East York River, Wyoming to the Supply of Sediment, In, Adjustment of the Fluvial System, D. D. Rhodes and G. P. Williams (eds.), George, Allen & Unwin, Boston, pp. 69-94, 1979.
A. M. Candaras Associates Inc., Post-Construction Evaluation of Stormwater Exfiltration and Filtration Systems, October 1997.
Aquafor Beech Ltd., Wet Weather Discharges to the Metropolitan Toronto Waterfront, prepared for the Metropolitan Toronto and Region Remedial Action Plan, 1993.
Aquafor Beech Ltd., Environmental Planning for the Credit River Headwaters Subwatershed No. 19, prepared for CVC, 1997.
Ashton, G. (Ed.), River and Lake Ice Engineering, Water Resources Publications, Littleton, Colorado, 1986.
Beak Consultants Limited and Aquafor Beech Limited, Best Management Practices – Environmental Resource Management Demonstration Project – Phase 1, 1993.
Bayley, S., Behr, R., and Kelly, C., Retention and Release of Sulphur from a Freshwater Wetland, In, Water, Air and Soil Pollution, Vol. 31: 101-114, 1986.
Beland, M., Kennedy-Burnett Pond Temperature Analysis – (unpublished results), 1991.
Benjamin, J. R., and Cornell, C. A., Probability, Statistics, and Decision for Civil Engineers, McGraw-Hill Book Company, 1970.
Booth, D. B., and Reinelt, L., Consequences of urbanization on Aquatic Systems – Measured Effects, Degradation Thresholds and Corrective Strategies. In Proc., Watershed '93 A National Conference on Watershed Management, Alexandria, V.A., 1993.
Bryant, G. J., Irwin, R. W, and Stone, J. A., Tile Drain Discharge Under Different Crops, Canadian Agricultural Engineering, Vol. 29, No. 2, pp.117-122, 1987.
Centre for Watershed Protection, Stormwater BMP Design Supplement for Cold Climates, 1997.
Chen, C. N., Design of Sediment Retention Basins. Proceedings of the National Symposium on Urban Hydrology and Sediment Control, University of Kentucky, Lexington, Kentucky, 1975.
City of Toronto, Non-structural Alternatives for Stormwater Management, (draft), 1992. Credit Valley Conservation (CVC), Stormwater Management Guidelines, 1996. Davar, K. S., Beltaos, S., and Pratte, B., A Primer on Hydraulics of Ice Covered Rivers, The Canadian Committee on River Ice Processes and the Environment, Canadian Geophysical Union, Hydrology Section, 1996.
Davis, M. L., and Cornwell, D. A., Introduction to Environmental Engineering, 1991.
Delaware Department of Natural Resources and Environmental Control, Delaware Sediment and Stormwater Regulations, January 23, 1991.
Dillaha III, T. A., Sherrard, J. H., and Lee, D., Long-Term Effectiveness of Vegetative Filter Strips, Nonpoint Source Pollution, November 1989.
Di Toro, D. M., and Small, M. J., Stormwater Interception and Storage. Journal of Environmental Engineering, ASCE, Vol. 105, No. EE1: 43-54, 1979.
Driscoll, E. D., Analysis of Detention Basins in EPA NURP Program. Proceedings of the Conference on Stormwater Detention Facilities Planning, Design, Operation, and Maintenance, New England College, Henniker, New Hampshire: 21-31, 1982.
Driscoll, E. D., Methodology for Analysis of Detention Basins for Control of Urban Runoff Quality. Report to Office of Water, Nonpoint Source Division, U. S. EPA, Washington, D.C., 1986.
Driscoll, E. D., Long-Term Performance of Water Quality Ponds, Design of Urban Runoff Quality Controls. Proceedings of an Engineering Foundation Conference on Current Practice and Design Criteria for Urban Quality Control, Trout Lodge, Potosi, Missouri, pp. 145-162, 1988.
Ellis, J. B., The Development of Environmental Criteria for Urban Detention Pond Design in the U.K., In, Design of Urban Runoff Quality Controls. L. A. Roesner, B. Urbonas, and M. B. Sonnen (eds.), ASCE, New York, pp. 14-28, 1989.
Ferguson, B. K., Urban Stormwater Infiltration Purposes, Implementation, Results, Journal of Soil and Water Conservation, November-December 1990.
Field, R., Masters, H., and Singer, M. An Overview of Porous Pavement Research, Water Resources Bulletin, American Water Resources Association, Vol 18, No. 2, April 1982.
Galli, J., Thermal Impacts Associated with Urbanization and Stormwater Management Best Management Practices, Final Report, Metropolitan Washington Council of Governments, December 1990.
Galli, J., and Dubose, R., Water Temperature and Freshwater Stream Biota: An Overview, Appendix C of Thermal Impacts Associated with Urbanization and Stormwater Management Best Management Practices, Metropolitan Washington Council of Governments, December 1990.
Gamsby and Mannerow Ltd., Cumming Cockburn Ltd., and Code, Mackinnon Ltd., A Watershed Management Study for the Upper Hanlon Creek and its Tributaries, 1993.
Gietz, R., Rideau River Stormwater Management Study – Urban Runoff Treatment in Kennedy- Burnett Settling Pond, Regional Municipality of Ottawa-Carleton, 1983.
Greenland International Consulting Inc., Stormwater Management Facility Sediment Maintenance Guide, Prepared for Toronto & Region Conservation Authority, August 1999.
Guo, Y., Long Term Performance of Stormwater Quality Control Ponds. M.A.Sc. Thesis, University of Toronto, Toronto, Ontario, 1992.
Harrington, B. W., Design Procedures for Stormwater Management Extended Detention Structures, Maryland Department of the Environment, 1987.
Henry, D., Tran, J., Li, J. and Liang, W., Development and Evaluation of the City of Etobicoke Exfiltration System, Proceedings of the European Water Resources Association Conference 1997, A. A. Balkema, Rotterdam, Netherlands, pp. 407-413, 1997.
Howard, K., Urban Development – Implications for Groundwater Recharge, 1993.
Howard, C. D. D., Theory of Storage and Treatment Plant Overflow. Journal of Environmental Engineering, ASCE, Vol. 102, No. EE4, pp. 709-722, 1976.
Jones, J. E., and Jones, D. E. Essential Urban Detention Ponding Considerations, Journal of Water Resources Planning and Management, Vol. 110, No. 4., pp. 418-433, 1984.
Krishnappan, B.G., Modelling of Settling and Flocculation of Fine Sediments in Still Water, National Water Research Institute, Burlington, Ontario, 1988.
Laursen, E.M., Observations on the Nature of Scour, In Proceedings of the Fifth Hydraulics Conference, University of Iowa, Iowa City, Iowa, Studies in Engineering Bulletin 34, pp. 179-197, 1952.
Leopold, L. B., Wolman, M. G., and Miller, J. P., Fluvial Processes in Geomorphology, W. H. Freeman and Co., San Francisco, 522 pp., 1964.
Leopold, L. B., Hydrology for Urban Planning – A Guidebook on the Hydrology Effects of Urban Land Use, U.S. Geological Survey Circ., 554, 18 pp., 1968.
Livingston, E. H., State Perspectives on Water Quality Criteria, In Design of Urban Runoff Quality Controls, Engineering Foundation Conference, Potosi, MO, 1988.
Livingston, E. H., Use of Wetlands for Urban Stormwater Management (pp. 253-262) in D.A. Hammer [ed.] Constructed Wetlands for Wastewater Treatment. Lewis Publishers. 831 pp., 1990.
Li, J. Y., Comprehensive Urban Runoff Control Planning, Ph. D. Thesis, University of Toronto, Toronto, Ontario, 1991.
Li, J. Y., and Adams, B. J., Comprehensive Urban Runoff Quantity/Quality Management Modelling. Chapter 7 in New Techniques for Modelling The Management of Stormwater Quality Impacts, W. James, Ed., Lewis Publishers, Boca Raton, Florida, pp. 157-176, 1992.
Lindsey, G., Roberts, L., and Page, W., Inspection and Maintenance of Infiltration Facilities, 1992.
MacRae, C. R., Hegemier, T., Clayton, G., and Hartigan, P., Channel Enlargement in Urban Streams, Paper submitted to the International Erosion Control Association, 1999.
MacRae, C. R., Experience From Morphological Research on Canadian Streams: Is Control of the Two-Year Frequency Runoff Event the Best Basis for Stream Protection. In, Effects of Watershed Development and Management on Aquatic Systems. Proc., Engineering Foundation, ASCE, Snowbird, Utah, 1996.
MacRae, C. R., and Rowney, A. C., The Role of Moderate Flow Events and Bank Structure in the Determination of Channel Response to Urbanization, In, Resolving Conflicts and Uncertainty in Water Management, Proc., 45th Annual Conference, Canadian Water Resources Association, Kingston, Ontario, 1992.
Maestri, B., and Lord, B. W., Guide for Mitigation of Highway Stormwater Runoff Pollution, The Science of the Total Environment, 59: 467-476, 1987.
Marsalek, P. M., Special Characteristics of an On-Stream Stormwater Pond: Winter Regime and Accumulation of Sediment and Selected Contaminants, M.Sc. (Engineering) Thesis, Queen’s University, Kingston, Ontario, July 1997.
Marshall Macklin Monaghan Limited, Review of Recent Practices – Stormwater Management Planning and Design, 1997.
Marshall Macklin Monaghan and LGL Ltd., Hanlon Creek Watershed Plan. Final Report, 1993.
Martin, E., Mixing and Residence Time of Stormwater Runoff in a Detention System, In, Design of Urban Runoff Quality Controls, L. Roesner, B. Urbonas, and M. Sonnen (eds.), Engineering Foundation and American Society of Civil Engineers, New York, NY, 1988.
Maryland Department of the Environment, The Quality of Trapped Sediments and Pool Water within Oil/Grit Separators in Suburban Maryland, Interim Report, April 1993.
Maryland Department of the Environment, Maryland Stormwater Manual, Volume 1, 1998.
Maryland-National Capital Park and Planning Commission, Guidelines for Stormwater Management Facilities to be Located on M-NCPPC Property Located in Prince George’s County, 1988.
McCuen, R. H., Downstream Effects of Stormwater Management Basins, Journal of Hydraulics Division, ASCE, 1, 1, pp. 21-42, 1979.
McCuen, R. H., and Moglen, G., Multicriterion Stormwater Management Methods, Journal of Water Resources Planning and Management, 114:4, pp. 414-431, 1988.
Medina, M. A. Jr., Huber, W. C., and Heaney, J. P., Modelling Stormwater Storage/Treatment Transients – Theory. Journal of the Environmental Engineering Division, ASCE, Vol. 107, No. EE4, pp. 781-797, 1981.
Medina, M. A. Jr., Huber, W. C., and Heaney, J. P., Modelling Stormwater Storage/Treatment Transients – Applications. Journal of the Environmental Engineering Division, ASCE, Vol. 107, No. EE4, pp. 799-816, 1981.
Meek, S., and Liang, W. Y., Stormwater Management Assessment and Monitoring Performance (SWAMP) Program, Water News, Newsletter of the Canadian Water Resources Association, Vol. 17, No. 4, December 1998.
Metropolitan Toronto and Region Conservation Authority, Valley and Stream Corridor Management Program, 1992.
Metropolitan Washington Council of Governments, Analysis of Urban BMP Performance and Longevity, 1992.
Metropolitan Washington Council of Governments, Controlling Urban Runoff, 1987.
Minnesota Pollution Control Agency, Protecting Water Quality in Urban Areas – Best Management Practices for Minnesota, 1989.
Minnesota Pollution Control Agency, Protecting Water Quality in Urban Areas, 1989.
Morisawa, M., and LaFlure, E., Hydraulic Geometry, Stream Equilibrium and Urbanization, In Adjustments of the Fluvial System, D. D. Rhodes and G. P. Williams (eds.), Proc., 10th Annual Geomorphology Symposium Series, Binghampton, NY (September 21-22), pp. 333-350, 1979.
Novotny, V., Efficiency of Low Cost Practices for Controlling Pollution by Urban Runoff, Marquette University, Milwaukee, Wisconsin, 1986.
Ontario Ministry of Environment and Energy, Manual of Policy, Procedures and Guidelines for On-site Sewage Systems, 1982.
Ontario Ministry of Environment and Energy, Stormwater Quality Best Management Practices, June 1991.
Ontario Ministry of Environment and Energy, Stormwater Management Practices and Design Manual, 1994.
Ontario Ministry of Environment and Energy, Guideline B-6: Guidelines for Evaluating Construction Activities Impacting on Water Resources, 1995.
Ontario Ministry of the Environment and Energy, Hydrological Technical Information Requirements for Land Development Applications, 1995.
Ontario Ministry of Environment and Energy, Metropolitan Toronto and Region Conservation Authority, Constructed Wetlands for Stormwater Management: A Review, 1992.
Ontario Ministry of Environment and Energy, Ministry of Natural Resources, Interim Stormwater Quality Control Guidelines for New Development, May 1991.
Ontario Ministry of Environment and Energy, Ministry of Natural Resources, Water Management on a Watershed Basis, June 1993.
Ontario Ministry of Environment and Energy, Ministry of Natural Resources, Subwatershed Planning, June 1993.
Ontario Ministry of Environment and Energy, Ministry of Natural Resources, Integrating Water Management Objectives into Municipal Planning Documents, June 1993.
Ontario Ministry of Municipal Affairs and Housing, Making Choices: Alternative Development Standards Guidelines, 1995.
Ontario Ministry of Natural Resources, Floodplain Management in Ontario Technical Guidelines, 1986.
Ontario Ministry of Natural Resources, Guidelines on the Use of "Vegetated Buffer Zones" to Protect Fish Habitat in an Urban Environment, 1987.
Ontario Ministry of Natural Resources, Ministry of Municipal Affairs, Floodplain Planning Policy Statement, 1988.
Ontario Ministry of Natural Resources, Fish Habitat Protection Guidelines for Developing Areas, 1994.
Ontario Ministry of Natural Resources, Natural Channel Systems: An Approach to Management and Design, 1994.
Ontario Ministry of Natural Resources, Adaptive Management of Stream Corridors in Ontario, Watershed Science Centre, Trent University, Peterborough, Ontario, 2002.
Ontario Ministry of Natural Resources, Environment, Municipal Affairs, and Transportation, Association of Conservation Authorities of Ontario, Municipal Engineers Association, Urban Development Institute, Urban Drainage Design Guidelines, 1987.
Ontario Ministry of Transportation, Highway Runoff Water Quality Literature Review, 1990.
Ontario Ministry of Transportation, Environmental Practices Survey, 1991.
Ontario Ministry of Transportation, MTO Drainage Management Manual, 1997.
Ontario Ministry of Transportation, MTO Stormwater Management Requirements for Land Development Proposals, 1999.
Osborne, L., and Kovacic, D., Riparian Vegetated Buffer Strips in Water-Quality Restoration and Stream Management, 1993.
Paul Wisner & Associates Inc., Performance Review of Grass Swale-Perforated Pipe Stormwater Drainage Systems, RAC Project No. 585C, Ontario Ministry of Environment and Energy, 1994.
Paul Wisner & Associates Inc., Interdisciplinary Stormwater Management and Urban Hydrology Update, 1990.
Paul Wisner & Associates Inc., Critical Notes on the Use of Storage Ponds for Runoff Quality Control, 1989.
P'ng, J. C., Conceptual Hydrologic Modelling for Master Plans in Urban Drainage, M.A. Sc. Thesis, Department of Civil Engineering, University of Ottawa, Ottawa, Ontario, 1982.
Prince George’s County, Stormwater Management Design Criteria, 1996.
Randall, C. W., "Stormwater Detention Ponds for Water Quality Control" In, Stormwater Detention Facilities (ed. W. DeGroot). Engineering Foundation, Urban Water Resources Research Council of the American Society of Civil Engineers, 1982.
Regional Municipality of Ottawa-Carleton, Rideau River Stormwater Management Study, Review of Literature, January 1991.
Rosgen, D., Applied River Morphology, Wildland Hydrology, Pagosa Springs, Colorado, 1996.
Salo, J. E., Harrison, D., and Archibald, E. M., Removing Contaminants by Groundwater Recharge Basins, Journal of AWWA, 1986.
Schueler, T. R., and Galli, F. J., Finding Retrofit Opportunities in Urban Watershed: Watershed Restoration Sourcebook, Anacostia Restoration Team. Metropolitan Council of Governments, 1992.
Schueler, T. R., Kumble, P. A., and Heraty, M., A Current Assessment of Urban Best Management Practices: Techniques for Reducing Non-point Source Pollution in the Coastal Zone. Metropolitan Washington Council of Governments. Prepared for EPA office of Wetlands, Oceans and Watershed, 1992.
Schueler, T., and Helfrich, M., Design of Extended Detention Wet Pond Systems, Department of Environmental Programs, Metropolitan Washington Council of Governments, Washington, DC, 1992.
Science and Technology Task Group, Watershed Planning Implementation Project Management Committee, Province of Ontario, Final Report of the Watershed Planning Initiative Science and Technology Task Group, 1995.
Silverman, G. S., and Stenstrom, M. K., Source Control of Oil and Grease in an Urban Area, In, Design of Urban Runoff Quality Controls, Roesner, L. A., Urbonas, B., and Sonnen, M. B. (eds.), American Society of Civil Engineers, New York, NY, pp. 403-420, 1989.
Small, M. J., and DiToro, D. M., Stormwater Treatment Systems, Journal of Environmental Eng. Div., ASCE, Vol. 105, No. EE3, pp. 557-569, 1979.
Society for Ecological Restoration – Ontario Chapter, Native Plant Resource Guide for Ontario, 2001.
Thornthwaite, C. W., and Mather, J. R., Instructions and Tables for Computing Potential Evapotranspiration and the Water Balance, Drexel Institute of Technology, Laboratory of Climatology, 1957.
The Toronto and Region Conservation Authority and the Town of Markham, Town of Markham Stormwater Retrofit Study, 1999.
U. S. Environmental Protection Agency, SWMM4, Stormwater Management Model, Version 4, User’s Manual, Washington, D.C., 1988.
U.S. Environmental Protection Agency, Methodology for Analysis of Detention Basins for Control of Urban Runoff Quality, 1986.
U.S. Environmental Protection Agency, Final Report of the Nationwide Urban Runoff Program, 1983.
Walesh, S., Urban Non-point Source Pollution: Monitoring, Modelling and Management, Presented at the Second Annual Meeting of the American Water Resources Association, Wisconsin Section, Milwaukee, Wisconsin, 1978.
Wanielista, M. P. and Yousef, Y. A., Best Management Practices Overview, In, Urban Runoff Quality Impact and Quality Enhancement Technology, Proceedings of an Engineering Foundation Conference, American Society of Civil Engineers, New York, NY, pp. 314-322, 1986.
Water Environment Federation and the American Society of Civil Engineers, Urban Runoff Quality Management – WEF Manual for Practice No. 23, 1998.
Watt, W. E., et al, Hydrology of Floods in Canada: A Guide to Planning and Design, National Research Council of Canada, 1989.
Wiegand, C., Schueler, T., Chittenden, W., and Jellick, D., Cost of Urban Runoff Quality Controls, In, Urban Runoff Quality: Impact and Quality Technology, B. Urbonas and L. Roesner (eds.), Engineering Foundation and American Society of Civil Engineers, ASCE, New York, 1986.
Wisner, P., and P'ng, J. C., OTTHYMO, A Model for Master Drainage Plans, IMPSWM Washington, DC Urban Drainage Modelling Procedures, 2nd Edition, Department of Civil Engineering, University of Ottawa, Ottawa, Ontario, 1983.
Wolman, M. G., and Miller, J. P., Magnitude and Frequency of Forces in Geomorphic Processes, Journal of Geology, 68, pp. 4-74, 1960.
Wulliman, J. T., Maxwell, M., Wenk, W. E., and Urbonas, B., Multiple Treatment System for Phosphorus Removal, In, Proceedings of an Engineering Foundation Conference on Current Practice and Design Criteria for Urban Quality Control, ASCE, New York, NY, pp. 239-256, 1989
Yousef, Y. A., Wanielista, M. P., and Harper, H. H., Design and Effectiveness of Urban Retention Basins, In, Urban Runoff Quality – Impact and Quality Enhancement Conference, Proceedings of Engineering Foundation Conference, ASCE, New York, NY, pp. 338-350, 1986.
Appendix A: subdivision/site planning
A.1 Overview of process
The term subdivision/site planning applies to subdivision planning, site planning and engineering, landscape design, architectural and building design, as well as local street design. Integrated subdivision/site planning is an effective means to ensure that parallel social, environmental, economic and functional objectives are achieved. The salient aspects of this process are described below.
- Establish Objectives - Based upon an understanding of the natural features, context and the vision for future use of the site, a multi-disciplinary team should establish specific ecological, social, functional and economic objectives. This approach ensures that all objectives are defined and initiates the process of identifying parallel objectives, which is essential to achieving integrated solutions.
- Set Targets - Related to each objective, identify specific performance criteria or design parameters. These 'targets' will guide the exploration of solutions and ensure that all necessary elements are addressed in the final design, including stormwater management, in terms of quality improvement and quantity control.
- Establish Objectives Identify Techniques - The goal of this step in the process is to explore the range of techniques that could be employed to address each target. This should be done with an emphasis on research and innovation, rather than acceptance of standard solutions. It is at this stage in the process that the overlap of techniques, which yields integrated solutions to achieve multiple objectives, begins to become evident.
- Explore Opportunities - Opportunities to achieve more than one objective through the application of single or multiple techniques should be identified. The unique attributes of the site and its context are the basis for the exploration of opportunities. The design team should collectively evaluate opportunities in order to ensure that objectives are addressed with a balanced perspective and to facilitate the thoughtful resolution of conflicts between competing objectives or contrary techniques.
- Generate Conceptual Alternatives - Opportunities should be assessed to confirm suitability, practicality and compatibility with legislative requirements. Opportunities assessed and determined to be feasible are then integrated into a comprehensive plan or plans, which illustrate a conceptual alternative for the integrated design of the site.
- Develop the Final Plan - Through an interactive process of design, evaluation and refinement, the final plan is evolved from the concept plan. Individual components of the final plan should be resolved with a continued emphasis on innovation within a multi-disciplinary forum. The final plan should not only address the implementation of physical initiatives, but also the recommendation of management-based solutions.
A.2 Subdivision/site planning and stormwater management practices
It is important to understand that subdivision/site planning is a fundamental determinant of the overall change in the hydrologic cycle for a given development. However, the significance of subdivision/site planning is not always well understood by the landowners, their consultants, local decision makers or the public. The following discussion provides an appropriate framework to understand this important aspect of the development process.
Watershed and subwatershed planning: environmentally responsible land use policies must be supported by environmentally responsible site design
The preparation of watershed and subwatershed plans is recognized as an essential part of the land use planning process. The watershed and subwatershed planning process is integrated with the official plan preparation and review process to ensure that an ecosystem approach is adopted in making land use planning decisions.
Watershed and subwatershed plans address the ecosystem at a regional level. At this level, land use decisions are made as generalized policies and guidelines, and environmental information is often collected and interpreted at a broad scale. While these broad scale evaluations allow the development of strategies which are not possible through site specific evaluations, it is not always possible to interpret the merits or demerits of various individual development proposals at this stage.
The fundamental objectives of watershed and subwatershed planning can only be realized if the principles of watershed/subwatershed planning are also applied during the planning and design of individual development projects. At this point of the development process, detailed site information is available and the physical parameters of the proposed development are determined. The subdivision/site planning stage is therefore an important step in the planning process when the impact of the development proposal on the environment can be specifically assessed. The integration of land use planning and environmental planning at a regional or district level must be extended to the process of site development and design.
Good planning integrates the design of a site and the design of the stormwater management facilities in one process
Historically, the preparation of subdivision plans, site development plans as well as building and architectural design plans has not involved early input from environmental planners, hydrogeologists, ecologists and water resources engineers. The landowners and the planners/designers prepare the plan based on the performance standards set by the municipal by-laws or guidelines (such as setback, floor space index, density, height, etc..), and the business objectives set by the landowners (such as total leasable floor area to be achieved, number of units for sale and the number of parking spaces to be provided).
Water resources engineers, and other associated professionals, are typically employed to address stormwater management after a preliminary site plan has been prepared. This process has inevitably made the proposed stormwater management facilities 'remedial' in nature since they are designed to handle a predetermined amount of runoff and to mitigate the negative impact of the proposed development. An alternative approach is advocated. The objective of reducing the root causes of negative impact on water management should be adopted as one of the basic design criteria directing the preparation of the site plan. The important aspect of good subdivision/site planning is that it should aim at reducing or preventing adverse impacts instead of mitigating them.
Public perception and implementation of innovative subdivision/site planning approaches
There is a perceived public attitude that many of the proposed environmentally friendly subdivision/site planning techniques such as cluster housing forms, roadside ditches and the inclusion of runoff infiltration devices within residential lots are undesirable and represent a reduction in the level of service. This perception extends to some municipalities whose development standards may constrain the use of innovative subdivision/site planning techniques. As a result, developers may hesitate to include these design alternatives in their site development plans. Nevertheless, the attitude of the public is changing as more innovative projects are delivered into the market and the public sees the value of these new design concepts. Creative stormwater management design ideas should be encouraged and adopted as part of the design during the subdivision/site planning stage of the development process.
The most environmentally sound design is generally the most economical
Subdivision/site planning generally reduces the cost of the development due to:
- lower grading requirements/costs;
- lower tree clearing costs;
- lower servicing costs (swales instead of storm sewers);
- lots with mature trees are more saleable/valuable;
- lots that back on to greenbelts are more saleable/valuable;
- tourism dollars in areas with sports fishery; and
- lower end of system clean up costs (i.e., dredging, etc..).
A.3 Subdivision/site planning and design objectives
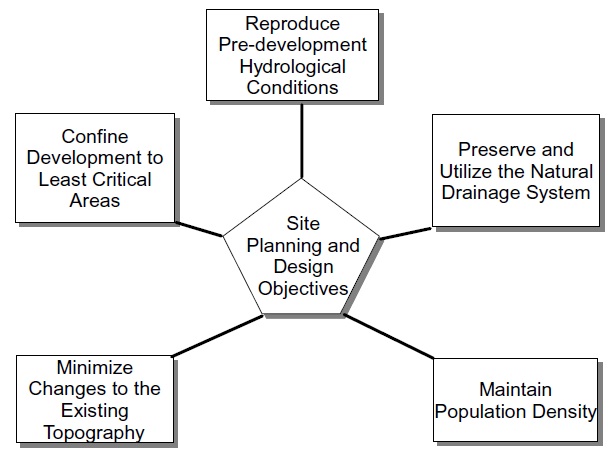
There are many excellent references, such as "Protecting Water Quality in Urban Areas – Best Management Practices for Minnesota" (Minnesota Pollution Control Agency, 1989) which illustrate the value of subdivision/site planning. These references were reviewed in the formalization of the objectives shown in Figure A.1. Design decisions made during the subdivision/site planning stage of a project should be assessed against these objectives.
Figure A.1: Subdivision/Site Planning and Design Objectives
A.4 Subdivision/site planning methodology
To assist site designers, the objectives have been translated into a subdivision/site planning methodology which may be used to prepare a development layout. The process may be summarized as follows:
- Agency Consultation - identify existing resource mapping/data and natural resource concerns.
- Resource mapping – identify significant natural functional areas for protection.
- Designation of development area – determine the areas for development based on the resource mapping information.
- Evaluate stormwater management requirements based on the preliminary site plans. Indicate locations and land area to be formalized in the site plan for the purposes of stormwater management.
- Adoption of environmentally responsible site planning and design criteria – apply a set of environmentally responsible design criteria to the development area during the preparation of the site plan options.
- Finalization of the subdivision/site layout – examine the various site plan options based on the criteria and select the option that best meets the site planning and design objectives.
A.4.1 Agency consultation
The regulatory agencies (Local Municipality, Ministry of Natural Resources, Ministry of the Environment, Conservation Authority) should be contacted for information on existing areas which are deemed to be environmentally significant.
A.4.2 Resource mapping
Resource mapping is required to ensure that significant natural resources are maintained or enhanced. On an appropriate scale (≤ 1:2000) map of the proposed development site an outline of the following resources should be clearly delineated:
- ESA/ANSI areas;
- watercourses, lakes and other water bodies;
- wetlands;
- significant vegetation/woodlots;
- wildlife corridors;
- high recharge potential areas;
- regulatory floodlines and/or fill lines;
- stream and valley corridors;
- bank instability and erosion setbacks; and
- steep sloped areas.
Much of the information required for resource mapping may have been delineated (usually at a larger scale) in the watershed or subwatershed plan (if it has been completed). Reference should be made to these plans as part of the site investigations.
ESA/ANSI areas
The Ministry of Natural Resources and the Conservation Authority should be contacted for mapping which indicates Environmentally Sensitive Areas (ESA) and Areas of Natural and Scientific Interest (ANSI). Municipalities should also be contacted for mapping related to any Locally Significant Areas (LSA). These areas should be transferred to the site mapping and be clearly shown on development submissions.
Watercourses, lakes and other water bodies
Watercourses, lakes, and other water bodies should be denoted on the resource mapping. Ontario Base Mapping (1:2000, 1:10000), where available, is a useful source of information which will indicate surface water resources. Larger scale topographical mapping will also indicate most surface water resources. In some cases, however, not all surface water resources may be delineated to preserve clarity (i.e., in areas with high topographical relief – many contours). In all instances, a site visit should be undertaken to confirm the surface water resources in the vicinity of the proposed development.
Wetlands
Wetlands should be shown on the resource mapping and Provincially Significant Wetlands should be identified. An environmental impact study (EIS) will generally be required if development encroaches within 120 m of a Provincially Significant wetland boundary, and it may be required for other wetlands as well. This study will assess the potential impacts of development on the wetland and recommend an appropriate buffer width and/or other mitigative measures.
Areas of significant vegetation
A terrestrial biologist should walk the site to identify the areas of the site with significant vegetation. Significant vegetation includes provincially significant, regionally significant, and locally significant species. An area can also be deemed significant, in terms of its vegetation, if it provides a corridor or refuge area for wildlife, a food source for terrestrial/aquatic species, a significant hydrological function, and/or a buffering capacity to mitigate the effects of urban development on the stream and valley corridor system.
In some cases, information on the vegetation of a site can be obtained from the Conservation Authority, Ministry of Natural Resources, and/or local naturalist groups. However, where mapping/information is dated, a site walk/inventory should be done. Not only may site conditions have changed, but also, values with respect to the importance of vegetation have evolved dramatically and may influence the mapping/information collected. The limit of development should be the drip line of the vegetation. No earthworks should be permitted within 3 to 5 metres of the vegetation drip line to protect root systems.
Wildlife corridors
The significance of wildlife corridors is best addressed in Watershed or Subwatershed Plans. These plans should be reviewed if they exist. If a watershed plan and/or subwatershed plan has not been completed, the Ministry of Natural Resources should be consulted for input. A site walk by a terrestrial biologist should be undertaken to confirm the recommendations of the watershed/ subwatershed plan and the information provided by the Ministry of Natural Resources. Information from the site walk should be compared to the greenspace areas in the surrounding geographic area to determine if a wildlife corridor exists on the site. Significant wildlife corridors should be drawn on the resource map.
Recharge areas
Boreholes and test pits are required to determine the groundwater recharge potential for the site. This investigation must be undertaken by a qualified soils consultant or geotechnical engineer. Information which needs to be collected includes soil types, soil depths, the depth to the water table, the degree of soil compaction, soil percolation rates, the estimated high seasonal water table depth, the depth to bedrock, and soil particle size distributions.
Percolation rates measured in the field may be used as an indicator of the potential for groundwater recharge. Areas with a percolation rate greater than 50 mm/h should be identified as important recharge areas (i.e., any development must ensure that recharge is maintained), and areas with a percolation rate greater than 100 mm/h should be identified as critical recharge areas (i.e., areas that may be non-developable or require significant investigation in support of development), given that the depth to bedrock and depth to the water table are greater than 3 m below the ground surface.
It is important to identify other hydrogeologically sensitive areas, such as locations where aquifers may be susceptible to contamination due to their proximity to the surface and the nature of surficial deposits.
Regulatory floodline and/or fill line
The regulatory floodline and/or fill line should be shown on the resource map if the proposed development is adjacent to a watercourse. If a floodline or fill line has not been delineated, and is not required to be delineated (i.e., upstream drainage area is small (< 125 ha) and the Conservation Authority is not concerned with flooding) it does not need to be shown on the map of the site. In cases where the flood or fill line is not shown, the watercourse should still be shown as it may serve an important ecological function.
Stream and valley corridors
The area required to protect stream and valley corridors is best decided at the subwatershed plan level. The stream and valley corridor area should be shown on the resource map.
Bank instability and erosion areas
Areas susceptible to bank instability and erosion should be identified on the resource map. These areas will typically be within the stream and valley corridors. Tables C.1 and C.2 provide guidance on identifying areas susceptible to erosion.
Steep sloped areas
Areas with a slope of greater than 20% should be identified on the resource map. These areas may be difficult to develop (i.e., result in significant alteration to the natural topography) and should be noted as constraint areas.
A.4.3 Designation of development area
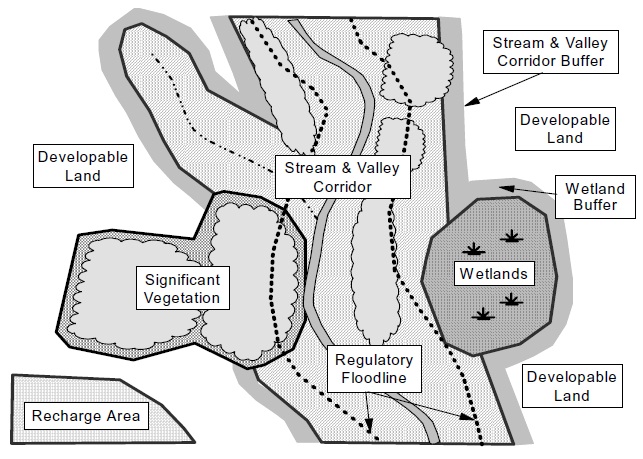
The resource mapping information should be compiled into overlays of information sheets and maps for easy cross referencing. These overlays will illustrate the inter-relationship between the different elements of the ecosystem. At this stage, the planner/designer should determine where development should occur within the site to minimize impacts on the environment. Figure A.2 illustrates the concept of resource mapping to determine developable land. Once the area of developable land has been identified, a development layout should be prepared based on a set of environmentally responsible subdivision/site planning and design criteria.
Figure A.2: Resource Mapping
A.4.4 Reserve appropriate areas for stormwater management
Subdivision/site planning must reflect the need for stormwater management. This requires interaction between planners/designers and stormwater management professionals to ensure that there is adequate land area in appropriate locations designated for the purpose of stormwater management. The requirements for stormwater management will depend on the water management criteria which have been established for the site, the stormwater management measures that are contemplated, and the actual site planning that is proposed. The full range of stormwater management measures (lot level, conveyance, end-of-pipe) should be contemplated. At this stage, preliminary design and siting of stormwater management controls would be appropriate.
Urban stormwater management practices should be located outside of the floodplain wherever possible. In some site specific instances SWMPs may be allowed in the floodplain if there is sufficient technical or economic justification and given that they meet certain requirements:
- The cumulative effects resulting from changes in floodplain storage, and balancing cut and fill, do not adversely impact existing or future development;
- Effects on corridor requirements and functional valleyland values must be assessed. SWMPs would not be allowed in the floodplain if detrimental impacts could occur to the valleyland values or corridor processes;
- The SWMPs must not affect the fluvial processes in the floodplain; and
- The outlet invert elevation from any SWMP should be higher than the 2 year floodline and the overflow elevation must be above the 25 year floodline.
In most cases, online facilities (those located within a watercourse) are discouraged because of concerns for wildlife movement, fish passage and disruption of energy inputs. Online stormwater quantity facilities may be acceptable if designed such that the bankfull flows, and hence fish movement, are not impeded/obstructed, and provided that the foregoing requirements are met. Online quality ponds can only be approved if issues of aquatic habitat can be resolved. An online facility could only be proposed in the context of a subwatershed plan.
The location of end-of-pipe stormwater management facilities is a contentious issue since the use of tableland reduces the overall developable area. In an effort to minimize the loss of developable land municipalities can consider the use of parkland dedication for SWMPs which offer passive recreational opportunities and follow the municipality’s greenland strategies (parkland objectives) wherever possible.
A.4.5 Adoption of environmentally responsible subdivision/site planning and design criteria
The following general planning and design criteria are recommended:
- preserve existing topography and natural features;
- protect surface water and groundwater resources (stormwater management);
- adopt compact development forms;
- adopt alternative site development standards; and
- re-create natural habitats within the development areas.
These criteria, and techniques which can be used to accomplish them, are discussed in the following sections.
Preserve existing topography and natural features
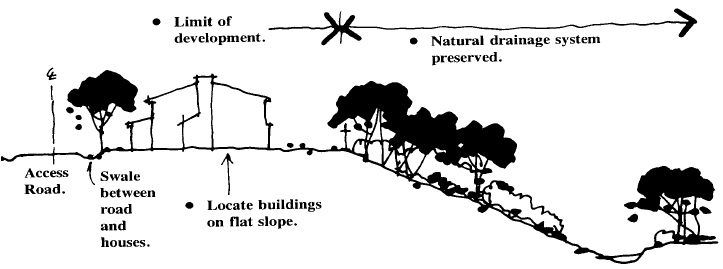
In order to preserve the existing topography and natural drainage system, buildings and roads should be located along high points and on flat slopes (Figure A.3). Natural drainage swales should be used to convey runoff from the development to the receiving waters (Figure A.4). This approach will reduce the area disturbed by cutting and filling along the slope and minimize the amount of surface area susceptible to erosion.
Figure A.3: Preservation of Existing Topography
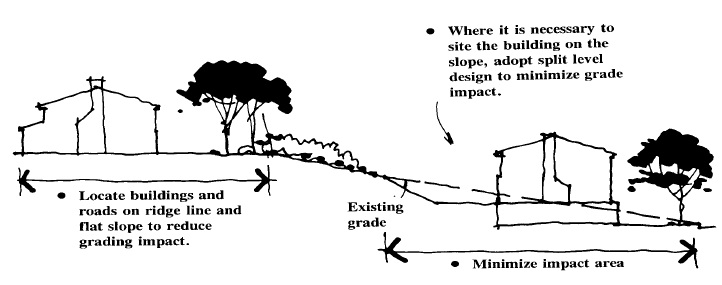
Figure A.4: Preservation and Utilization of the Natural Drainage System
The application of this criterion must be made with consideration for the visual impact of locating buildings on and along the ridgelines of the landscape. To avoid the visual intrusion of buildings along attractive natural ridgelines and the disruption of existing prominent landforms, it may be necessary to site the buildings and the access roads along the contouring slopes.
Protect surface water and groundwater resources
The concerns with respect to surface and groundwater resources must be identified and the level of control required to address these concerns must be defined. The site plan should adopt a combination of lot level, conveyance and end-of pipe stormwater management approaches that will mitigate the effects of urbanization on surface and groundwater resources. The constraints and opportunities presented by the physical site conditions (e.g., site hydrology and soils) must be considered in the selection of stormwater management controls.
Adopt compact development forms
Adoption of compact housing forms such as cluster single dwellings, medium density townhouses and low-rise apartments, and high-rise apartments can compensate for restrictions in the area of developable land due to environmental features. A certain level of development density may be achieved while reducing the extent of disturbance to the site and the amount of site works required. Figure A.5 illustrates the concept of maintaining density with single detached cluster housing while reducing the overall development area. The feasibility of single detached cluster housing is dependent on the use of alternative development standards.
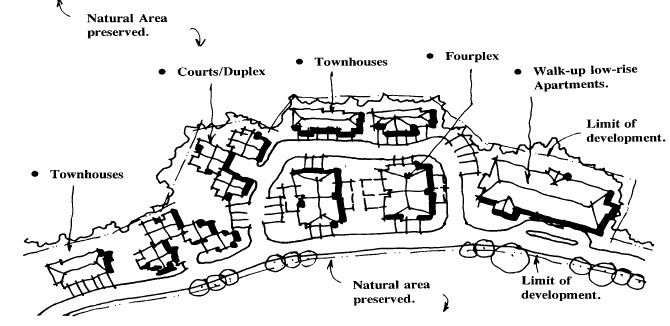
The Ministry of Municipal Affairs and Housing promotes compact, higher density housing forms. Compact, higher density housing forms are shown in Figures A.5 and A.6, and may include:
- cluster single lots with reduced lot frontages and alternative road/grading standards;
- higher density forms such as duplex and semi-detached;
- condominium singles;
- medium density housing forms such as townhouses, fourplex and low-rise apartments; and
- high density housing such as high-rise apartments.
Adopt alternative site development standards
Many of the compact development forms recommended above can only be implemented with flexible site design standards (building setbacks, grading requirements, minimum street gradient and turning radius, width of internal streets, locations of site services, provision of street boulevard areas).
Alternative development standards are generally allowed in non-freehold development projects (i.e., projects in which the services (roads, stormwater management facilities, etc..) are not municipally maintained – such as condominiums). Any public right-of-ways, public areas, and freehold residential lots, however, have to comply with the normal municipal planning and engineering (grading, servicing) standards. Public streets are designed to have a wide right-of-way and gentle gradients. These standards may limit the implementation of alternative housing forms to non-freehold developments. The adoption of alternative cluster single lots for the typical freehold development, for example, will be less effective if alternative development standards are not utilized.
Alternative development standards complement reduced lot frontages and depths to reduce the overall development footprint. "Making Choices: Alternative Development Standards Guideline" (Ministry of Municipal Affairs and Housing, 1995) reviews municipal standards and recommends alternative standards to reduce development costs, promote compact urban form, and mitigate environmental impacts.
Figure A.5: Cluster Single Detached Dwellings
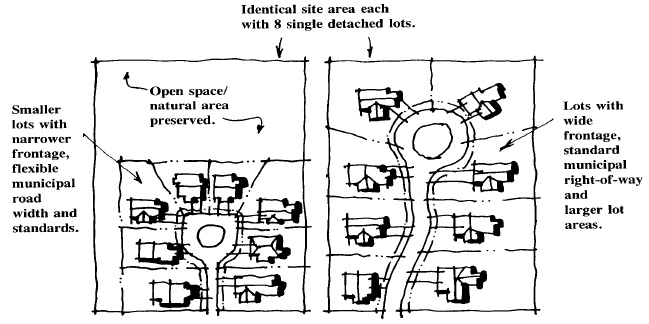
Figure A.6: Other Forms of Cluster Housing
Some alternative engineering standards which help to reduce the overall footprint of development include:
-
reduced road widths on local roads
Reducing the road width to 6 m on local roads allows for two way traffic without street parking or one way traffic with parking. This reduces the overall pavement area, and hence costs, for the subdivision. The reduction in the pavement area will minimize the amount of land to be disturbed and grading works. It will also provide more flexibility for the planner/designer to align the proposed road along existing contours and integrate it into the existing landform.
-
reduced cul-de-sac turning radius
A reduction in pavement and overall land consumption can be achieved if the cul-de-sac turning radius is reduced from 14 to 11 metres.
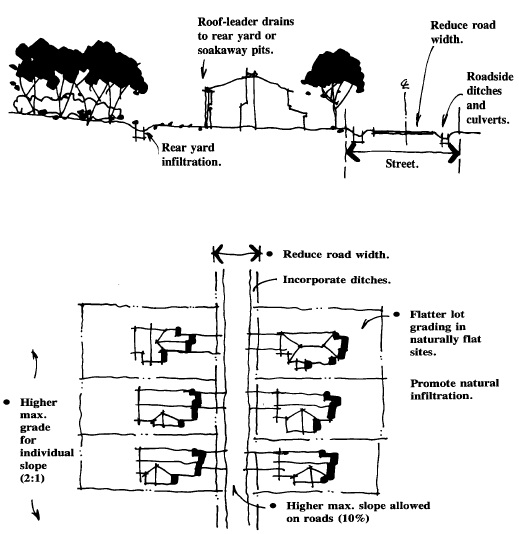
Other alternative engineering standards which minimize environmental degradation and changes to the natural function of the land are shown in Figure A.7 and include:
-
a wider range in allowable lot grading
A reduction in the minimum allowable lot grade promotes natural infiltration and creates greater depression storage. Due to the problems of physically being able to grade below 2%, there should be an elevated apron around buildings (within 2 to 4 metres) to ensure that water does not drain towards the building foundation.
Flatter lot grading should be promoted in naturally flat areas but radical changes to the existing topography should not be made. Municipal grading standards may also need to be modified for development within areas of varying topography to permit steeper lot grading. This flexibility will assist the designer to site the buildings along the slope and fit the built form into the terrain with minimum disturbance to the existing topography.
-
higher maximum allowable slopes on roads (10% instead of 6%) and individual lots (2:1 instead of 3:1)
The increase in range of maximum allowable slopes allows planners/engineers greater flexibility in designing developments within the existing topography. Economic and environmental benefits accrue from reduced grading requirements, although there may be some drawbacks such as greater requirements for sanding/salting these roads during the winter and increased erosion potential in roadside ditches. On the other hand, narrower road surfaces will also mean reduced amounts of road salt/sand and lower construction costs. These issues are best addressed from a holistic perspective recognizing the environment, the economy, and the functionality of the subdivision/site design.
Figure 1.7: Alternative Development Standards
-
discharge of roof leaders to soakaway pits or rear yards for natural infiltration/evaporation
Water that is discharged from roof leaders is relatively clean water. The only potential contamination of this water is by atmospheric deposition and roofing materials. Options that promote the infiltration of this water into the surrounding native soil material are promoted since they reduce peak flows and enhance groundwater/baseflow recharge. Roof leaders discharge to the surface should be minimum standard practice even in areas where there are physical constrains on infiltration.
-
servicing via enhanced grassed swales and culverts instead of storm sewers
The use of grassed swales (commonly referred to as ditch and culvert servicing) is viable for lots which will accommodate swale lengths ≥ the culvert length underneath the driveway (not just the driveway pavement width). The swale length should also be ≥ 5 m for aesthetic and maintenance purposes. This is generally achievable for small lots (9 m) with single driveways or larger lots (15 m) with double driveways. Grassed swales provide numerous benefits (water quality enhancement, reduction of water quantity peak flows and volumes, easier snow removal, storage for snow removal) and are recommended for implementation wherever feasible.
-
foundation drains to soakaway pits or sump pumped to the rear yards for natural infiltration
Foundation drainage is relatively clean water having been filtered by the backfill surrounding the foundation. Options that promote the infiltration of this water into the surrounding native soil material reduce peak flows and enhance groundwater recharge. In areas where infiltration is not appropriate (i.e., percolation rate < 15 mm/h), a separate foundation drain should be considered to reduce the volume of water being treated by any end-of-pipe stormwater management facility.
-
increase rear lot overland drainage
A greater tolerance for designs that allow overland drainage across lots is preferred from an environmental standpoint since they provide greater opportunities for reducing peak flows and stormwater volumes. Overland drainage also provides opportunities for water quality improvement through settling, adsorption, filtration, and infiltration.
Opportunities to increase rear lot overland drainage include:
- allowing lots backing on to one another to drain through each other; and
- increasing the allowable length of rear yard swales and contributing drainage area.
-
increase the allowable vertical sag at intersections (K of 4 instead of 10)
An increase in the allowable elevation differences for intersection approaches will allow a development to be designed with less changes to the existing topography. This alternative standard is promoted for stop intersections, but may not be applicable for through-type intersections due to increased traffic safety concerns.
Re-create natural habitats within the development areas
Within the designated development areas, and as part of the overall subdivision/site planning concept, opportunities to recreate natural habitats should be identified. Opportunities could include selected areas within public parks, roadside revegetation with native woodland species, naturalization of any disturbed slopes, and assisted natural regeneration along existing or new watercourses.
A.4.6 Finalization of the subdivision/site layout
Different design options which meet the adopted subdivision/site planning criteria will have been generated. To select a preferred subdivision/site layout, the planners/designers should evaluate the options against the objectives outlined in Section A.3. The subdivision/site layout which best satisfies these objectives should be endorsed as the appropriate development strategy.
Appendix B: proposed protocol for detailed design approach
The objective of this Appendix is to provide a checklist for the Detailed Design Approach. The checklist may be modified to fit a specific project or site as required.
Step 1: project goals and objectives, channel characterization and study scope
This step is designed to provide a framework for further investigations by establishing the project goals and objectives, providing a preliminary characterization of the channel system and possible disturbances, and defining the spatial scope of the investigation.
Data collection
- Collection and Review of Existing Documentation
- Land use and topographic mapping, aerial photography
- Historic
- Existing
- Future
- Infrastructure mapping
- Background reports, surficial geology (physiographic) mapping
- Hydrometeorological data
- Regional flow-geomorphic data
- Historic channel surveys
- engineering drawings (bridge crossings, channelization works, pipeline crossings, etc..)
- geomorphic-sedimentologic surveys
- geotechnical studies (soils or borehole data)
- Land use and topographic mapping, aerial photography
- Desktop Analyses
- Longitudinal channel profile
- Estimated bankfull flow
- Anticipated channel form
- Synoptic Field Survey
- Site Reconnaissance and completion of a Rapid Geomorphic Assessment (RGA)
- Classification of Stream Type
Analysis
- Determine Total Basin Imperviousness (TIMP)
- Assess past changes in sediment-flow regime
- Determine tributary area
- Re-construct land use and channel works history
- Preliminary Mapping of 'like' reaches
- Compare historic channel form with current form
- Assess channel stability and probable mode of alteration
- Assess the significance of prior disturbances on channel form
- Determine if the channel is currently in a state of adjustment
- Identify constraints and opportunities for Stormwater Management (SWM) measures
Step 2: Identification of causative factors
If a prior disturbance has had a significant impact on channel form and the channel is in a state of adjustment, then undertake the following analysis. Otherwise proceed to Step 3.
Data sources
- Existing documentation (Step 1)
- Empirical Relations
- Channel Enlargement Curve
- Mesoscale Channel Form Relaxation Curve
Analysis
- Identify the probable cause and magnitude of the disturbance(s)
- Select a methodology for assessment of the impact of the disturbance(s) based on (1.) above
- If a natural phenomenon, assess whether the disturbance is endemic to the channel system or an external event
- If the disturbance is anthropogenic in origin determine the timing and magnitude of the disturbance and the likely alteration in the flow-sediment regime. For example, if the impact is due to urbanization:
- Determine the fraction of the tributary area for which land use alteration has occurred for 5 to 6 time periods (10 years for each period) beginning with the current year and moving backwards in time
- Determine the TIMP for each period
- Determine the area weighted average age of development (ti) for each period
- Estimate the relaxation time
- Approximate the degree of completion of the adjustment process from the Relaxation Curve
- Estimate the ultimate channel enlargement ratio under existing land use conditions and drainage practices from the Channel Enlargement Curve
- Determine the amount of channel enlargement that is yet to occur
- Determine the significance of other factors, e.g., knickpoints, sediment waves, hydraulic controls, channel works, localized perturbations in the flow regime, etc..
Step 3: reconstruct the historic (pre-disturbance) channel form
The previous assessment of historic channel form represented a preliminary estimate of channel hydraulic geometry. This Step involves a more rigorous definition of the historic channel form if deemed necessary. Otherwise proceed to Step 4.
Data sources
- Existing documentation (Step 1)
- Personal accounts
- Empirical Relations (Step 2)
- Paleo-fluvial techniques
- Field survey data (Step 5)
Analysis
- Re-construct the pre-disturbance channel form from historic surveys and/or paleo-fluvial techniques
- If the historic surveys were taken subsequent to the de-stabilization of the channel use hindecasting techniques, such as the Relaxation Curve, to estimate the pre-disturbance channel form
- Confirm the hindecaste estimation of the pre-disturbance form using a regional data base (if available), geomorphic indicators (see step 5), personal accounts, oblique and aerial photographs, historic mapping, and/or paleo-fluvial techniques
- Estimate the bankfull hydraulic geometry parameters
Step 4: assess the impact of future disturbances using empirical relations
Assuming that the development project were to proceed without the implementation of SWM control measures determine the probable impact on channel morphology.
Data sources
- Existing documentation (Step 1)
- Empirical Relations (Step 2)
Analysis
- If it has been determined from the pervious Steps that the channel is evolving toward a new equilibrium position in response to a past disturbance, then this alteration in form must be accounted for in this Step
- Assess the impact of future land use change
- determine the ti under future land use conditions
- determine the total directly connected impervious area under future land use conditions
- assess the impact of proposed SWM measures for erosion control
- Determine the ultimate Enlargement Ratio
- Assess the impact of other contributing Factors (assumed to be secondary to the change in flow regime associated with urban development)
- Determine the increase in Enlargement Ratio between existing and future land use conditions
- Identify constraints and opportunities if different from step 2
Step 5: existing channel dynamics
The preceding analysis have relied primarily on existing data sources, with the possible exception of the paleo-fluvial investigations. The remaining steps are based on the collection of field data characterizing the current channel form.
Data sources
- Field Survey
- Geodetic survey of channel longitudinal profile (along the channel thalweg). A fixed longitudinal spacing for measurement of the bed profile can be adopted if the selected interval is approximately 1/5 the length of the shorter of the pool or riffle features. If a fixed interval sampling protocol is selected, measurements should also be recorded at all major break of slope points.
- Geodetic survey of the channel cross-section:
- select a representative number sites for detailed sections
- select a number of sites for less detailed study
- For each of the detailed sections:
- map bank stratigraphy
- characterize the bank materials
- map root zone depth
- determine root density
- characterize the riparian vegetation
- complete a pebble count survey
- map bankfull stage indicators
- prepare photographic documentation
- ix) sketch bank profile noting location of bankfull indicators, soil strata, terraces, root zone depth, etc..
- sketch channel plan form geometry up and downstream of the survey section
- Regional Data Base
Analysis
- Determine channel hydraulic geometry relations
- Determine sediment mass curves
- Develop shear stress vs. depth curves
- Develop stream power relations
- Estimate critical shear stress values for selected boundary stations
- Plot the longitudinal profile
- Plot the cross-sections
- Determine hydraulic parameters such as Manning’s 'n' value, water surface slope, flow rate versus depth, etc..
Step 6: observed channel response
If a significant prior disturbance has occurred, then the actual response of the channel to the disturbance must be estimated and its impact on the proposed development project assessed. Otherwise proceed to step 7.
Data source
- Field Survey (step 5)
- Historic channel form (step 3)
- Pre-disturbance channel form (step 3)
- Empirical relations (step 1)
Analysis
- Determine actual Channel Enlargement Ratio using the current channel form as measured in step 5 and the estimated pre-disturbance form as determined in step 3
- Plot the actual Channel Enlargement Ratio on the Channel Enlargement Curve to validate the estimate of ultimate channel form completed in step 3
- Determine actual channel evolutionary state using the Relaxation Curve
- Identify the mode of channel enlargement and the probable, ultimate channel plan and cross-sectional form
Step 7: the need for mitigation and the development of channel remediation strategies
Based on steps 4 and 6 assess the:
- need for mitigation of the channel due to past disturbances and the probable impact from the proposed development project
- develop channel restoration alternatives (if required)
Data sources
- Dimension of the ultimate channel form (step 6)
- Goals and objectives (step 1)
Analysis
- Determine if the ultimate channel form and its function meet the project goals and objectives
- Based on (1.) above assess the need for and feasibility of remediation
- Identify constraints and possible remediation strategies
- Develop SWM design targets
Step 8: watershed management strategies
Develop a SWM program that addresses the predicted impact on channel form and function relative to project goals and objectives using the design criteria developed in step 7.
Data sources
- All previous steps
- Hydrologic-hydraulic and sediment transport models
Analysis
- Identify SWM alternatives (each alternative is comprised of a suite of management practices)
- Develop a decision support algorithm for use in the evaluation of the SWM alternatives
- Evaluate the SWM alternatives and select a preferred approach
- Undertake the preliminary design and costing of the preferred approach
- locate the required SWM facilities
- develop the appropriate implementation programs
- design the end-of-pipe facilities by establishing the:
- contribution of lot level and conveyance controls
- the active storage volume in the end-of-pipe facility
- the rating curve for the pond outlet structure (Appendix D)
Step 9: selection of the preferred channel restoration strategy
Once the SWM program has been established, the final assessment of the channel restoration options may be completed resulting in the selection of a preferred restoration program. If channel restoration is not required, proceed to step 10.
Data sources
- Dimension of the ultimate channel form (step 6)
- Goals and objectives (step 1)
- Existing data sources (previous stepS)
- Constraints and opportunities mapping (step 7)
Analysis
- Translate generic design alternatives into site specific remediation options
- Develop cost estimates
- Select a preferred channel restoration alternative
Step 10: preferred restoration plan
Data sources
- Funding mechanisms
- Cost estimate (step 9)
- Land use plans (step 1)
- Stewardship partners
- Monitoring requirements
- Land use activities (step 1)
- Stormwater management policies (step 8)
- Construction opportunities and constraints
Analysis
- Identify funding partners, requirements and funding formulas
- Identify phasing options and schedule
- Identify stewardship options
- Identify monitoring strategies (baseline, during and after construction)
- Develop an Implementation Plan
Step 11: detailed design
Prepare detailed design drawings and specifications for the SWM facilities and stream restoration works as required.
Data sources
- Design relations and criteria from previous steps
- Location of aggregate mines, quarries and disposal sites
- Transportation route mapping
- Constraint mapping from previous steps
- Cost estimates from previous steps
- Hydraulic, hydrologic and sediment transport models
- Monitoring requirements from previous steps
Analysis
- Erosion threshold analysis
- Plan and cross-section details
- Bed armor specifications
- Evaluate scour and deposition scenarios for possible service corridor conflicts
- Outline a detailed monitoring program for key geomorphic and habitat variables
- Complete geotechnical analyses of banks as required
- Relocate services as required
- Identify construction periods for instream work, access routes, material supply sites, haulage routes, fill disposal areas, etc..
- Prepare detailed design drawings, landscape plans, specifications and tender documents as required
- Undertake construction supervision (if required), and
- Revise cost estimates
- Implement baseline and during construction monitoring
- Undertake any other tasks deemed necessary
Note: The above list of tasks and data sources is not exhaustive. Proponents are expected to undertake the design in accordance with their own specifications and requirements as identified by the proponent for any particular project.
Appendix C: simplified design approach
This Appendix provides additional information concerning the derivation and application of the Simplified Design Approach outlined in Section 3.4.3 of the main report. The first sub-section deals with the derivation while the remaining sub-sections elaborate on the three major components of the Simplified Design Approach. These components are:
- a synoptic level geomorphic survey of the stream channel to collect measurements of channel form and assess channel stability;
- assessment of the applicability of the Simplified Design Approach for the proposed development; and
- determination of the volume of source control and storage within an end-of-pipe facility (pond).
This Appendix focuses on the Rapid Geomorphic Assessment and storage volume determination elements.
C.1 Derivation of the simplified design approach
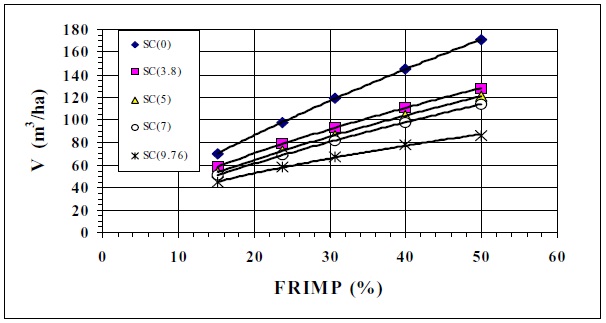
Curves showing pond active storage volume as a function of total amount of directly connected imperviousness area (IMPSWM) are provided in Figures C.1(a) and (b) for Soil Conservation Service (SCS) Hydrologic Soils Groups A to B and C to D, respectively. These curves provide a simplified method for the estimation of the active storage volume for small developments (that satisfy the criteria established in Table 3.4), knowing IMPSWM, the SCS Hydrologic Soils Group and the amount of Source Control (in this context, source control includes lot level and conveyance controls). The derivation of the approach as outlined below is based on geomorphologic assessments carried out on over 40 streams in Ontario, British Columbia, Texas and Vermont as well as calibration of these curves as presented in Figures C.1(a) and (b) based on a continuous modelling of the flows and erosion potential in two streams in southern Ontario. The two case studies were:
- the west branch of the Humber River through the City of Brampton; and
- Morningside Tributary through the Town of Markham.
The model used in the analysis was QUALHYMO, a continuous hydrologic simulation model with pond routing algorithms and a routine for the assessment of in-stream erosion potential. The latter is expressed as indices based on a two-dimensional representation of excess boundary shear stress about an arbitrary channel perimeter. The hydrologic component of the model was set up and calibrated to flow gauge data collected by Environment Canada. The erosion index component of the model was set up based on diagnostic geomorphic surveys of the stream channel. The model was calibrated to observed geomorphic activity rates and verified using empirical relations developed for urban streams throughout North America.
Following the setup of the model a corroborative approach was adopted using hydrologic methods (flow exceedance analysis), critical shear stress concepts, and empirical relations and observations of geomorphic activity rates to provide independent but parallel methods of assessment. Different land use conditions were then assessed including:
- the pre-development scenario;
- the existing land use condition; and
- the future land use scenario.
The model for the latter two land use conditions was set up to assess the following SWM options:
- no SWM measures (baseline condition);
- centralized (end-of-pipe) control with no Source Control assuming:
- 2-year control;
- 25 mm-24 hour control; and
- Distributed Runoff Control.
- centralized control with various levels of Source Control.
In each case the erosion indices were determined and compared to the in-stream erosion criteria adopted for the assessment. The volume of the pond and the pond outlet control structure were adjusted to maximize the reduction of in-stream erosion potential to the maximum amount allowed by the design technique employed. Results from the analysis are presented in MacRae (1996). MacRae (1996) found that the conclusions were consistent among the various methods of assessment. Further, the two case studies are representative of a wide range of stream conditions and hydrographic characteristics found in southern Ontario.
C.2 Synoptic level geomorphic survey
A synoptic geomorphic survey involves:
- the assessment of channel stability and mode of adjustment; and
- an engineering-geomorphic survey of the following channel parameters:
- bankfull channel depth
- bankfull channel width
- the width of the flood prone area at an elevation corresponding to twice bankfull depth;
- the composition of the boundary materials composing the:
- lower third of the bank (on both banks); and
- the intact bed materials or armor layer.
- the Soil Conservation Service (SCS) Hydrologic Soil Group within the development.
These parameters will be used in the assessment of the suitability of the Simplified Design Approach for the design of SWM measures for the proposed development, and in the design of the volume of source control and pond storage.
C.3 Rapid geomorphic assessment
One approach to the assessment of channel stability and sensitivity to an alteration in the sediment-flow regime is to undertake a Rapid Geomorphic Assessment (RGA) of the channel system. An RGA form, developed for this purpose, is presented as one possible tool (Table C.1).
The RGA form consists of four factors that may be used to suggest evidence of adjustment in channel form or characterize processes indicating mode of adjustment. These factors are:
- Evidence of Aggradation (AI);
- Evidence of Degradation (DI);
- Evidence of Channel Widening (WI); and
- Evidence of Planimetric Form Adjustment (PI).
Each of the four factors is represented by a number of indices (see Column (3) in Table C.1). The indices are observed to be present or absent (Columns (4) and (5) in Table C.1). If "present" the index is registered in the "Yes" column and the total number of "Yes" responses is indicated in the cell labelled "Sum of Indices." For example, for the Factor "Evidence of Aggradation," the indices numbered 2, 3, 4 and 5 (Column (2) in Table C.1) were present over a specified length of stream so the "Sum of Indices" would be "4."
The "Factor Value" represents the number of "Yes" responses divided by the total number of responses. Consequently, in the above example, the "Factor Value" would be AI = 4/7 = 0.57 (assuming a response of "No" was recorded for all other indices). This process is repeated for each of the Factors listed in Column (1) of Table C.1. The "Factor Values" are then summed and divided by the number of Factors (m = 4) to arrive at the Stability Index (SI) value. Experience with approximately 40 streams indicates that the SI value may be interpreted in accordance with criteria outlined in Table C.2.
C.4 Simplified design approach: volume control
Once it has been established that the Simplified Design Approach is applicable then the volume of source control and the active storage component of the pond may be determined as a function of the SCS Hydrologic Soils Group and total basin imperviousness.
In-stream erosion control criterion
The change in in-stream erosion potential cannot exceed that change which is equivalent to a 10% paving of the basin without implementation of Stormwater Management measures for the control of erosion potential.
| Form/Process (1) | Geomorphic Indicator NO (2) | Geomorphic Indicator Description (3) | Present: No (4) | Present: Yes (5) | Factor: Value (6) |
|---|---|---|---|---|---|
| Evidence of Aggradation (AI) | 1 | Lobate bar | |||
| 2 | Coarse material in riffles embedded | ||||
| 3 | Siltation in pools | ||||
| 4 | Medial bars | ||||
| 5 | Accretion on point bars | ||||
| 6 | Poor longitudinal sorting of bed materials | ||||
| 7 | Deposition in the overbank zone | ||||
| Sum of indices | |||||
| Evidence of Degradation (DI) | 1 | Exposed bridge footing(s) | |||
| 2 | Exposed sanitary/storm sewer/pipeline/etc.. | ||||
| 3 | Elevated stormsewer outfall(s) | ||||
| 4 | Undermined gabion baskets/concrete aprons/etc.. | ||||
| 5 | Scour pools d/s of culverts/stormsewer outlets | ||||
| 6 | Cut face on bar forms | ||||
| 7 | Head cutting due to knick point migration | ||||
| 8 | Terrace cut through older bar material | ||||
| 9 | Suspended armor layer visible in bank | ||||
| 10 | Channel worn into undisturbed overburden/bedrock | ||||
| Sum of indices | |||||
| Evidence of Widening (WI) | 1 | Fallen/leaning trees/fence posts/etc.. | |||
| 2 | Occurrence of large organic debris | ||||
| 3 | Exposed tree roots | ||||
| 4 | Basal scour on inside meander bends | ||||
| 5 | Basal scour on both sides of channel through riffle | ||||
| 6 | Gabion baskets/concrete walls/etc.. out flanked | ||||
| 7 | Length of basal scour > 50% through subject reach | ||||
| 8 | Exposed length of previously buried pipe/cable/etc.. | ||||
| 9 | Fracture lines along top of bank | ||||
| 10 | Exposed building foundation | ||||
| Sum of indices | |||||
| Evidence of Planimetric Form Adjustment (PI) | 1 | Formation of cute(s) | |||
| 2 | Single thread channel to multiple channel | ||||
| 3 | Evolution of pool-riffle form to low bed relief form | ||||
| 4 | Cutoff channel(s) | ||||
| 5 | Formation of island(s) | ||||
| 6 | Thalweg alignment out of phase meander form | ||||
| 7 | Bar forms poorly formed/reworked/removed | ||||
| Sum of indices |
| Stability Index (SI) Value | Classification | Interpretation |
|---|---|---|
| SI ≤ 0.2 | In Regime | The channel morphology is within a range of variance for streams of similar hydrographic characteristics – evidence of instability is isolated or associated with normal river meander propagation processes |
| 0.21 ≤ SI ≤ 0.4 | Transitionally or Stressed | Channel morphology is within the range of variance for streams of similar hydrographic characteristics but the evidence of instability is frequent |
| SI > 0.4 | In Adjustment | Channel morphology is not within the range of variance and evidence of instability is wide spread |
A diminishing return is associated with increasing pond storage for the control of in-stream erosion potential. This appears to be due to:
- the loss of effective storage associated with longer flow retention periods as pond size increases and the tendency for precipitation events to occur as multiple events;
- the alteration of the hydrologic response of the basin from riverine to lacustrine due to the non-uniform effect of pond attenuation on the distribution of shear stress about the channel boundary (a greater decrease in erosive forces occurs at the bank toe than the channel bed resulting in the tendency to aggrade);
- the containment of flows associated with rare flood flow events within the active channel due to peak flow attenuation resulting in the extended duration of high flow rates; and
- the impact on the sediment regime increases with larger pond volumes and retention times.
Figure C.1(a) and C.1(b) provide the storage volumes for a given total directly connected basin impervious area (FRIMP) and a range of Source Control (SC) values. As can be seen in Figure C.1(a), an application of 3 watershed-mm of source control will result in a reduction in pond storage volume of approximately 17% for a basin with SCS hydrologic Soil Group 'D' soils and a FRIMP of 40%. It was also observed that the rate of reduction in pond volume with Source Control declines with additional Source Control. Using the previous example, an additional 3 watershed-mm of Source Control would result in an additional decrease in pond storage volume of approximately 10 percent. A further increase in Source Control to a total of 9 watershed-mm would result in an incremental pond storage volume reduction of 5.5 percent, and a total volume reduction of 32%.
Figure C.1: Pond Active Storage Volume for Control of In-Stream Erosion Potential as a Function of Total Directly Connected Impervious Area (FRIMP) and Source Control (including lot level and conveyance control, in watershed-mm)
a) SCS Soil Groups A and B
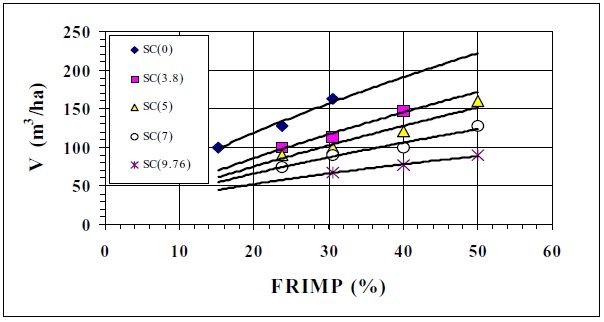
b) SCS Soils Groups C and D
The following steps summarize the approach:
- Determine the total directly connected impervious area (FRIMP) for the development area.
- Establish the predominant SCS Hydrologic Soil Group for the development area.
- Determine the amount of source control practical and feasible for the development area.
- Based on the FRIMP value, the predominant SCS Hydrologic Soil Group and level of source control select the appropriate curve in Figure C.1 and determine the pond active storage volume for the development area.
Having established the volume requirements for the end-of-pipe and source control measures required to control in-stream erosion potential, the next phase involves determination of the hydraulic performance of the end-of-pipe outlet structure (see Appendix D).
Appendix D: distributed runoff control (DRC) approach
This appendix deals with outlet design for end-of-pipe facilities. The primary objective is to release stored water at a rate which is consistent with meeting established erosion control targets. Several different design approaches may be used; however, this appendix describes only the Distributed Runoff Control (DRC) method.
Under pre-development conditions, the 'effective' flow controlling channel form has been found to be in accordance with bankfull stage (1.5 to 2 year recurrence interval). The smaller mid-bankfull events, although significant in terms of sediment transport within the stream, play a secondary role in the formation of the active channel. Studies have shown that as a result of development, there is an increase in the frequency of occurrence of mid-bankfull flows, and these smaller runoff episodes become the 'effective' geomorphic agents controlling channel form (Figure D.1). Based on these findings, the intent of the DRC approach is the control of in-stream erosion potential for:
- the range of flows exceeding the critical flow (the rate at which sediment transport of bed forms or intact boundary materials begins), up to bankfull stage, with
- the highest level of control focussed on flows in the mid-bankfull range.
Flow rates under the critical flow are controlled for water quality purposes while flows exceeding bankfull stage are controlled for flood hazard objectives. The three design zones are illustrated using a conceptualized rating curve for an end-of-pipe facility as shown in Figure D.2. Figure D.2 also illustrates the difference between the rating curves for the:
- 2 year peak flow shaving method (curve ADF);
- 25 mm-24 hour approach (curve ABDF);
- overcontrol procedure (curve AEF); and
- the Distributed Runoff Control (curve AC2DF) concept.
These curves were developed for a stream formed in boundary materials considered moderately sensitive to scouring (sandy silt to clay loam). Point 'D' in Figure D.2 corresponds to the bankfull flow (QBFL) defined for the channel at bankfull stage (DBFL). For all flows exceeding QBFL, flood hazard criteria apply. For all flows less than that corresponding to point 'C1,' water quality criteria apply.
The shaded portion of Figure D.2 denotes the flow rates which correspond to the mid-bankfull stage region of the channel (between 0.5 DBFL and 0.75 DBFL). These are the flows targeted by the DRC method for the greatest level of hydraulic routing. The mean annual flow rate lies within this region, and it is approximated by point 'C2' which is referred to as the DRC 'inflection point.' In more sensitive streams, the inflection point may shift toward point C3. In less sensitive streams, the inflection point may be adjusted toward point C1 as summarized in Table D.1.
Figure D.1: Mid-Bankfull to Bankfull Flow Range and the Corresponding Critical Flows
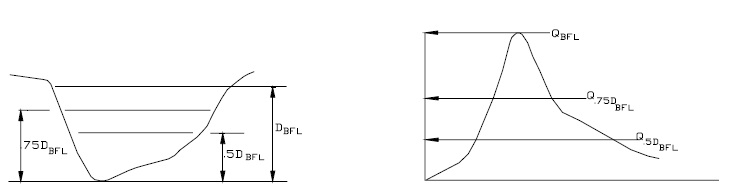
Figure D.2: Conceptual Rating Curve for an End-of-Pipe Facility showing:
- 2 Year Peak Flow Shaving Method;
- 25 mm-24 hour Approach;
- Overcontrol Procedure; and
- Distributed Runoff Curve (DRC).
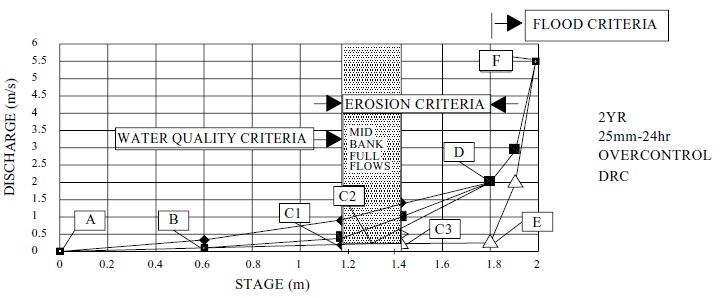
| Boundary Material Composition | Inflection Point (Figure D.2) |
|---|---|
| Sand to Sandy Loam (Very Soft to Soft) | Point C3 defined as Q at 0.75 DBFL |
| Sandy Silt to Clay Loam (Firm) | Point C2 defined as Q at 0.65 DBFL |
| Clayey Silt to Silty Clay (Stiff) | Point C1 defined as Q at 0.5 DBFL |
The DRC approach follows the overcontrol curve until the DRC inflection point. The overcontrol curve is determined as a multiple of the 2 year peak flow shaving curve. For example, to obtain 80% overcontrol (80% OC), the ordinates for the 2 year peak flow shaving curve are multiplied by 0.2 up to the bankfull flow. The amount of control (e.g., whether it is a 60% OC (multiplier 0.4) or 90% OC (multiplier 0.1)) is determined by the sensitivity of the receiving channel. The more sensitive the channel boundary materials to scour, the greater the degree of control as summarized in Table D.2.
| Boundary Material Composition | Description | Degree of Overcontrol (Multiplier) |
|---|---|---|
| Sand to Sandy Loam | Very Soft (loose to moderately compacted) | 0.15-0.2 |
| Sandy Silt to Clay Loam | Soft (moderately compacted) | 0.2-0.3 |
| Clayey Silt to Silty Clay | Firm (compacted) | 0.3-0.4 |
| Silty Clay | Stiff (highly compacted) | 0.4-1.0 |
The procedure for the development of the DRC rating curve is outlined in the following steps.
- Determine the composition of the intact boundary material (unless armored in which case the armor layer is used) at the bank toe of both banks (within the range of 0.2DBFL to 0.4 DBFL) and within the mid bed region at representative cross-sections in the channel downstream of the point-of-entry of the stormwater drainage from the development site.
- Using the least resistant of these units, determine the OC multiplier from Table D.1.
- Construct the 2 year peak flow shaving rating curve (ADF in Figure D.2) by drawing a straight line between points A and D.
- Construct the OC rating curve by multiplying the ordinates for the 2 year peak flow shaving rating curve by the OC multiplier (ABCE in Figure D.2 in which C is represented by one of C1, C2 or C3).
- Determine the DRC inflection point from Table D.1.
- Construct the DRC rating curve (points ABCDF in which C is one of C1, C2 or C3 as determined in Step 5).
Appendix E: plant species
Planting Zones
- Deep Water > 0.5 m
- Shallow Water < 0.5 m
- Shoreline Fringe – zone of frequent wetting
- Flood Fringe – zone of infrequent wetting
- Upland
| Scientific Name | Common Name |
|---|---|
| Brasenia schreberi | Water shield |
| Ceratophyllum demersum | Coontail |
| Elodea canadensis | Common waterweed |
| Lemna minor | Lesser duckweed |
| Lemna trisulca | Star duckweed |
| Myriophyllum sibiricum | Northern water milfoil |
| Myriophyllum verticillatum | Bracted water milfoil |
| Nuphar variegatum | Yellow pond lily |
| Nymphaea odorata | White water-lily |
| Potamogeton ramineus | Variable-leaved pondweed |
| Potamogeton natans | Floating-leaved pondweed |
| Potamogeton pectinatus | Sago pondweed |
| Scirpus validus | Softstem bulrush |
| Spirodela polyrhiza | Great duckweed |
| Utricularia vulgaris | Common bladderwort |
| Vallisneria americana | Tape grass, Eel grass |
| Scientific Name | Common Name |
|---|---|
| Acorus americanus | Sweet flag |
| Alisma plantago-aquatica | Water plantain |
| Calla palustris | Water arum |
| Carex lacustris | |
| Carex utriculata | |
| Equisetum fluviatile | Water horsetail |
| Glyceria borealis | Northern manna grass |
| Polygonum amphibium | Water smartweed |
| Pontederia cordata | Pickerel weed |
| Ranunculus reptans | Creeping buttercup |
| Sagittaria latifolia | Broad-leaved arrowhead |
| Sagittaria rigida | Stiff arrowhead |
| Scirpus acutus | Hardstem bulrush |
| Scirpus fluviatilis | River bulrush |
| Scirpus pungens | Common three-square |
| Scirpus validus | Softstem bulrush |
| Sparganium americanum | American bur-reed |
| Sparganium eurycarpum | Common bur-reed |
| Typha angustifolia | Narrow-leaved cattail |
| Typha latifolia | Broad-leaved cattail |
| Zizania aquatica | Wild rice |
| Scientific Name | Common Name |
|---|---|
| Asclepias incarnata | Swamp milkweed |
| Aster puniceus | Swamp aster |
| Bidens cernua | Nodding bur-marigold |
| Calamagrostis canadensis | Canada bluejoint grass |
| Carex bebbii | |
| Carex comosa | |
| Carex crinita | |
| Carex hystericina | |
| Carex pseudo-cyperus | |
| Carex stipata | |
| Carex stricta | |
| Carex vulpinoidea | |
| Cicuta maculata | Water hemlock |
| Decodon verticillatus | Swamp loosestrife |
| Dulichium arundinaceum | Three-way sedge |
| Eleocharis obtusa | Spike rush |
| Eleocharis smallii | Spike rush |
| Eupatorium maculatum | Joe pye-weed |
| Glyceria striata | Fowl manna grass |
| Iris versicolor | Iris versicolor |
| Juncus articulatus | Jointed rush |
| Juncus balticus | Baltic rush |
| Juncus canadensis | Canada rush |
| Juncus effusus | Soft rush |
| Juncus pelocarpus | Brown-fruited rush |
| Juncus torreyi | Torrey’s rush |
| Leersia oryzoides | Rice cut-grass |
| Lobelia cardinalis | Cardinal flower |
| Lycopus americanus | Water horehound |
| Lysimachia terrestris | Swamp candles |
| Mimulus ringens | Monkey flower |
| Osmunda regalis | Royal fern |
| Phalaris arundinacea | Reed canary grass |
| Reed canary grass | Marsh cinquefoil |
| Rumex orbiculatus | Great water dock |
| Scirpus atrovirens | Green bulrush |
| Scirpus cyperinus | Wool grass bulrush |
| Scirpus pendulus | Pendulus bulrush |
| Scutellaria galericulata | Marsh skullcap |
| Sium sauve | Water parsnip |
| Thelypteris palustris | Marsh fern |
| Triadenum fraseri | Marsh St. John’s Wort |
| Scientific Name | Common Name |
|---|---|
| Alnus incana | Speckled alder |
| Cephanlanthus occidentalis | Buttonbush |
| Cornus stolonifera | Red osier dogwood |
| Ilex verticillata | Winterberry |
| Lonicera oblongifolia | Swamp fly honeysuckle |
| Myrica gale | Sweet gale |
| Nemopanthus mucronatus | Mountain holly |
| Rhamnus alnifolia | Alder-leaved buckthorn |
| Ribes triste | Swamp red currant |
| Rosa palustris | Swamp rose |
| Rubus pubescens | Dwarf raspberry |
| Salix bebbiana | Beaked Willow |
| Salix exigua | Sandbar willow |
| Salix lucida | Shining willow |
| Salix petiolaris | Slender willow |
| Salix pyrifolia | Balsam willow |
| Spirea alba | Meadowsweet |
| Scientific Name | Common Name |
|---|---|
| Acer saccharinum | Silver maple |
| Fraxinus nigra | Black ash |
| Quercus bicolor | Swamp white oak |
| Salix nigra | Black willow |
| Scientific Name | Common Name |
|---|---|
| Aster novae-angliae | New England aster |
| Aster umbellatus | Flat topped aster |
| Bidens frondosa | Common beggar-ticks |
| Cyperus esculentus | Yellow nutsedge |
| Equisetum arvense | Field horsetail |
| Eupatorium perfoliatum | Boneset |
| Impatiens capensis | Spotted touch-me-not |
| Impatiens pallida | Pale touch-me-not |
| Juncus tenuis | Path rush |
| Lilium michiganense | Michigan lily |
| Lysimachia ciliata | Fringed loosestrife |
| Osmunda cinnamomea | Cinnamon fern |
| Urtica dioica | Stinging Nettle |
| Scientific Name | Common Name |
|---|---|
| Echinocystis lobata | Wild cucumber |
| Vitis riparia | Riverbank grape |
| Scientific Name | Common Name |
|---|---|
| Aronia melanocarpa | Black chokeberry |
| Cornus foemina | Grey dogwood |
| Lindera benzion | Spicebush |
| Physocarpus opulifolius | Ninebark |
| Potentilla fruticosa | Shrubby cinquefoil |
| Ribes americanum | Wild black currant |
| Rubus idaeus | Wild red raspberry |
| Salix amygdaloides | Peach-leaved willow |
| Salix discolor | Pussy willow |
| Salix eriocephala | Woolly headed willow |
| Sambucus canadensis | Elderberry |
| Vaccinium myrtilloides | Velvet-leaf blueberry |
| Viburnum cassinoides | Northern wild raisin |
| Viburnum trilobum | Highbush cranberry |
| Scientific Name | Common Name |
|---|---|
| Abies balsamea | Balsam fir |
| Carya laciniosa | Shellbark hickory |
| Fraxinus pennsylvanica | Red ash |
| Larix laricina | Tamarack |
| Picea mariana | Black spruce |
| Platanaus occidentalis | Sycamore |
| Populus balsamifera | Balsam poplar |
| Quercus palustris | Pin oak |
| Thuja occidentalis | Eastern white cedar |
| Ulmus americanum | American elm |
| Scientific Name | Common Name |
|---|---|
| Clematis virginiana | Virgin’s bower |
| Menispermum canadense | Canada moonseed |
| Parthenocissus quinquefolia | Parthenocissus quinquefolia |
| Smilax hispida | Bristly greenbrier |
| Scientific Name | Common Name |
|---|---|
| Crataegus crus-galli | Cockspur thorn |
| Lonicera hirsuta | Hairy honeysuckle |
| Prunus virginiana | Choke cherry |
| Viburnum lentago | Nannyberry |
| Scientific Name | Common Name |
|---|---|
| Acer rubrum | Red maple |
| Betula alleghaniensis | Yellow birch |
| Carya cordiformis | Bitternut hickory |
| Populus deltoides | Eastern cottonwood |
| Quercus macrocarpus | Bur oak |
Many of the species listed under Shoreline Fringe – Near Flood Fringe may be appropriate near the inside edge of the flood fringe. Flooding near the outside edge of the zone may be extremely rare such that the conditions for upland species will exist. The listed species are tolerant of intermediate moisture conditions.
| Scientific Name | Common Name |
|---|---|
| Acer saccharum | Sugar maple |
| Betula papyrifera | Paper birch |
| Crataegus spp. | Hawthorn |
| Fraxinus americana | White ash |
| Juniperus virginiana | Eastern red cedar |
| Pinus banksiana | Jack pine |
| Pinus strobus | Eastern white pine |
| Populus tremuloides | Trembling aspen |
| Quercus alba | White oak |
| Quercus rubra | Red oak |
| Tsuga canadensis | Eastern hemlock |
| Scientific Name | Common Name |
|---|---|
| Acer pensylvanicum | Striped maple |
| Amelanchier alnifolia | Service-berry |
| Amelanchier arborea | Juneberry |
| Amelanchier sanguinea | Round-leaved serviceberry |
| Amelanchier spicata | Shadbush serviceberry |
| Shadbush serviceberry | Bearberry |
| Ceanothus americanus | New Jersey tea |
| Cornus rugosa | Round-leaved dogwood |
| Corylus americana | American hazelnut |
| Corylus cornuta | Beaked hazelnut |
| Diervilla lonicera | Bush honeysuckle |
| Hamamelis virginiana | Witch hazel |
| Lonicera dioica | Wild honeysuckle |
| Prunus pensylvanica | Pin cherry |
| Ribes cynosbati | Prickly gooseberry |
| Rhus aromatica | Fragrant sumac |
| Fragrant sumac | Staghorn sumac |
| Rosa blanda | Smooth wild rose |
| Rubus allegheniensis | Common blackberry |
| Salix humilis | Upland willow |
| Sambucus racemosa | Red-berried elder |
| Shepherdia canadensis | Buffalo-berry |
| Symphoricarpos albus | Snowberry |
| Viburnum acerifolium | Maple-leaved viburnum |
| Viburnum rafinesquianum | Downy arrow-wood |
| Zanthoxylum americanum | Prickly ash |
Appendix F: infill development and watershed rehabilitation plan
The development of an Infill Development or Subwatershed Rehabilitation Plan (terms used interchangeably in this appendix) is the preferred approach in addressing stormwater quality and quantity concerns associated with infill development.
A plan is particularly important for larger infill sites (> 5 ha); in municipalities where significant growth is expected from infill development; and for effective use of off-site systems (OSS) stormwater management practices because:
- a wider range of SWMPs may be applied within the infill site for larger sites and off-site systems;
- the potential impact on the receiving environment will likely be more significant; and
- the opportunity for restoring existing environmental problems within the tributary area are more feasible.
Chapter 5 outlines some options that may be considered for small infill development (< 5 ha) where anticipated infill development is not sufficient to warrant the preparation of an Infill Development/Subwatershed Rehabilitation Plan.
The intent of this appendix is to provide direction/general steps in developing an Infill Development/Subwatershed Rehabilitation Plan. Many of these steps are similar to those outlined for environmental planning studies (Chapter 2) and retrofit studies (Appendix G). The major difference from environmental planning studies is that infill developments occur in built-up areas and impacts on the receiving water may already be occurring.
Figure F.1 illustrates a hypothetical site which will be used to assist in defining the steps that need to be undertaken. This large infill site is assumed to be located within a developed area serviced by storm sewers which discharge to a small stream which is a tributary of a larger stream.
Major steps in developing an infill development/subwatershed plan
There are three major steps in developing an Infill Development/Subwatershed Plan:
- Develop Environmental Goals, Objectives and Targets
- Undertake Techniacl Studies
- Identify and Select Preferred SWMP
Step 1: develop environmental goals, objectives and targets
The environmental goals, objectives and targets may either be available from previous studies or would need to be developed as part of the Plan once the technical studies have been completed. Chapter 2 and Appendix G provide direction for developing environmental goals, objectives and targets.
Figure F.1: Hypothetical Example for Proposed Large Infill Site
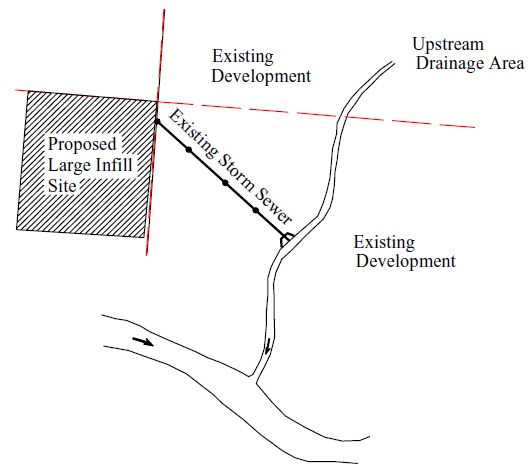
Step 2: undertake technical assessments
A variety of field/technical studies may be required in order to define existing environmental conditions; assess opportunities and constraints; and assist in identifying SWMPs which are suitable based on site conditions as well as the defined environmental goals, objectives and targets.
The general types of component studies may include:
- aquatic;
- surface water quantity and quality;
- groundwater;
- geomorphologic;
- terrestrial; and
- infrastructure.
A brief overview of key points to be considered for component studies are provided below:
Aquatic
Aquatic communities (particularly fish species) are typically used as an indicator of environmental health. Section 1.3 of this manual discusses the impact of stormwater runoff on stream ecosystems. The four factors identified (i.e., changes in hydrology, changes in urban stream morphology, changes in stream water quality and changes in stream habitat and ecology) all generally impact existing aquatic communities.
Table F.1 lists one approach for defining the hydrologic, morphologic, water quality and habitat requirements for a range of different aquatic communities. This table may be used to assist in defining aquatic objectives for the target species and defining required standards to meet an aquatic objective. The integrated set of standards that are required may, in turn, be compared to actual physical and biological conditions in order to identify the performance standard(s) which are limiting.
Other considerations such as the identification of physical barriers together with benthic invertebrate work may well be required to completely address aquatic goals and objectives.
Surface water quantity and quality
For surface water quantity there are three general conditions that need to be considered, including:
- low flows (baseflow);
- frequent flows (generally associated with erosion); and
- high (flooding) or infrequent flows.
Baseflow within the stream generally needs to be determined since lack of baseflow impacts aquatic communities and may also indirectly impact water quality conditions. Frequent flows and high flows are generally derived via a modelling exercise (see geomorphologic sub-section). For high flows, a hydrologic/hydraulic assessment may be required in order to determine the impact on downstream areas and, therefore, the requirement for flow controls for the proposed site.
The approach for undertaking water quality assessments is changing. Whereas past efforts focussed on collecting wet weather samples at a number of sites, present efforts are considering:
- replacing wet weather sampling with comprehensive water quality sampling programs with streamlined quality sampling programs together with programs focussing on biologic indicators (biomap, benthic invertebrate); and
- monitoring dry weather conditions as well as wet weather conditions as urban streams typically have short periods (1 - 3 hours out of 72 hours on average) when wet weather flows govern and contaminant levels during dry weather have been found to be higher than initially thought.
| Aquatic Performance Standard | Aquatic Ecosystem Objective | |||
|---|---|---|---|---|
| R Brook Trout | R Brook Trout, R Brown Trout | R Pike, R Darters, R Sunfish | R Longnose Dace, R Brown Bullhead, R Brook Stickleback | |
| Hydrology: baseflow | minimum 30% of average annual daily flow | minimum 10-20% of average annual daily flow | minimum 5% of average annual daily flow or sufficient to maintain isolated pools | minimum to maintain isolated pools, may be < 5% of average annual daily flow |
| Hydrology: bankfull frequency | 1-2 times per year | 1-2 times per year | as required to protect downstream aquatic communities | as required to protect downstream aquatic communities |
| Channel Morphology | dynamically stable channels with 'natural' features | dynamically stable channels with 'natural' features | dynamically stable channels with 'natural' features | dynamically stable channels with 'natural' features |
| Channel Morphology: average pool area as % of total surface area at low flow | > 12% | > 4% | > 4% | > 4% |
| Channel Morphology: average riffle area as % of total surface area at low flow | > 12% | > 10% | generally > 5% | may be < 5% |
| Channel Morphology: average minimum summer pool depth | 0.5 m | 0.3 m | 0.2 m | 0.2 m |
| Channel Morphology: bankfull width-to-depth ratio | generally < 10 | generally 5-10 | generally 5-10 | no requirement |
| In-Stream Cover |
|
|
|
|
| Substrate |
|
|
|
no requirement |
| Riparian Habitat: shaded during 1000-1400 hr | minimum 35% |
|
|
|
| Riparian Habitat: woody debris | important component of in-stream cover and roughness | important for roughness and refuge during peak flows | woody debris less important | less important |
| Water Quality: maximum annual water temperature | 22°C | 30°C | 31-35°C | 31-35°C |
| Water Quality: average annual total suspended solids (ppm) | < 20 | < 150 | < 200 | < 400 |
| Water Quality: dissolved oxygen (ppm) | > 5 | > 3-4 | > 2 | < 2 |
| Water Quality: spills | none | none | none | none |
| Barriers | remove as feasible | removal as feasible | minimize as feasible | minimize as feasible |
Furthermore, in cases where wet weather sampling is being undertaken, at least eight events are being sampled in order to reasonably define the chemical constituents over a variety of rainfall conditions (see Figure F.2).
Figure F.2: Comparison of Sample Contaminant Averages to Long-Term Contaminant Average
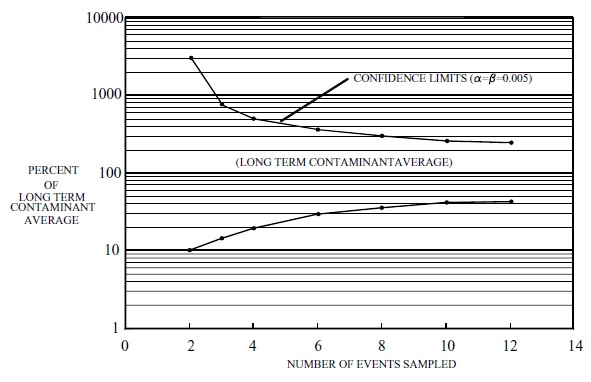
Groundwater
Key tasks to be undertaken include defining basic geologic conditions, identifying recharge/discharge areas and determining the relative importance of the site with respect to protecting groundwater supply; and determining a water budget for the proposed infill site under present and proposed conditions. With respect to the last point, the water budget assessment presented in Section 3.2 may be useful.
Geomorphologic
Section 3.4 together with Appendices B through D provide information with respect to erosion and geomorphologic assessments. Several key points that must be considered when undertaking these assessments are outlined below.
Typically, a stream will take a considerable time (25 to 60 years) to respond to land use change. Therefore, depending upon the relative timing between the proposed infill site and previous development, the stream may still be enlarging or have already enlarged to its ultimate cross-sectional shape.
Stream channels enlarge at a different rate depending upon the total basin imperviousness value. Therefore, the stream will respond to a different degree depending upon the relative size of the proposed infill site to the total catchment area and the relative level of development (or percent imperviousness) within the basin.
A majority of urban streams have been altered over time. Alteration may have taken the form of the physical relocation of a stream, construction of a roadway across the stream or modification of the connectivity between the low flow channel and the floodplain. As a result of the alterations as well as the ongoing cross-sectional changes that are occurring, urban streams typically are subject to excessive erosion rates and have lost many of the attributes that are necessary to provide habitat for sensitive aquatic species. If improving aquatic conditions, protecting public property or restoring recreational/environmental opportunities along the stream corridor are goals as set out in the study, then restoration of the stream will likely be needed.
Terrestrial
Terrestrial resource assessments typically include wetlands, woodlots, landforms and specially designated natural areas. An approach for undertaking terrestrial assessments within an existing developed area is not covered in this appendix. Assessment of the proposed infill site will be necessary to ensure that the above noted resources are protected.
Infrastructure
An assessment of the existing storm sewer system from the proposed infill site to the receiving stream may be required depending upon capacity constraints, the proposed release rate of flows from the infill site and the potential for basement flooding in areas within the sewershed. Accommodation of major system flow (Section 4.7.2) must also be accounted for.
Step 3: identify and select preferred SWMP(s)
Once the environmental goals, objectives and targets have been confirmed and the technical studies completed, the preferred SWMP can be identified and selected. Generally, a combination of practices will be required to address the overall environmental targets. Table 1.3 summarizes different SWMPs and their suitability with respect to different environmental criteria (e.g., water quality, erosion, water quantity). This table should be used in conjunction with Table 4.1 which summarizes physical criteria that need to be considered when evaluating each type of SWMP.
As discussed in Chapter 5, on-site stormwater management is generally the preferred option in addressing cumulative stormwater impacts; however, in certain situations it may be ineffective or impractical because of physical constraints. In these cases, an off-site system (OSS) SWMP may be considered at another location within the same subwatershed and could be financed through a financial contribution from the project proponent based on formulas developed by local municipalities. OSS are most effective within the context of an Infill Development/ Subwatershed Rehabilitation Plan.
Besides off-site SWMPs, municipalities may also be able to use funds for watershed management and restoration works. For example, the technical assessment may find that some stream reaches lack suitable habitat for a target aquatic community and are experiencing ongoing erosion problems as the channel continues to enlarge. Furthermore, construction of erosion control measures on site will result in no net increase in erosion potential but will not restore the degraded habitat conditions or prevent ongoing erosion from existing development.
In this case, construction of an in-stream works to improve habitat conditions and curtail ongoing erosion processes could be considered rather than the construction of on-site stormwater erosion control measures. However, before this approach can be used, there must be concurrence from the appropriate agencies and the private sector. Furthermore, all existing policies, guidelines and acts must be reviewed.
Appendix G: methodology for evaluating retrofit options/retrofit studies
G.1 Introduction
Retrofitting of existing infrastructure may be required to achieve water balance, water quantity, water quality, and erosion and flood control goals. The objective of this appendix is to outline a methodology that can be used to prepare a stormwater retrofit study which evaluates retrofit options.
The term "retrofit" is used in a general sense and includes retrofitting of:
- existing SWM practices in order to provide multiple benefits (e.g., retrofitting an existing dry pond which presently provides only a flood control function to a multi-purpose facility providing baseflow augmentation, water quality, and erosion and flood control functions);
- infrastructure along a roadway (in order to better reproduce the historical water budget or reduce water quality loadings); and
- an area (from as small as a municipal block to as large as a subwatershed) in order to achieve environmental goals and targets (e.g., reduction of in-stream phosphorus levels to meet Provincial Water Quality Objectives (PWQO)).
G.2 Background
Initially, retrofitting was geared towards water quantity and water quality issues. For example, many municipalities completed Pollution Control Plans which involved retrofitting of infrastructure to address concerns such as: basement flooding, combined sewer overflows, and parameters which exceeded PWQOs. Retrofitting to address environmental concerns, such as loss of aquatic habitat, excessive rates of erosion, diminishing baseflows or loss of natural features, is a more recent occurrence.
Early retrofit studies tended to examine entire watersheds (e.g., Don River); summarize the environmental concerns; and identify a range of SWM practices which if implemented could improve existing environmental conditions. More recently, retrofitting opportunities are being identified within subwatershed studies or environmental studies undertaken by municipalities or regions.
G.3 Methodology for evaluating retrofit options
The following methodology/steps could be used in selecting the preferred retrofit option(s):
- Define Environmental Goals, Objectives and Targets
- Identify General Types of Suitable SWM Practices based on Environmental Goals, Objectives and Targets
- Undertake Technical Assessment
- Select SWM Practices Based on Evaluation Criteria
- Develop an Implementation Plan
Step 1: define environmental goals, objectives and targets
In order to define the environmental goals, objectives and targets, an understanding of current and potential future environmental conditions is needed. This information may be available from existing studies, or may require interpretation of available information together with a field program.
Following this task, an assessment of the inter-relationships between the environmental resources needs to be made as does the factors characterizing the health of the resources (Table G.1), and the identification of key ecologic constraints and opportunities (see Chapter 2 for further details). Environmental goals, objectives and targets may then be defined.
The environmental goals, objectives and targets provide the framework for Steps 2 to 5. The goals, objectives and targets may vary from relatively straightforward to complex. For instance, a goal of reducing in-stream phosphorus concentrations by an average of 20 percent is fairly straightforward, whereas a goal of improving a degraded ecosystem with one that supports a healthy warm water fishery, provides stable flow regimes and results in minimal exceedences of PWQOs for key water quality constituents is fairly complex.
Step 2: identify general types of suitable SWM practices (qualitative screening based on environmental goals, objectives and targets)
An initial qualitative screening of potential SWM practices early in the process (prior to other assessments, e.g., technical feasibility or costs) is useful to identify SWM practices that would likely meet the environmental goals established in Step 1 as well as identifying potential conflicts.
| Environmental Resources | Flow Factor | Stream Quality/ Geomorphic Factors | Environmental Quality Parameters | Habitat Buffer Factors | |||||||||||||||
|---|---|---|---|---|---|---|---|---|---|---|---|---|---|---|---|---|---|---|---|
| Water Balance | Peak Flow | Base Flow | Width/Depth | Stream Gradient | Riparian Cover | In-Stream Cover | Bed load | TSS | Nutrients | Heavy Metals | Organics | Fecal Bacteria | Toxicity Test | Colour | Temperature | Habitat Diversity and Sensitivity | Width of Buffer | Presence of Endangered Species | |
| I. Great Lakes Ecosystem: Water Quality | X | X | X | X | X | X | X | X | X | X | X | X | X | X | |||||
| II. Rouge River Surface Water System: Flowing Water | X | X | X | ||||||||||||||||
| II. Rouge River Surface Water System: Surface Water Quality | X | X | X | X | X | X | X | X | X | X | X | X | X | X | |||||
| II. Rouge River Surface Water System: Aquatic Sediments | X | X | X | X | X | X | |||||||||||||
| II. Rouge River Surface Water System: Benthic Organisms | X | X | X | X | X | X | X | X | X | ||||||||||
| III. Public Health: Drinking Water - Ground Water | X | X | X | X | X | X | X | X | X | ||||||||||
| III. Public Health: Edible Fish | X | X | X | X | |||||||||||||||
| III. Public Health: Contract Recreation | X | X | X | X | |||||||||||||||
| IV. Ground Water: Recharge/Discharge Areas | X | X | X | X | |||||||||||||||
| IV. Ground Water: Ground Water Quality | X | X | X | X | X | X | X | X | |||||||||||
| V. Public Safety: Flooding | X | X | X | ||||||||||||||||
| V. Public Safety: Erosion | X | X | X | X | X | X | X | ||||||||||||
| VI. Aquatic Communities: Community Diversity | X | X | X | X | X | X | X | X | X | X | X | X | X | ||||||
| VI. Aquatic Communities: Habitat | X | X | X | X | X | X | X | X | X | X | X | X | X | X | |||||
| VII. Terrestrial Features: Wetlands | X | X | X | X | X | X | X | X | X | X | X | ||||||||
| VII. Terrestrial Features: Woodlots | X | X | X | X | |||||||||||||||
| VII. Terrestrial Features: Valleylands | X | X | X | X | X | X | X | ||||||||||||
| VIII. WildLife: Communities | X | X | X | X | |||||||||||||||
| VIII. WildLife: Habitats | X | X | X | X | X | X | |||||||||||||
| IX. Aesthetics | X | X | X | X | X | X | |||||||||||||
| X. Recreation | X | X | X | X | |||||||||||||||
Table G.2 could be used in an initial screening to qualitatively assess whether or not the SWM Practices/Watershed Management Practices outlined (horizontal axis) would improve a given environmental resource (environmental goals), potentially result in conflict, or would likely have a strong potential for conflict with environmental goals.
This initial screening provides indication of the potential for the various SWM Practices/ Watershed Management Practices to result in the most benefit (as indicated by a large number of potential for improvement "X") or result in conflicts (as indicated by a large number of potential conflict " F "; and strong potential for conflict "~") (see Table G.2).
This assists decision-makers in selecting a list of potential SWM practices. It does not, however, directly lead to the inclusion or exclusion of a given SWMP. This type of table format may also be a useful tool in presenting options to the public.
Step 3: undertake technical assessment
Steps 1 and 2 provide key environmental goals/objectives/targets and an initial qualitative indication as to which SWM practices are likely to be the most effective in meeting these goals. Step 3 involves undertaking a technical assessment in order to determine which SWM practices or group of SWM practices, when implemented, would assist in meeting these goals. More than one set of alternatives needs to be identified since further assessment with respect to technical feasibility, cost, etc.., is required.
The technical assessment method used will depend on the situation. For example, to retrofit a series of dry ponds in order to meet specific in-stream water quality conditions, a relatively straightforward assessment utilizing water quantity and water quality models may be used. Alternatively, if enhancement of aquatic habitat conditions together with improvements in stream stability are the objectives, then a variety of tools, including habitat, geomorphologic and water resource models, may be required.
Step 4: select SWM practices based on evaluation criteria
Step 3 generally identifies several technically feasible SWM options. For example, any combination of ponds in a series of existing dry ponds could be retrofitted in order to meet the required water quality objectives. Various combinations of source control measures, pond retrofits or stream rehabilitation could be undertaken in order to enhance aquatic habitat conditions and stabilize a stream.
Step 4 involves evaluating each of the feasible options against series of criteria and ultimately selecting the preferred option. Examples of evaluation criteria are provided in a number of documents including the Municipal Environmental Assessment which uses natural, social and economic criteria as the basis for selecting the preferred alternative. Evaluation criteria should generally consider:
- public acceptance;
- cost – capital as well as operation and maintenance;
- land requirements with respect to associated impact on present/future land uses;
- implementability of option; and
- potential for environmental improvement.
| Environmental Resources | SWM Practices/Watershed Management Practices | ||||||
|---|---|---|---|---|---|---|---|
| Storage Water Quality/ Q Pond | Infiltration Devices | Artificial Wetlands | Urban Retrofit | Riparian Buffer Creation(Valleyland Reforestation) | Aquatic Habitat Restoration | Groundwater Recharge Protection | |
| I. Great Lakes Ecosystem: Water Quality | X | X | X | ||||
| II. Rouge River Surface Water System: Flowing Water | X | X | X | ||||
| II. Rouge River Surface Water System: Surface Water Quality | X | X | X | ||||
| II. Rouge River Surface Water System: Aquatic Sediments | X | X | |||||
| II. Rouge River Surface Water System: Benthic Organisms | X | X | X | X | |||
| III. Public Health: Drinking Water - Groundwater | F | ~ | X | ||||
| III. Public Health: Edible Fish | X | X | X | ||||
| III. Public Health: Contact Recreation | |||||||
| IV. Groundwater: Recharge/Discharge Areas | X | X | X | X | |||
| IV. Groundwater: Quailty | ~ | F | X | ||||
| V. Public Safety: Flooding | X | X | X | ||||
| V. Public Safety: Erosion | X | X | X | ||||
| VI. Aquatic Communities: Diverisity | F | X | X | X | |||
| VI. Aquatic Communities: Habitat | X,~ | X | X | X | X | ||
| VII. Terrestrial Features: Wetlands | X | X | X | X | |||
| VII. Terrestrial Features: Woodlots | X | ||||||
| VII. Terrestrial Features: Valleylands | X | X | |||||
| VIII. Wildlife: Communities | X | ||||||
| VIII. Wildlife: Communities | X | ||||||
| IX. Aesthetics | X | X | X | X | X | X | |
| X. Recreation | X | X | X | ||||
- X
- Potential for Improvement
- F
- Potential Conflict
- ~
- Strong Potential for Conflict
Step 5: develop an implementation plan
Once the preferred alternative has been selected, an Implementation Plan needs to be developed. For straightforward initiatives, implementation may only require addressing funding issues and identifying the agency responsible for overseeing construction.
For more involved projects, a series of decisions may need to be made, including:
- deciding whether or not an implementation committee needs to be established and defining the committee’s role;
- defining lead and secondary agencies responsible for implementation, funding alternatives, and policy considerations for each of the proposed SWM practices;
- prioritizing proposed SWM practices – generally based on cost-effectiveness, ease of implementation, and on the provision that considerable improvement in environmental conditions be implemented first;
- defining education programs, the role of the public and stewardship opportunities; and
- defining long-term monitoring requirements to define the effectiveness of the measures to meet the environmental goals, objectives and targets.
G.4 Methodology for evaluating retrofit options – town of Markham case study
The previous sections provided general information on a five-step methodology for evaluating retrofit options. The "Town of Markham Stormwater Retrofit Study" was completed by the Toronto and Region Conservation Authority and the Town of Markham in 1999. Provided below is a summary of the Town of Markham findings using the five-step methodology to evaluate its retrofit options.
Background
The objective of the Town of Markham retrofit study was to prioritize the retrofit of eleven stormwater management ponds in terms of water quality and erosion control. The study area is located within the Town of Markham and the ponds are located within urbanizing areas between Highway 404, Highway 48, Steeles Avenue and Major MacKenzie Drive. The ponds are scattered along the upper reaches of the Rouge River and a number of tributaries, including German Mills Creek, Beaver Creek, Burndenette Creek and Robinson Creek. Table G.3 summarizes the pond number, name and type, as well as land use within the catchment area.
During the course of the study, a comprehensive screening and prioritization protocol was developed in order to assess the retrofit potential of the ponds. The protocol incorporated logistical constraints (e.g., adjacent land uses and space for enlargement), as well as the following three environmental components:
- ecological significance of the receiving stream;
- potential erosion control benefit; and
- potential water quality benefit.
The water quality and geomorphologic approaches outlined in Chapter 3 and Appendices B through D were also used to assess options.
Step 1: define environmental goals, objectives and targets
The major goal/objective of the Markham study was to determine the potential for maintaining/restoring the environmental conditions of stream tributaries by retrofitting existing ponds to address water quality and erosion concerns.
Step 2: identify general types of suitable SWM practices (qualitative screening based on environmental goals, objectives and targets)
A qualitative screening of different types of SWM practices was not undertaken because the study objective was to assess only one type of SWM practice, i.e., existing stormwater management ponds in the Town of Markham.
Step 3: undertake technical assessment
The technical assessment was geared for meeting the environmental goal/objective described in Step 1 and for providing information that could be used for Step 4. The study was undertaken at a planning level; therefore, certain technical findings needed to be assessed in greater detail. As part of the technical assessment, the following were determined:
- habitat index for the streams;
- erosion control benefit of each pond; and
- water quality benefit of each pond.
A. Habitat index (HI)
A Habitat Index was determined for each stream based on previous field work studies. HI values range from one (low sensitivity) to five (high sensitivity). Stormwater ponds flowing to a stream highly sensitive to environmental impacts were considered to be a higher retrofit priority than ponds flowing to a stream with a lower sensitivity.
B. Erosion control benefit of each pond
The erosion control benefit of each pond was estimated by initially comparing the ratio of existing channel cross-sectional area (Re)i to the ultimate channel cross-sectional area (Re)ULT. An assessment was then carried out in order to determine the feasibility of providing storage and rate control within the existing pond. Ultimately, the erosion control benefit would be based on a combination of the difference between the existing channel cross-sectional area (Re)i, the ultimate channel cross-sectional area (Re)ULT and the channel cross-sectional area (Re)CONT using the optimal storage and rate control.
C. Potential water quality benefit of retrofitting each pond
Water quality control criteria selected was the Level 1 target [Editor’s Note: now referred to as enhanced protection level]. A Level 1 target was selected because of the sensitivity of the receiving waters (the Rouge River and associated tributaries). Table 3.1 was then used to determine the required water quality storage volumes.
Step 4: select SWM practices based on evaluation criteria
The eleven stormwater management ponds were initially evaluated against five technical criteria. Different priority values (weights) were given to each criteria.
- Habitat index: Higher habitat index value indicated a more sensitive stream and resulted in a higher priority for retrofitting the pond.
- Ratio of catchment area draining to the pond (PCDA) and total catchment drainage area (CDA): Ponds with a high PCDA:CDA ratio were considered to be higher in priority for retrofit than those with a lower ratio since stormwater ponds that treat a higher percentage of the total catchment drainage area (CDA) are considered to have greater potential for protecting/restoring downstream erosion and water quality problems.
- Ultimate stream area enlargement ratio: Stormwater management ponds which drain to a receiver with a relatively high ultimate enlargement ratio were considered to be higher in priority for retrofit than ponds which discharge to a stream with a small ultimate enlargement ratio.
- Ratio of existing channel cross-sectional area to the ultimate channel cross-sectional area: Stormwater ponds which drain to a receiving channel which has not yet reached an advanced stage of enlargement were considered to be higher in priority for retrofit than ponds which discharge to streams which have already undergone relatively significant enlargement.
- Ratio of existing channel cross-sectional area to the ultimate channel cross-sectional area: Stormwater ponds which drain to a receiving channel which has not yet reached an advanced stage of enlargement were considered to be higher in priority for retrofit than ponds which discharge to streams which have already undergone relatively significant enlargement.
| Pond No. | Pond Name | Pond Type | Land Use (CDA)* | Land Use (PCDA)** |
|---|---|---|---|---|
| 11.0 | SE Quadrant Brown’s Corner | On-Line/Dry Pond |
|
|
| 12.0 | Markville Pond | Off-Line/Wet Pond |
|
|
| 80.0 | Leitchcroft Farm Pond 2 | Off-Line/Dry Pond |
|
100% Industrial |
| 82.0 | Beaver Creek Pond 1 | On-Line/Dry Pond |
|
n/a |
| 82.1 | Beaver Creek Pond 3 | Off-Line/Dry Pond |
|
100% Industrial |
| 87.0 | Hagerman Estates Subdivision | Off-Line/Dry Pond |
|
100% Residential |
| 88.0 | Bridle Trail Phase 3 | Off-Line/Dry Pond |
|
100% Residential |
| 88.1 | Bridle Trail Phase 4 | Off-Line/Dry Pond |
|
|
| 88.2 | Bridle Trail Phase 5 | Off-Line/Dry Pond |
|
|
| 90.0 | Raymerville Community | On-Line/Dry Pond |
|
100% Residential |
| 98.0 | Unionville B-3 Subdivision | Off-Line/Wet Pond |
|
|
* CDA = total catchment drainage area
** PCDA = pond catchment drainage area
Table G.4 summarizes the findings of the evaluation for each pond.
Subsequent evaluations focussed on the feasibility of retrofitting each pond, including the ability to expand storage volume, adjacent land uses, safety, access, etc..
| Pond No. | Pond Name | HI | PCDA/CDA | (Re) | 1 − {(Re)1 ÷ (Re)ult} | SO | Total Weighted Score | Priority | |||||
|---|---|---|---|---|---|---|---|---|---|---|---|---|---|
| NPV | Rank | NPV | Rank | NPV | Rank | NPV | Rank | NPV | Rank | ||||
| 11.0 | SE Quadrant Brown’s Corner | 0.40 | 7.5 | 0.25 | 6 | 0.05 | 5 | 0.25 | 8 | 0.05 | 8.5 | 7.18 | 8 |
| 12.0 | Waldon Pond (Markville) | 0.40 | 5.5 | 0.25 | 10 | 0.05 | 8 | 0.25 | 5 | 0.05 | 10.5 | 6.88 | 7 |
| 80.0 | Leitchcroft Farm Pond 2 | 0.40 | 10 | 0.25 | 2 | 0.05 | 2 | 0.25 | 2.5 | 0.05 | 4 | 5.43 | 4 |
| 82.0 | Beaver Creek Pond 1 | 0.40 | 10 | 0.25 | 1 | 0.05 | 3 | 0.25 | 7 | 0.05 | 4 | 6.35 | 6 |
| 82.1 | Beaver Creek Pond 3 | 0.40 | 7.5 | 0.25 | 9 | 0.05 | 4 | 0.25 | 9 | 0.05 | 4 | 7.90 | 11 |
| 87.0 | Hagerman Estates Subdivision | 0.40 | 10 | 0.25 | 4 | 0.05 | 1 | 0.25 | 10 | 0.05 | 4 | 7.75 | 10 |
| 88.0 | Bridle Trail Phase 3 | 0.40 | 2.5 | 0.25 | 8 | 0.05 | 10 | 0.25 | 2.5 | 0.05 | 4 | 4.33 | 3 |
| 88.1 | Bridle Trail Phase 4 | 0.40 | 2.5 | 0.25 | 7 | 0.05 | 6 | 0.25 | 2.5 | 0.05 | 4 | 3.88 | 2 |
| 88.2 | Bridle Trail Phase 5 | 0.40 | 2.5 | 0.25 | 3 | 0.05 | 7 | 0.25 | 2.5 | 0.05 | 4 | 2.93 | 1 |
| 90.0 | Raymerville Community | 0.40 | 2.5 | 0.25 | 5 | 0.05 | 11 | 0.25 | 11 | 0.05 | 8.5 | 5.98 | 5 |
| 98.0 | Unionville B-3 Subdivision | 0.40 | 5.5 | 0.25 | 11 | 0.05 | 9 | 0.25 | 6 | 0.05 | 10.5 | 7.43 | 9 |
- NPV
- Normalized Priority Value
- HI
- Habitat Index
- PCDA
- Catchment Drainage Area draining to pond
- CDA
- total Catchment Drainage Area
- (Re)ult
- Ulitmate Stream Area Enlargement Ratio
- (Re)i
- Existing Stream Area Enlargement Ratio
- SO
- Stream Order
- Rank and Priority Scale
- 11 (low priority) to 1 (high priority)
Step 5: develop an implementation plan
Implementation of the selected preferred option is the final step in the evaluation methodology but was not included in the Markham retrofit study. Implementation will involve prioritizing the eleven stormwater management ponds based on further technical evaluation criteria, feasibility, cost and other factors.
Figure G.1: Location of Stormwater Management Ponds within Study Area – Markham, Ontario
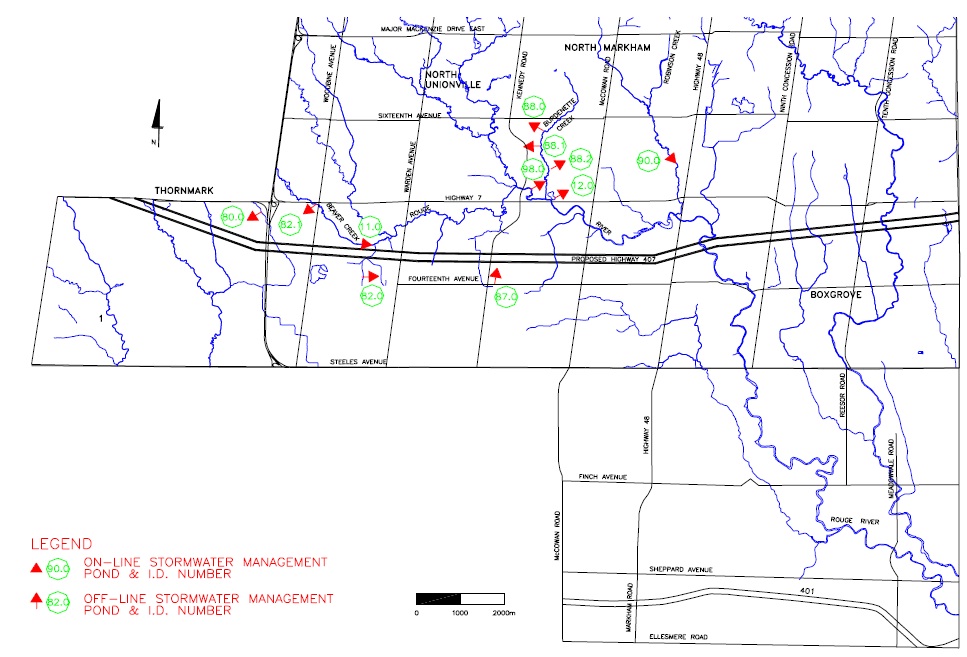
Source: The Toronto and Region Conservation Authority and the Town of Markham, Town of Markham Stormwater Retrofit Study, 1999.
Appendix H: SWMP sample
Note: The examples are based on the Stormwater Management Practices Planning and Design Manual (1994).
H.1 Case I: development is governed by a subwatershed plan
The proposed development is within an area which has a subwatershed plan with the following stormwater management criteria:
- quantity control to reduce the 1 in 5 year post-development peak flow to pre-development levels;
- quality control to detain the runoff volume from a 25 mm rainfall event for 24 hours;
- erosion control equivalent to 100 m³/ha to be detained for 24 hours; and
- baseflow maintenance of 10 mm/ha based on soils with a percolation rate of 70 mm/h.
The proposed development site is 4.5 ha and will consist of 100 townhouses with a total imperviousness of 63%. The soils in the area have an average percolation rate of 50 mm/h.
Based on the subwatershed plan, the total developed area will require 450 m³ for erosion control (storage for 24 hours). Using OTTHYMO (Wisner and P'ng, 1983), the runoff volume was modelled for the total site for a 4 hour 25 mm rainfall event, and it was determined that approximately 566 m³ is required for water quality control. Therefore, stormwater management controls are required to detain 566 m³ for 24 hours to address water quality and erosion control criteria.
H.1.1 Lot level controls
Reduced lot grading
Based on the soils and the type of development, the lot grades will be reduced from 2% to 0.5%. Since the land is naturally flat, reduced lot grading will be feasible. The lots will be graded at 2% within 4 m of the building and at 0.5% for the remainder of the lot.
Equation 4.13: Adjusted Pervious Depression Storage
DSP = 4.67 + (2 − G)f
where:
- G
- 0.5% (lot grading)
- f
- 0.75 (longevity factor)
Using Equation 4.13, the pervious depression storage (DSP) was adjusted based on the longevity factor. The adjusted DSP used in the model was 5.8 mm to account for the reduced lot grading.
Roof leader discharge to soakaway pits
Since residential rooftop drainage is considered "clean water," the roof leaders from the buildings will be discharged to rear yard soakaway pits. The trenches will be located approximately 4 m away from the buildings and approximately 1.5 m above the seasonally high water table. They will be filled with 50 mm diameter clear stone and each trench will be lined with non-woven filter cloth to prevent clogging of the stone. The appropriate bottom area of each trench was calculated using Equation 4.3. Each soakaway pit will serve four townhouse units; therefore, each trench will need to be able to store a maximum volume of 20 mm over the rooftop area of four units (approximately 400 m²). For the 100 units, there will be a total of 25 trenches.
Equation 4.3: Infiltration Trench Bottom Area
A = (1,000V) ÷ (PnΔt)
where:
- V
- 8 m³(runoff volume to be infiltrated: 20 mm × 400m² rooftop area for four units)
- P
- 50 mm/h(percolation rate of surroundign native soil)
- n
- 0.4(porosity for clear stone)
- Δt
- 24h(retention time)
In order to infiltrate this amount of water, the trench bottom area (A) needs to be at least 16.7 m². Based on the lot configuration and open space areas, soakaway pits which are 2 m wide and 8.5 m long can be constructed. For the storage volume of 8 m³, the pit needs to be 1.2 m deep.
Based on Equation 4.2, the maximum allowable soakaway pit depth is 1.2 m deep.
Equation 4.2
Maximum Allowable Soakaway Pit depth = PT
where:
- P
- 50 mm/h (minimum percolationrate)
- T
- 24h(drawdown time)
The required pit depth of 1.2 m (for 8 m³ storage volume) is within the range of maximum allowable soakaway pit depth (Equation 4.2).
Equation 4.17 was used to calculate a rating curve for input to the model based on the storage and outflow for all the soakaway pits:
Equation 4.17: Soakaway Pit Rating Curve
Q = f × (P ÷ 3,600,000) × (2LD + 2WD + LW) ×n
V = LWD × n × f
where:
- f
- 0.75 (longevity factor)
- P
- 50 mm/h (native soil percolation rate)
- L
- 212.5 m (total length of the soakaway pits)
- D
- 1.2 m (depth of water in the soakaway pit)
- W
- 2 m (width of each soakaway pit)
- n
- 0.4 (void space in the soakaway pit clear stone)
Therefore, for a volume of 153 m³, the discharge will be 0.004 m³/s. This rating curve was modelled using OTTHYMO and the ROUTE RESERVOIR command for a 4 hour 25 mm storm to assess the contribution of the soakaway pit storage in the determination of end-of-pipe water quality storage requirements. Overflows from the trench storage were added to the runoff from the rest of the site.
H.1.2 Conveyance controls
Pervious pipe systems
The townhouse development will be serviced with traditional curb and gutters. Groundwater contamination is not an issue for this development since a shallow aquifer feeds the stream and the road is local and will not be salted or sanded. Therefore, pervious pipes will be used with regular storm sewers for overflows. The municipality’s standards allow pervious storm sewer systems. Grassed boulevards will be used as pre-treatment for the stormwater runoff. A total length of 260 m (130 m on each side of the roads) of perforated pipe with fifty 12.7 mm diameter perforations per metre will be used. The 200 mm diameter perforated pipe will be set at 0.5% slope to promote exfiltration. Clear stone (50 mm) will be used for pipe bedding. The bedding will be surrounded with non-woven filter fabric to prevent the native soil from clogging the voids. The maximum depth will be 1.2 m as calculated previously using Equation 4.1. A typical pervious pipe design is shown in Figure 4.11 (Chapter 4).
Based on the following equation, a rating curve was estimated for the perforated pipe exfiltration flow as a percentage of the pipe flow.
Equation 4.18: Exfiltration Discharge
Qexf = (15A − 0.06S + 0.33)Qinf
where:
- Qexf
- Exfiltration flow through pipe perforations(see Table H.1)
- A
- 0.006m²/m(area of perforations/m length of pipe)
- S
- 0.5%(slope of pipe)
- Qinf
- flow in pipe(see Table H.1)
- f
- 1.0(longevity factor)
| Depth of water in pipe (m) | Flow in Pipe (m³/s) | Exfiltration Flow (m³/s) |
|---|---|---|
| 0 | 0 | 0 |
| 0.025 | 0.001 | 0.0004 |
| 0.05 | 0.003 | 0.001 |
| 0.075 | 0.0065 | 0.003 |
| 0.1 | 0.012 | 0.005 |
| 0.125 | 0.0165 | 0.007 |
| 0.15 | 0.021 | 0.008 |
| 0.175 | 0.022 | 0.009 |
| 0.2 | 0.023 | 0.009 |
The following equation was used to determine the amount of storage volume available within the clear stone pipe bedding.
V = LWD × n × f
where:
- L
- 260 m(length of pervious pipe and stone)
- W
- 3.0 m(width of stone)
- D
- 1.2 m(depth of stone)
- n
- 0.4(void space for clear stone)
- f
- 0.75(longevity factor based on native soil)
Therefore, the actual available volume (V) within the storage media is 281 m³. The COMPUTE DUHYD command in OTTHYMO was used to divert the peak exfiltration flow to the pipe bedding. The exfiltrated flow was routed through the storage volume using the ROUTE RESERVOIR command.
The outflow from the pipe bedding (soakaway pit rating curve) was calculated based on Equation 4.17.
Equation 4.17: Soakaway Pit Rating Curve
Q = f × (P ÷ 3,600,000) × (2LD + 2WD + LW) × n
where:
- f
- 0.75 (longevity factor)
- P
- 50 mm/h (native soil percolation rate)
- L
- 260 m (total length of the soakaway pits)
- D
- 1.2 m (depth of water in the soakaway pit)
- W
- 3.0 m (width of each soakaway pit)
- n
- 0.4 (void space in the soakaway pit clear stone)
The outflow from the pipe bedding is 0.006 m³/s. All overflows were separated from the exfiltrated flows once the pipe bedding storage was exceeded. The overflows were conveyed to the regular storm sewer and used to determine end-of-pipe stormwater management requirements.
Based on the OTTHYMO output, the entire pipe bedding storage is not required. Therefore, as a cost-saving measure, the storage volume was reduced to 140 m³ (width was reduced to 1.5 m and the corresponding outflow was 0.004 m³/s). Note: An alternative approach would have been to increase the number of perforations and hence, the exfiltration in the perforated pipe.
H.1.3 End-of-pipe SWMPs
Quality control
According to the runoff volume reported in the OTTHYMO modelling, the required end-of-pipe storage is 275 m³. The contributing drainage area and runoff volume are too small for the design of a wet pond or wetland. Therefore, a sand filter is recommended to provide the remaining water quality control. Based on the area available for the sand filter, Equation 4.20 was used to calculate the outflow from the sand filter.
Equation 4.20: Sand Filter Discharge
Q = f × (P / 3,600,000) × (LW × n)
- f
- 1.0 (longevity factor based on the percolation rate for sand)
- P
- 210 mm/h (percolation rate for sand)
- L
- 32 m (length of the filter)
- W
- 8 m (width of the filter)
- n
- 0.25 (void space in the sand filter)
Therefore, the outflow from the filter will be 0.004 m³/s. The storage available within the sand filter is 32 m³. Storage to a depth of 1.0 m above the sand filter will be used to provide 256 m³ of active storage. The ROUTE RESERVOIR command was used to model the storage and outflow rating curve. To provide control of the 1 in 5 year post-development peak flow, a dry pond is recommended which will receive 1 in 5 year flows from the storm sewers. The pond will provide 520 m³ of storage at approximately 1.0 m depth. The outlet was sized to control the 1 in 5 year post- development peak flow to the pre-development flow.
H.1.4 Baseflow
The reported percolation rate of the soil is actually 50 mm/ha. Therefore, using Equation H.1, the actual infiltration target is 7 mm/ha.
Equation H.1: Site-Specific Infiltration Adjustment
I = V (Psite ÷ PSWP)
where:
- V
- 10 mm/ha (target volume of infiltration from subwatershed plan based on a specific storm event)
- Psite
- 50 mm/h (percolation rate of site-specific soils)
- PSWP
- 70 mm/h (percolation rate of soils used in subwatershed plan)
Based on the infiltration measures recommended for this site, the total amount of recharge is 14.73 mm/ha which is greater than the required 7 mm/ha to meet the adjusted infiltration target.
H.1.5 Summary of case I
Based on the stormwater management criteria outlined in the subwatershed plan for this site, quantity control, quality control, erosion control and baseflow maintenance are required. The following stormwater management design will meet each of these criteria.
- the 1 in 5 year post-development peak flow will be controlled with a dry pond approximately 520 m³ in volume;
- the reduced lot level grading and soakaway pits will reduce the required water quality storage by storing 15 mm (based on the longevity factor) of runoff from the roof area (approximately 150 m³);
- the pervious pipe system will further reduce the water quality storage by providing storage in the pipe bedding (approximately 140 m³);
- the sand filter will provide the remaining water quality storage (approximately 275 m³);
- the stormwater management controls will double the required baseflow contribution (approximately 14 mm/ha); and
- the measures designed for water quality control will also provide erosion control benefits.
H.2 Case II: no subwatershed plan governs development
In the absence of watershed/subwatershed planning, Chapter 3 of the SWMP manual was used to provide guidance on the design of stormwater management controls for a 50 ha subdivision. The proposed level of imperviousness for the site is 55%. The entire development will consist of 950 single detached housing units on typical 12 m × 30 m lots. Since there are no flood damage sites downstream of the site, and the site is located at the downstream end of the watershed, the site does not require flood control. The level of protection for aquatic habitat for the receiving water course is normal protection.
H.2.1 Lot level controls
Based on the soils, the potential for use of lot level controls is low. The soils have a percolation rate of 20 mm/h, and within this municipality, flat lot grading (< 2%) is not permitted. Also, the potential for contamination of the groundwater is a concern. Therefore, the only lot level control recommended for this site is soakaway pits for rooftop drainage.
Roof leader discharge to soakaway pits
Since rooftop drainage is considered "clean water," the roof leaders from the buildings will be discharged to rear yard soakaway pits. The trenches will be located approximately 4 m away from the buildings and approximately 1.5 m above the seasonally high water table. They will be filled with 50 mm diameter clear stone. Each trench will be lined with non-woven filter cloth to prevent clogging of the stone.
According to Table 4.11, the water quality storage requirements for the site should be reduced based on the use of soakaway pits. The appropriate bottom area of each trench was calculated using Equation 4.3. Each rooftop is approximately 102 m². Equation 4.3 was used to calculate the bottom area required to store the maximum volume of 20 mm over the rooftop area.
Equation 4.3: Infiltration Trench Bottom Area
A = (1,000V ÷ PnΔt)
where:
- V
- 2.04 m³ (runoff volume to be infiltrated for 1 lot)
- P
- 20 mm/h (percolation rate of surrounding native soil)
- n
- 0.4 (porosity for clear stone)
- Δt
- 24h(retention time)
Therefore, the bottom area of each trench would have to be 10.6 m². An area of 5.4 m² can be accommodated on each lot (1.2 m wide and 4.5 m long). Based on Equation 4.2, the maximum allowable soakaway pit depth is as follows:
Equation 4.2
Maximum Allowable Soakaway Pit depth = PT
where:
- P
- 20 mm/h(minimum percolation rate)
- T
- 24h(drawdown time)
The maximum soakaway pit depth is 0.5 m. Based on the maximum depth and bottom area which can be accommodated, 10 mm of roof drainage can be accommodated in the soakaway pits.
A total of 1,026 m³ storage will be provided in soakaway pits for the subdivision (950 lots).
H.2.2 Conveyance controls
Traditional curb and gutters will service this development. Based on the infiltration rates of the soils on this site and the potential for groundwater contamination, pervious pipes are not recommended.
H.2.3 End-of-pipe SWMPs
A wet pond was chosen as the end-of-pipe stormwater management facility for this subdivision. According to Table 3.2, the design of a wet pond will require 110 m³/ha of storage which corresponds to the following storage volumes for 50 ha: 3,500 m³ for permanent pool and 2,000 m³ for extended detention storage. The wet pond will be located outside of the floodplain and will have a length-to-width ratio of 4:1. The permanent pool will be 2 m deep, and the extended detention storage will be approximately 1.25 m deep.
Storage requirements
Equation 4.16 determines the reduction in the required end-of-pipe water quality storage volume (active storage) as given by Table 3.2, based on the use of soakaway pits for rooftop drainage.
Equation 4.16: Water Quality Storage Volume Required
V = [(A − RS) × S] + [(RS × S ) − (SPV × f)]
where:
- V
- volume of water quality storage requried (m³)
- A
- 50ha(total area of site)
- RS
- 9.69 ha (total roof area for all 950 lots)
- S
- 110 m³/ha (water quality storage requirement from Table 3.2)
- f
- 0.5 (longevity factor)
and SPV = LWD × n (Volume of soakaway pit storage)
where:
- L
- 4,275 m (length of all soakawaypits)
- W
- 1.2 m (width of each soakawaypit)
- D
- 0.5 m (depth of each soakawaypit)
- n
- 0.4(void space in the soakaway pit clear stone)
Therefore, the required end-of-pipe active water quality storage volume is reduced from 2,000 m³ to 1,487 m³.
Temperature
Since the receiving water course is sensitive to temperature changes, Equation H.2 was used to calculate the temperature change in the stream. Equation H.3 was used to calculate the average urban runoff temperature.
Equation H.2: Temperature Mass Balance
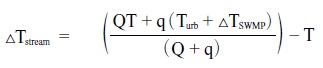
where:
- Q
- 0.233 m³/s (average monthly summer daily maximum flow rate in the stream)
- T
- 20°C (average monthly summer temperature in the stream)
- Turb
- 20.2(average urban runoff summer temperature)
- q
- 0.03 m³/s(average flow from SWMP during a 15 mm storm event)
- ΔTSWMP
- 5.1°C(average increase in temperature by SWMP type (Table 4.3))
Equation H.3: Urban Runoff Temperature
Turb = 15.8 + 0.08(55)
Therefore, the change in stream temperature (ΔTstream) is 0.60°C.
Erosion
There are a variety of methods that designers can use to determine appropriate erosion control requirements including the Simplified Design Approach and the Detailed Design Approach (see Chapter 3 – Environmental Design Criteria and Appendices B, C and D).
A subwatershed study was not performed for this site. The following example outlines a method that has been used by the Toronto and Region Conservation Authority (TRCA) and assumes that required erosion control would be 24 hour detention for a 25 mm rainfall event.
The required volume is 6,875 m³ which is greater than the 1,487 m³ required for water quality control (Table 3.2). The required volume for the pond will be decreased by the soakaway pit volume for a total required volume of 6,362 m³ (6,875 m³ - 513 m³ provided by the soakaway pits).
The soils in the area are clayey silts and silty clays. Therefore, the critical velocity for a 0.01 mm size of particle is approximately 45 cm/s or 0.45 m/s. OTTHYMO was then used to model the erosion control volume to determine if the critical velocity is surpassed in the downstream channel. The uncontrolled post-development flows exceed the critical velocity resulting in an index value of 625.25 based on Equation H.4.
Equation H.4: Erosion Index
Ei = Σ(Vt − Vc)Δt
where:
- Ei
- Erosion index
- Vt
- 1.18m/s (Velocity in the channel at time t = 1.5 h (> Vc))
- 0.72m/s (Velocity in the channel at time t = 1.667 h (> Vc))
- 0.49m/s (Velocity in the channel at time t = 1.834 h (> Vc))
- Vc
- 0.45m/s (critical velocty above which erosion will occur)
- Δt
- 601.2s (timestep(0.167h))
Flows under pre-development and controlled post-development conditions do not exceed the critical velocity. Therefore, the 25 mm control is adequate for this site.
Drawdown time
The drawdown time in the pond can be estimated using Equation 4.10.
Equation 4.10: Drawdown Time
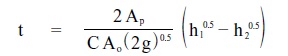
or if a relationship between Ap and h is known (i.e., A = C2h + C3)
Equation 4.11
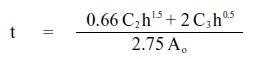
where:
- Ap
- varies (surface area of the pond)
- C
- 0.62(discharge coefficient)
- A0
- 0.04m² (cross-sectional area of the orifice for 226 mm diameter)
- g
- 9.81m/s² (gravitational acceleration constant)
- h1
- varies (starting water elevation above the orifice)
- h2
- varies (ending water elevation above the orifice)
- C2
- 4371 (slope coefficient from the area-depth linear regression)
- h
- 1.09 m(maximum water elevation above the centre-line of orifice)
- C3
- 3220(intercept from the area-depth linear regression)
The linear regression was based on the area versus depth (y) listed. For:
- Ap = 3,136m², h1 = 0 m
- Ap = 3,969m², h1 = 0.14 m (0.25 - 0.113)
- Ap = 4,900m², h1 = 0.39 m (0.5 - 0.11)
- Ap = 5,929m², h1 = 0.64 m (0.75 - 0.11)
- Ap = 7,056m², h1 = 0.89 m (1 - 0.11)
- Ap = 8,036m², h1 = 1.09 mm (1.2 - 0.11)
Ap = 4,371h + 3,220
(from Equation 4.10)
(3,282 + 6,724) ÷ (2.75t)
t = 3,639 ÷ Ao
Therefore, the drawdown time in the pond is equal to 89,752 s or 24.9 hours.
Forebay length
The forebay size depends on several calculations.
1. Settling calculations
The first step is to determine the distance to settle out a certain size of sediment in the forebay. The settling velocities for different sized particles can be estimated from the stormwater particle size distribution monitoring data by the U.S. EPA. Equation 4.5 defines the appropriate forebay length for a given settling velocity.
Equation 4.5: Forebay Settling Length
where:
- r
- 2:1(length-to-width ratio of forebay)
- Qp
- 0.1 m³/s (peak flow rate from the pond during design quality storm)
- Vs
- 0.0003m/s(settling velocity for 0.15 mm diameter particles)
Therefore, the forebay should be 26 m long to settle particles approximately 0.15 mm diameter in size.
2. Dispersion length
Equation 4.6 provides a simple guideline for the length of dispersion required to dissipate flows from the inlet pipe. It is recommended that the forebay length is such that a fluid jet will disperse to a velocity s 0.5 metre/second at the forebay berm. The fluid jet should be based on the capacity of the inflow pipe (if the pipe is s 10 year pipe). In this subdivision, the pipe will be designed to convey the 5 year storm flows. A flow splitter will not be implemented.
Equation 4.6: Dispersion Length
Dist = 8Q ÷ dVf
where:
- Q
- 5.1 m³/s (inlet flow rate)
- d
- 2 m (depth of the permanent pool in the forebay)
- Vr
- 0.5m/s (desired velocity in the forebay)
Therefore, the forebay length should be 40.8 m for the peak flow during a 5 year storm.
A guideline for the minimum bottom width of this deep zone is given by:
Equation 4.7: Minimum Forebay Bottom Width
Width = Dist ÷ 8
Therefore, the forebay deep zone should be at least 5.1 m wide.
Therefore, the forebay will be 45 m long and 20 m wide (based on an approximate 2:1 length-to- width ratio). The velocity of the flow as it moves through the forebay will be as follows:
Velocity = Q ÷ A
where:
- Q
- 5.1 m³/s
- A
- 22m²(cross-sectional area)
Therefore, the average velocity through the forebay will be 0.23 m/s. This velocity is acceptable since it is less than the 0.45 m/s permissible velocity to prevent erosion, as noted previously. Given the results of Equations 4.5 and 4.6, the forebay length will be 45 m long and 20 m wide. The permanent pool volume of the forebay will be approximately 900 m³.
3. Clean-out frequency
Based on Table 7.3, the annual sediment loading for this site will be approximately 2,300 kg/ha or 1.9 m³/ha. Therefore, based on the volume of the forebay (900 m³) and a pond removal efficiency of 70% (Level 2 protection [Editor’s Note: now referred to as normal level of protection]), the forebay will be required to be cleaned out every 13.5 years. This is acceptable to the municipality since it is greater than its 0 year minimum cleanout frequency.
Forebay berm
The forebay will be separated from the rest of the pond by an earthen berm. The berm will be submerged slightly below the permanent pool. Low flow pipes will be installed in the berm to convey low flows from the forebay to the pond. The conveyance pipes will be installed in the berm at 0.6 m above the bottom of the forebay. A maintenance pipe will also be installed in the berm to drawdown the forebay for maintenance purposes.
H.2.4 Summary of case II
According to Table 3.1, a wet pond for this site will require 3,500 m³ for a permanent pool and 2,000 m³ for active storage to provide water quality control. For erosion control, the required volume is 6,875 m³ based on the 25 mm rainfall event. The following SWMPs have been designed to meet these criteria:
- Soakaway pits will accommodate 10 mm of runoff from the roof area which will reduce the required end-of-pipe active storage requirements by 513 m³; and
- A wet pond will provide the end-of-pipe stormwater management (water quality and erosion) control. The pond will provide 3,500 m³ of permanent pool storage and 6,362 m³ of active storage.
Appendix I: stormwater management practices – design examples
Note: Examples showcase real world projects that were developed in the 1990's and are based on the 1994 Manual. The 2003 Manual has updated many concepts. Therefore, designers must refer to the 2003 Manual to ensure that future projects are designed in accordance with current standards.
I.1 Introduction
Users of the Stormwater Management Practices Planning and Design Manual (1994) indicated that design examples would be useful to show the level of detail required in stormwater design submissions and supporting documents for applications to approval agencies. The examples provided in this Appendix are typical of submissions made in the 1990's in various Ontario municipalities. The following points should be noted when reviewing the design examples:
- While the majority of the requirements are similar across different geographical locations, there may be standards specific to individual municipalities and districts. Designers should obtain specific municipal and other approval agency guidelines in order to incorporate these requirements into their design and obtain the necessary approvals.
- The Stormwater Planning and Design Manual promotes an integrated planning and design process based on the "treatment train" approach to the control of stormwater (lot level controls, conveyance controls, and end-of-pipe stormwater management facilities). Lot level controls (e.g., flatter grading of rear yards to promote infiltration) are generally incorporated in the overall grading design for the development. Generally, there are no specific drawings or details submitted for approval beyond the usual detailed grading plans. This is not to downplay the importance of lot level controls, but simply reflects the way in which they are normally incorporated in the stormwater management design.
- The SWMP facility should be designed so that it is an integrated component of the area serviced. For example, overland flow routes must be carefully designed to ensure that flows reach end-of-pipe facilities that provide major system flood control. Similarly, the effect of peak water levels in an end-of-pipe facility on the hydraulic grade line in the storm sewers must be carefully considered to avoid surcharging and possible basement flooding problems.
- At the detailed design stage, drawings for stormwater management facilities are frequently submitted for approval as part of an overall subdivision design package including: grading plans, drainage plans, detailed plans and profiles of storm and sanitary sewers, water mains, other utilities, road profiles, etc.. This appendix does not contain examples of all these drawings. Also, in order to avoid duplication, only selected items from the complete design package have been included to illustrate a specific type of SWMP. A complete submission in such cases would be more extensive than shown.
I.2 Design example 1 – end-of-pipe extended detention facility (quantity and quality control)
A two-cell facility which separates water quality and erosion control from quantity control will be discussed in this example. However, single-cell facilities for all types of control are more commonly used. Single-cell ponds are similar to Design Example 2 (see Section I.3) with quantity control storage being provided above the erosion control storage level.
The facility is located within a new primarily single-family residential community and provides quantity and quality control for 66 hectares of storm runoff (Figure I.1). The quality control cell was designed as an artificial wetland, and the quantity control cell was designed as a dry detention area to receive flows only when the quality pond filled.
The "Stormwater Servicing Plan" (SSP) (essentially a simplified subwatershed plan) design criteria for the facility were developed in consultation with the Town, the Conservation Authority and the District Office of the Ministry of Natural Resources. Approval was obtained from the Ministry of the Environment through the delegated authority of the Region.
The SSP design criteria were:
Flood control
Post-development peak flows to be controlled to pre-development levels for the lands draining to the facility for 2 to 100 year design storm events. In addition, supplementary flood control storage was incorporated to ensure peak flows further downstream in the subwatershed remained at pre-development levels.
Erosion control
Twenty-four hour detention for the runoff from a 40 mm storm was incorporated.
Water quality
Storage was based on the 1994 SWMP Manual requirements for Level 1 protection [Editor’s Note: now referred to as enhanced protection] including 40 m³/ha of active storage. This active storage was in addition to that provided for flood and erosion control.
The following design drawings were included and are illustrated in this chapter:
- Plan view (Figure I.1) at a scale of 1:500 (reduced copy of the plan – Figure I.2);
- Example of detail sheet showing the design of inlet and outlet structures (Figure I.3); and
- Two detailed planting plans at a scale of 1:500 showing the design of the artificial wetland and plantings around the border of the facility (Figures I.4 and I.5, respectively).
These drawings were accompanied by a "Stormwater Management Report" for the community which updated information contained in the "Stormwater Servicing Plan" and included a description of the functional design of the facility referred to as the South Pond. It is somewhat more extensive than a design brief which would typically accompany the design drawings. A more typical example is included in association with Design Example 2 (Section I.3).
Figure I.1: Plan View
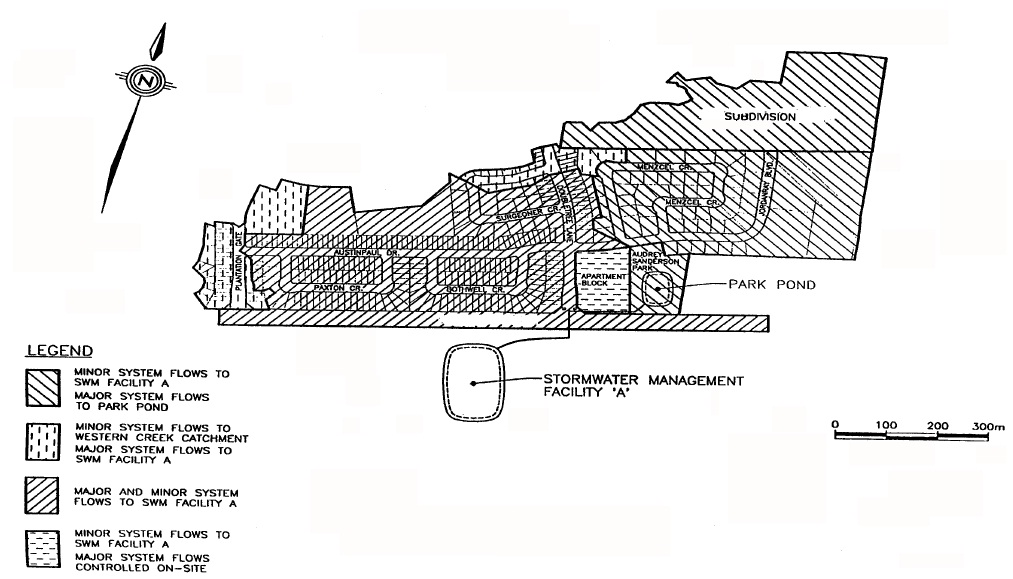
Figure I.2: Plan View (reduced copy)
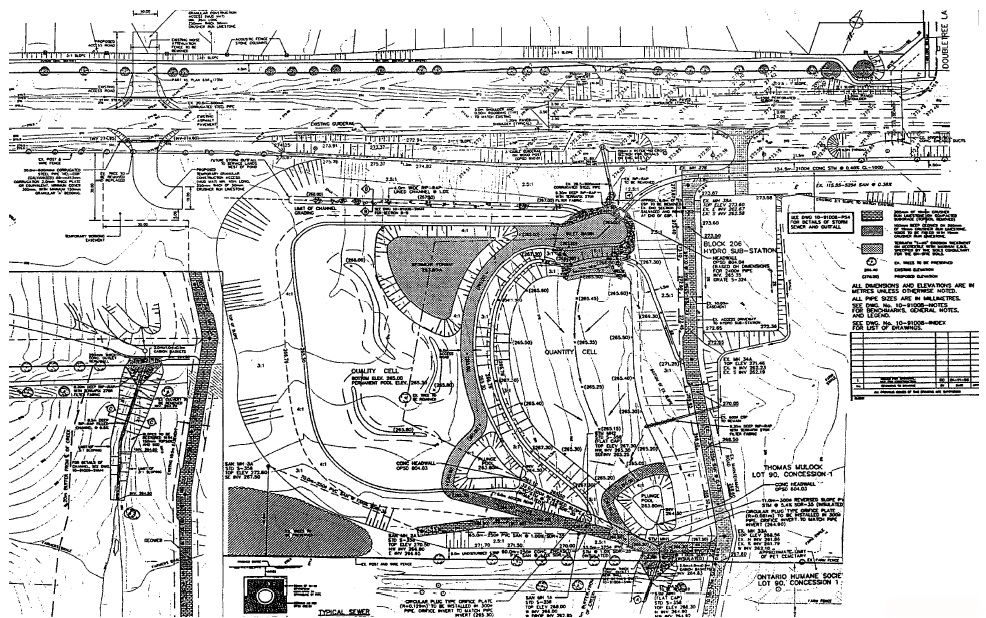
Figure I.3: Detail Sheet showing the Design of Inlet and Outlet Structures
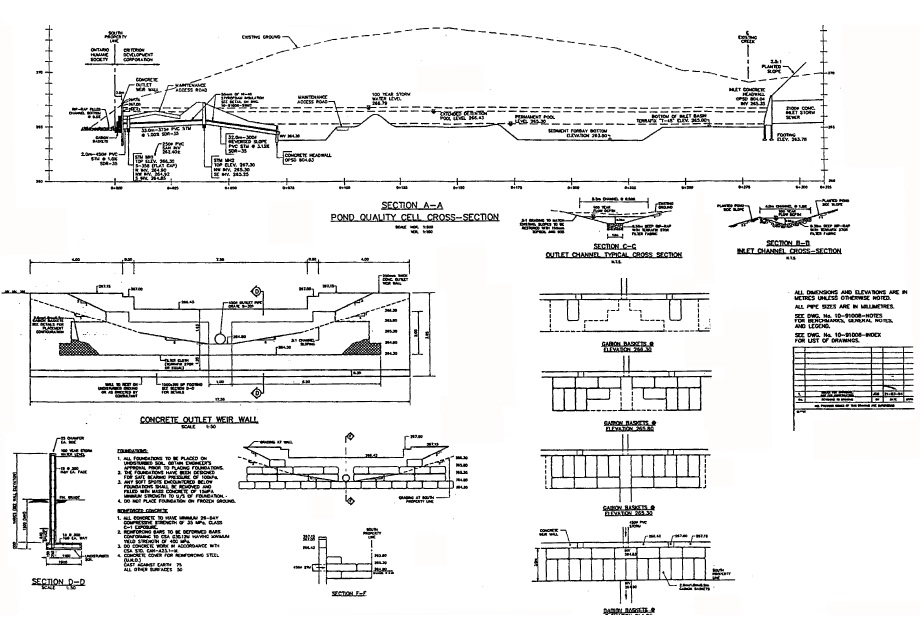
Figure I.4: Planting Plan showing the Design of the Artificial Wetland
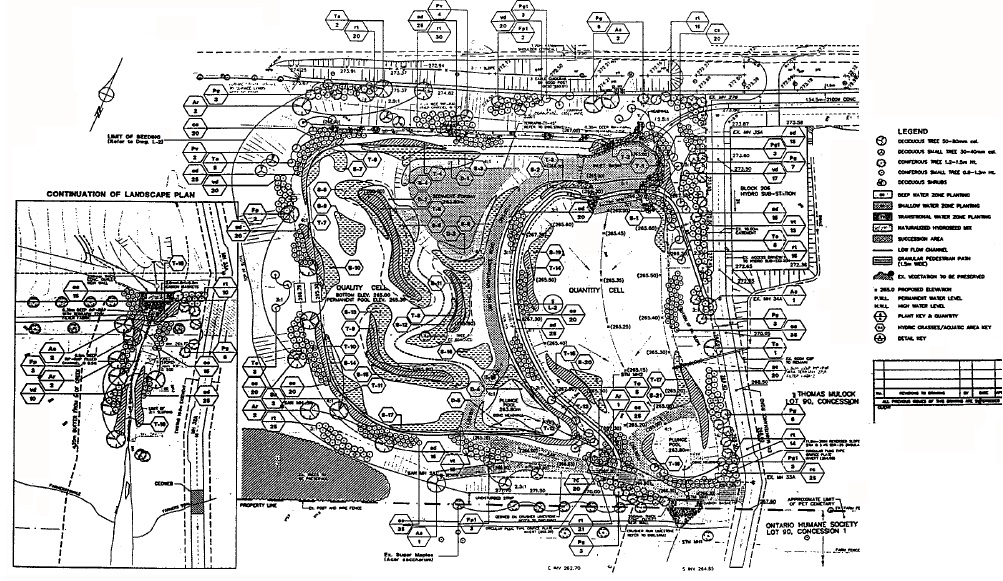
Figure I.5: Planting Plan showing Plantings around the Border of the Facility
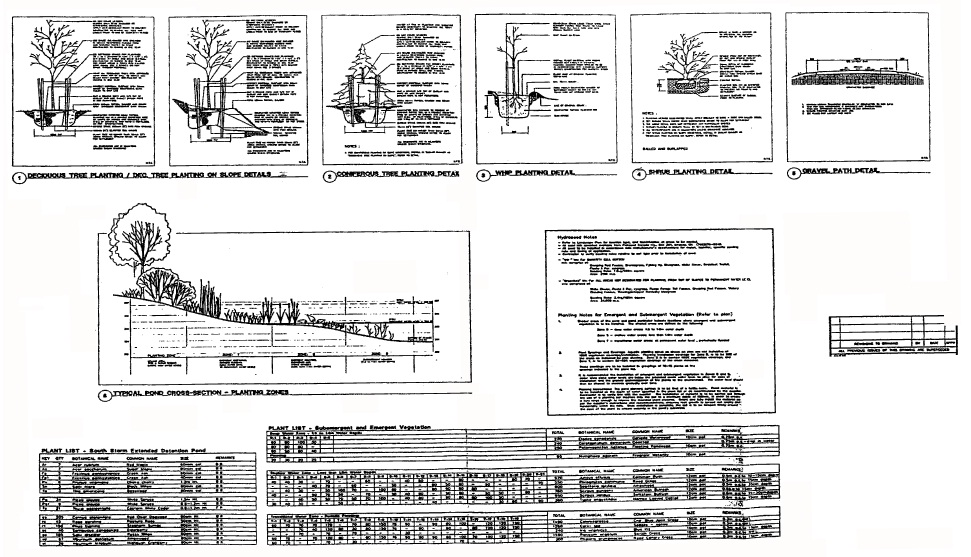
I.3 Design example 2 – end-of-pipe extended detention facility (quality and erosion control only)
The single-cell facility discussed in this section was designed to provide water quality and erosion control. The design can be extended to include quantity control by providing additional storage above the erosion storage.
The facility is located within a new retirement residential community (detached homes on relatively small lots) surrounded by a 9 hole golf course. The stormwater pond provides water quality control for storm runoff for about 10 hectares and was designed to be part of the golf course. The pond was designed to implement one of the recommendations of the "Stormwater Management (SWM) Plan." SWM Plan design criteria were developed in consultation with the Town, the Conservation Authority, and the District Office of the Ministry of Natural Resources. Approval was also obtained from the Ministry of Environment and Energy.
The design criteria for the SWM Plan were:
Flood control
Since the pond drains directly into a sizeable lake, there was no requirement to control post-development peak flows to pre-development levels.
Erosion control
Twenty-four hour detention for the runoff from a 25 mm storm was incorporated.
Water quality
Permanent pool storage based upon the 1994 SWMP Manual requirements for Level 1 protection was incorporated [Editor’s Note: now referred to as enhanced protection]. The active storage requirement of 40 m³/ha for water quality control was taken as part of the 25 mm (erosion) detention storage.
The facility was designed as a single-cell extended detention pond with wetland plantings incorporated in certain areas. The inflow to the pond is restricted to 5 year flows from the storm sewer system. The major system flows are diverted around the facility via an overland flow route directly to the lake.
The design drawings included:
- Plan view at a scale of 1:500 [Editor’s Note: not included] (reduced copy of the plan – Figure I.6);
- Four detail sheets showing the design of inlet/outlet structures and overland flow routes [Editor’s Note: not included]; and
- Detailed planting plans prepared by a landscape consultant showing the wetland plantings around the border of the facility [Editor’s Note: not included].
Figure I.6: Plan View (reduced copy)
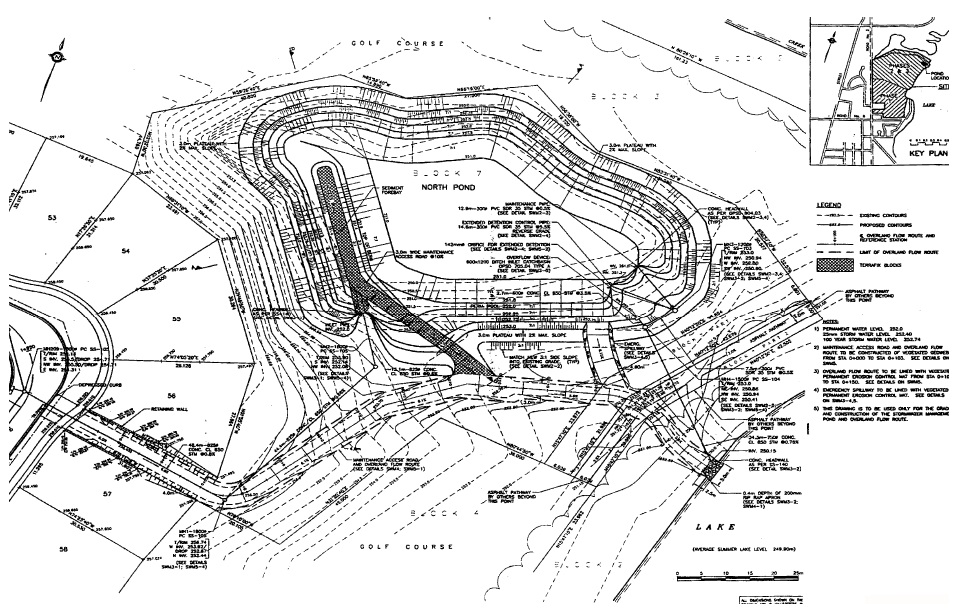
These drawings were accompanied by a "Functional Design Report" describing the design criteria, final hydrologic modelling of the facility, storage calculations, inlet and outlet design, maintenance and access features, and the overland flow route design. Excerpts from this report are provided in the following sections to indicate the level of detail typically included in such a document.
I.3.1 Functional design report example
Introduction
Proponent X is developing a residential subdivision and golf course in Township X. It is located on the shores of Lake X, east of Road Number 2 and north of Road Number 8. As illustrated in Figure 1, the development is scheduled to proceed in three phases [Editor’s Note: Figure 1 has not been included]. Construction of Phase 1 and its associated services has commenced. The primary stormwater management practice that has been implemented for this portion of the development is an extended detention quality control facility located adjacent to Lake X. This facility, a wet pond, has been named the South Water Quality Pond. It is proposed that an extended detention wet pond for quality control also be implemented to service both Phases 2 and 3 of the development and has been named the North Water Quality Pond. The purpose of this report is to describe the detailed design of the North Pond.
Background
The justification and general design criteria for the proposed stormwater management facility are provided in the "Stormwater Management Study," 199x. Given the quality concerns in the receiving Lake, the Study recommended that the facility consist of an extended detention wet pond sized to provide quality control of runoff for the areas tributary to it. In accordance with the 1991 MOEE/MNR Interim Stormwater Quality Control Guidelines for New Developments, the active storage requirements for quality control in the pond were based on detaining the runoff from a 25 mm storm for 24 hours. Current guidelines as given in the Stormwater Management Practices Planning and Design Manual (MOEE, 1994) recommend only 40 m³ of extended detention per hectare of area draining to the facility. This more recent guideline tends to generate much smaller storage requirements for extended detention than the 1991 guideline. However, given the sensitive nature of the receiving Lake, the former, more conservative criteria has been retained for the purposes of determining the active storage requirements for erosion quality control in the North Pond. Permanent pool requirements for quality control will be based on the guidelines given in the 1994 MOEE SWMP Manual [Editor’s Note: designers should refer to the 2003 SWM Planning and Design Manual for guidelines].
As specified in the Stormwater Management Study, all minor system flow from the areas tributary to the proposed North Pond will be directed to the facility. The minor system has been designed to convey the five year event. Therefore, the peak flow that will be conveyed to the facility under the 5 to 100 year storms is the 5 year post-development flow from the area draining to it. Major system flow generated in this area will be conveyed to the Lake by means of an overland flow route designed to convey major system flows generated up to the 100 year storm.
It should be noted that prior to the submission of the Stormwater Management Study, the estimated drainage area for the North Pond was 12.34 hectares. Given the current development scheme and grading plan, the drainage area will instead be 9.25 hectares as shown in Figure X [Editor’s Note: not included]. The average percent imperviousness of this area will be approximately 45%.
Approval requirements
It is anticipated that this report and the accompanying drawings will provide the required documentation for the following approvals:
- Township (Plan Approvals);
- Ministry of Natural Resources (Work Permit for Storm Outfall to Lake);
- Ministry of Environment and Energy (Certificate of Approval); and
- Conservation Authority (Plan Approvals and Fill and Construction Permit).
Design criteria
The Lake has been classified as a Class 1 habitat requiring Level 1 protection [Editor’s Note: now referred to as enhanced protection]. In order to ensure the protection and enhancement of the Lake and its watershed, a series of design criteria were identified for the North Pond. Criteria were established in the "Stormwater Management Study" as well as taken from the detailed design phase of the South Pond and are described below.
Functional criteria
The following criteria must be satisfied to ensure that the water quality control requirements are met:
- The facility should be designed as a wet pond. The minimum permanent pool volume in the facility should be 125 m³/ha of area draining to the facility. This volume is the minimum recommended permanent pool volume in a wet pond facility designed to provide Level 1 treatment for a 45% impervious area as specified in the 1994 MOEE SWMP Manual [Editor’s Note: now referred to as enhanced protection; designers should refer to the 2003 SWM Planning and Design Manual]. While there is the potential to create a permanent pool with a volume larger than the minimum MOEE recommended volume, consideration must be given to the permanent pool volume that can actually be sustained by the contributing drainage area. Typically, it is desirable to have a 30 day turnover in the permanent pool. The maximum permanent pool volume should be determined by taking into consideration the historical average monthly rainfall depths in the vicinity of the site and the monthly runoff expected given the imperviousness of the site and typical rainfall depth distributions for southern Ontario as specified in the MOEE SWMP Manual.
- The facility should have sufficient active storage for 24 hour detention of the runoff from the contributing drainage area under a 25 mm event. This criteria was established to satisfy the quality concerns for the receiving Lake.
- Storm runoff from the area tributary to the pond will be conveyed to the facility by means of a minor system designed to convey the five year event. The facility should be designed with sufficient active storage to pass the peak minor system flow without overflowing.
- The facility should be designed with an emergency overflow weir.
- Major system flow from the subdivision will be conveyed to the Lake by means of an overland flow route. According to the Township design criteria for open channels, the maximum flow velocity in the overland flow route should be 2.5 m/s.
- Any ponding that occurs at the low point on the road adjacent to the pond (the major overland flow route) must not extend beyond the curb line except at the location of the entrance to the overland flow route.
Environmental, aesthetic and safety criteria
The following criteria must be met to ensure that the facility provides environmental benefits, is attractively integrated into its surroundings, and presents a minimum hazard to the public:
- The maximum permanent pool depth should be 2.0 m. The maximum active pool depth should be 1.5 m.
- A minimum length-to-width ratio of 3:1 should be maintained in the pond ensuring the pollutant removal benefits associated with a longer flow path.
- The facility should be designed with a sediment forebay to improve pollutant removal by trapping larger particles near the inlet of the pond. The forebay should be 1-2 m deep to minimize the potential for re-suspension and to prevent the conveyance of re-suspended material to the pond outlet. The forebay dimensions should be selected to provide maximum dispersion of the inflow to the pond, thereby reducing velocities in the cell.
- Side slopes around the facility should vary to present a natural appearance. Terraced grading should be used to discourage public access to the pond.
- The storm outfall to the Lake should be designed to create a minimum of disturbance within the 15 m buffer around the Lake.
- The stormwater management block (Block 7) that will contain the proposed facility will be bordered on the north and south by a golf course. A golf cart path should extend across the eastern end of the stormwater management block connecting the paths at the northern and southern limits of the block. An easement has been created for this path.
- The permanent water level in the pond should be such that the pond creates a visual amenity to the golf course.
Maintenance and access criteria
- A hard surface should be installed in the forebay of the quality cell. The hard surface should be capable of withstanding the weight of the small grading equipment that will be used to periodically clean the forebay [Editor’s Note: this practice is no longer recommended in the 2003 SWM Planning and Design Manual – see Chapter 4].
- An access road should be provided to and from the forebay. The outlet structure from the pond and the pond outfall to the Lake should also be made accessible.
- The extended detention control device should be located within an easily accessible manhole rather than within the wetted area of the pond (i.e., perforated risers should not be used).
- A maintenance pipe should be provided to permit draining of the permanent pool.
Hydrologic modelling approach
In order to determine the active storage requirements in the North Pond for quality control and the design flows for the overland flow route, the hydrologic models (OTTHYMO) described in the "Stormwater Management Study" were retrieved and updated to reflect the current drainage scheme for the Phases 2 and 3 lands. The 9.25 hectares that will drain to the North pond were modelled as one basin using the STANDHYD command. Total and directly connected impervious values used in the model were 45% and 30%, respectively. A characteristic slope of 2% was used to reflect the proposed lot and street grading on the subject lands. A curve number of 78 was used based on the silty sand soils on the site and the proposed land use. A DUHYD command was used to split the minor and major system flows. Minor system flows were taken to be the 5 year flow generated on the site. The model was run with the 4 hour 5, 25 and 100 year Chicago distribution storms, as well as a 2 hour 25 mm storm. A simulation was also conducted with a 4 hour 25 mm storm. However, since the runoff volumes generated under this storm were smaller than the shorter duration 25 mm storm, the 2 hour 25 mm storm was taken to be critical.
Modelling results
The minor system flows and 5 through 100 year major system flows derived from the OTTHYMO simulations are summarized in Table I.1. The minor system flows are comparable to those derived using the Rational method as illustrated in the Table. Under the 25 mm storm, the runoff depth from the proposed development is 12.22 mm. This translates into a runoff volume of 1,130 m³. The detailed modelling results are included in the appendix [Editor’s Note: not included]. The storm sewer design sheets for the areas draining to the pond are given in the appendix [Editor’s Note: not included].
| Minor System (5 Year) Flows m³/s | Major System Flows m³/s | |||
|---|---|---|---|---|
| OTTHYMO | Rational Method | OTTHYMO 5 Year | OTTHYMO 25 Year | OTTHYMO 100 Year |
| 1.07 | 0.94 | 0 | 0.86 | 1.68 |
Functional design of north pond and overland flow route
The following sections describe the detailed design of the North Pond and illustrates how each of the design criteria will be met.
North pond storage requirements
Permanent pool
Using the MOEE SWMP Manual guidelines, the minimum required permanent pool volume for the proposed facility is 1,160 m³ [Editor’s Note: designers should refer to the 2003 Manual]. The maximum permanent pool volume was determined by multiplying the historical average monthly rainfall depth near the site in the driest month of the summer by a weighted runoff coefficient.
This coefficient was derived by recognizing that the amount of runoff generated under a given event will depend on the depth of the storm and by assuming that the frequency distribution of rainfall depth near the site is the same as the frequency distribution reported for typical southern Ontario sites in the MOEE SWMP Manual. A review of the historical average monthly precipitation records for the closest climatological station (with the same approximate elevation as the site) indicates that September is the summer month with the smallest average rainfall. The rainfall in this month is 65.1 mm. Using a runoff coefficient of 0.38 for the subject property, the maximum permanent pool volume is approximately 2,300 m³.
Drawing X shows the grading proposed to provide the required storage [Editor’s Note: not included]. As can be seen in the drawing, the facility has a 1 m deep permanent pool and the permanent water level is 252.0 m. The permanent pool volume is approximately 1,980 m³.
Active pool
The results of the OTTHYMO modelling indicate that the required active pool volume for erosion control is 1,130 m³. As shown in Table I.2, this volume is provided just below an active depth of 0.40 m (elevation 252.40 m). Water ponding up to this depth will drain by means of a reverse sloped pipe fitted with an orifice plate sized for 24 hour drawdown. Any water ponding above the 252.40 elevation will drain by means of a ditch inlet catchbasin located at the southeast corner of the pond. If the water elevation in the pond should reach an elevation of 252.75, the emergency weir will begin to operate.
| Elevation (m) | Active Storage (m³) |
|---|---|
| 252.00 | 0 |
| 252.20 | 580 |
| 252.40 | 1,200 |
| 252.60 | 1,870 |
| 252.80 | 2,570 |
| 253.00 | 3,340 |
As stated earlier, storm runoff from the area tributary to the pond will be conveyed to the facility by means of a minor system pipe designed to convey the five year event. Since the facility will accept 5 year post-development flows from its contributing drainage area, it is important that the facility have sufficient active storage to pass the 5 year flow without surcharging. In order to confirm that no surcharging will occur, two OTTHYMO simulations were conducted:
- to predict the maximum water elevation in the pond under a 100 year storm assuming that there is no active storage in the pond at the start of the storm and that the ditch inlet catchbasin and orifice are fully operational; and
- to predict the maximum water elevation in the pond under a 100 year storm assuming that the water level in the pond is 252.40 m at the start of the storm and that the ditch inlet catchbasin and the orifice are blocked (i.e., the only outlet from the pond is the emergency overflow weir).
The simulations were conducted by performing a ROUTE RESERVOIR command on the minor system hydrograph calculated using the DUHYD command. The storage outflow tables used in the ROUTE RESERVOIR command were tailored to reflect the different scenarios. The results of these simulations are illustrated in Table I.3 which indicates that under normal operating conditions (i.e., outlets not blocked), the maximum water level in the pond will be 252.74 m. Under extreme operating conditions, the maximum water elevation in the pond will be 252.94 m. The detailed results of these simulations are included in Appendix X [Editor’s Note: not included].
| 5 Year Storm | 25 Year Storm | 100 Year Storm | |
|---|---|---|---|
| Peak Outflow From Pond (m³/s) | 0.17 | 0.30 | 0.44 |
| Maximum Water Elevation (m) | 252.56 | 252.65 | 252.74 |
| 5 Year Storm | 25 Year Storm | 100 Year Storm | |
|---|---|---|---|
| Peak Outflow From Pond (m³/s) | 0.29 | 0.49 | 0.73 |
| Maximum Water Elevation (m) | 252.86 | 252.90 | 252.94 |
North pond inlet dsign
The design (5 year peak) inflow into the pond is 1.07 m³/s. Careful consideration has been given to the design of the pond inlet in order to minimize the potential for re-suspension of previously settled material in the wet pond. The proposed inlet design is described below:
- An 825 mm diameter pipe will convey the minor system flow from manhole 209 on the adjacent road to the pond. The invert of the pipe at the pond inlet is 252.0 m.
- There is a 1 m deep sediment forebay at the entrance to the pond. This pond is separated from the rest of the pond by a 0.8 m berm. The length and width of the forebay have been sized according to the dispersion, volume and surface area criteria given in the 1994 MOEE SWMP Manual [Editor’s Note: designers should refer to the 2003 SWM Planning and Design Manual].
- The inlet will be protected from erosion by placing erosion control blocks along the erosion-prone areas adjacent to the pipe.
North pond outlet design
In designing the outlet for the North Pond, the following was considered:
- providing 24 hour drawdown of the volume required for extended detention;
- passing flows in excess of the first flush out of the pond without causing surcharging; and
- providing easy access for maintenance.
The outlet from the pond is described below:
- The extended detention control device for the pond will consist of a 300 mm diameter reverse sloped pipe fitted with a 142 mm diameter orifice at its connection to MH 3 (see Drawing X [Editor’s Note: not included]). The orifice has been sized to provide 24 hour detention of the 1,200 m³ of active storage available below an elevation of 252.40 m. The invert of the orifice will be set at an elevation of 252.0 m. The calculations used for sizing the orifice are included in Appendix X [Editor’s Note: not included].
- A 1,200 mm × 600 mm Type A ditch inlet catchbasin will convey runoff in excess of the first flush out of the pond. The invert of the ditch inlet catchbasin will be 252.40 m. The ditch inlet catchbasin drains to a 600 mm diameter pipe connected to MH 4. A 750 mm diameter pipe will extend from this manhole to the Lake.
- A 4.6 m wide emergency overflow weir set at an elevation of 252.75 m will convey flows out of the facility in the event that the other outlets are not functioning properly. The weir has been sized to pass a flow equivalent to the design flow into the facility (i.e., 1.07 m³/s) with a maximum water elevation in the pond of 253.0 m. The emergency spillway will convey flows to the overland flow route into the Lake. The emergency spillway will be protected from erosion by means of a vegetated erosion control mat. Assuming a maximum water elevation in the pond of 253.0 m, the maximum velocities on the emergency spillway will be 1.93 m/s.
The stage-storage-outflow relationships for the pond are given in Appendix X [Editor’s Note: not included].
Maintenance and access features for north pond
Specific attention has been give to the maintenance and access features of the facility. In particular, the following items should be noted:
- A 4 m wide access route constructed of a vegetated, perforated cellular confinement system backfilled with 30/70 topsoil/sand mix will extend from the adjacent road to the forebay of the pond. The cellular confinement system has been designed to provide load support for the small grading equipment that will occasionally be required to clean the forebay.
- The forebay itself will be lined with erosion control blocks which have been sized to support the maintenance equipment that will periodically be required for sediment removal [Editor’s Note: this practice is no longer recommended in the 2003 Manual].
- A 300 mm diameter maintenance pipe will be provided at the pond outlet to facilitate draining the pond. The pipe will be fitted with a gate valve as shown in Drawing 1 [Editor’s Note: not included].
- The slide frame that will contain the orifice gate at the outlet of the extended detention control pipe has been designed such that it can also be used to isolate the extended detention control pipe if required.
- The manholes at the pond outlet will be accessible from the asphalt pathway shown in Drawing 1 [Editor’s Note: not included]. A second pathway (to be constructed by others) will extend to the pond outfall at the Lake.
Design of overland flow route
A major system outlet for the Phases 2 and 3 lands will be created between Lots 56 and 57 on the adjacent road. An overland flow route will be constructed to convey major system flows from the low point on the road, easterly between lots 56 and 57 and then through the stormwater management block towards the Lake. The average slope for the route will be approximately 6.1%. The route will be constructed as described below:
- The first 103 m of the overland flow route will double as the maintenance access road for the pond. This portion of the route will be constructed of a vegetated, perforated cellular confinement system backfilled with 30/70 topsoil/sand mix. Given the 100 year design flow of 1.68 m³/s, the maximum velocity on this portion of the route will be 2.24 m/s. The velocity calculations for the overland flow route are included in the appendix [Editor’s Note: not included].
- The final 47 m of the route will be lined with a vegetated, permanent erosion control mat. Given the 100 year design flow of 1.69 m³/s (overland flow plus flow from the emergency spillway), the maximum velocity on this portion of the overland flow route will be 2.28 m/s.
- The overland flow route will pass over the asphalt pathway located in Part 2 of Block 7. Given the 100 year design flow of 1.69 m³/s, the maximum flow depth and velocity on the pathway will be 0.16 m and 2.28 m/s, respectively.
- At the outlet of the overland flow route, a 2 m long, 5 m wide rip-rap apron will be constructed to protect the shoreline from erosion. The rip-rap will have a median diameter of 200 mm and will be placed to a depth of 400 mm. The erosion control mat that will line the overland flow route will extend underneath the rip-rap to prevent any native fines from being washed away.
- The maximum ponding elevation at the low point on the adjacent road will be 259.30 m. The ponding limits on the road will not extend beyond the curb line except at the location of the entrance to the overland flow route and at several of the driveways located near the low point. The ponding limits are shown in Figure E-2 in the appendix. The ponding calculations are also given in the appendix [Editor’s Note: not included].
Summary
- The Lake has been classified as a Level 1 habitat. Quality control of stormwater runoff for the proposed Phases 2 and 3 of the subdivision is required to meet guidelines for protecting a Level 1 habitat.
- Quality control for the proposed development will be provided in an extended detention wet pond.
- The permanent pool in the wet pond will have a volume of 1,980 m³. This volume is greater than the 1,160 m³ volume recommended in the 1994 SWMP Manual for wet ponds that are to provide Level 1 quality control [Editor’s Note: now referred to as enhanced protection in the 2003 SWM Planning and Design Manual] of runoff from a 45% impervious area. Given the historical rainfall records in the area, it is predicted that the permanent pool will have an approximate 30 day turnover during the driest months of the summer.
- An extended detention control device at the outlet of the wet pond will provide 24 hour drawdown of the 1,130 m³ that will runoff from the proposed development under a 25 mm event.
- Storm runoff from the area tributary to the pond will be conveyed to the facility by means of a minor system designed to convey the five year event. A ditch inlet catchbasin at the outlet of the pond will convey flows in excess of the first flush out of the pond. These flows will be conveyed to the Lake by means of a 750 mm diameter storm sewer.
- An emergency overflow weir will convey flows out of the pond in the event that the ditch inlet catchbasin and/or orifice become blocked.
- A 300 mm diameter maintenance pipe has been provided at the pond outlet in the event that the permanent pool needs to be drained.
- The pond has been designed with a 1 m deep sediment forebay. The forebay will provide benefits with respect to settling and dispersion.
- A 4 m wide access route constructed of a vegetated, perforated backfilled cellular confinement system with 30/70 topsoil/sand mix will extend from the adjacent road to the forebay of the pond. The cellular confinement system has been designed to provide load support for the small grading equipment that will occasionally be required to clean the forebay. The forebay itself will be lined with erosion control blocks [Editor’s Note: this practice is no longer recommended in 2003 Manual].
- The major system outlet for the subdivision will be between Lots 56 and 57 on the adjacent road. An overland flow route will be constructed to convey major system flows from the low point on the road, easterly between lots 56 and 57 and then through the stormwater management block towards the Lake. The first 103 m of the overland flow route will double as the maintenance access road for the pond. This portion of the route will be constructed of a vegetated, perforated cellular confinement system backfilled with 30/70 topsoil/sand mix. The final 47 m of the route will be lined with a vegetated, permanent erosion control mat. The 100 year flow velocities on all portions of the route will be below the 2.5 m/s maximum specified in the Township criteria for design of open channels.
- The maximum (100 year) ponding elevation at the low point on the adjacent road near the entrance to the overland flow route will be 259.30 m. The ponding limits on the road do not extend beyond the curb line except at the location of the entrance to the overland flow route and at several of the driveways located near the low point.
I.4 Example 3 – integrated "treatment train" infiltration system (quality and quantity control)
This example is located within a new 28.3 hectare residential development. This development forms the first part of a larger 250 hectare subwatershed that is being developed based on the criteria contained within the design report [Editor’s Note: not included]. A "treatment train" approach was used to design the lot level, conveyance and end-of pipe stormwater management facilities required.
The receiving outlet is a Level I coldwater stream within a Provincially Significant Wetland [Editor’s Note: requires what is now referred to as enhanced protection]. In the undeveloped state, there is little or no surface runoff discharged to the receiving stream. Under normal rainfall events (2 to 100 year design storms), the precipitation infiltrates into the underlying outwash sands and gravels and is routed through the overburden groundwater aquifer to discharge in the creek. A primary objective of the design and construction of the stormwater management system is to maintain these characteristics.
The final design for the stormwater management system was developed through consultation with the City, the Conservation Authority and the Ministry of Natural Resources. The Ministry of Environment and Energy reviewed and issued the Certificates of Approval to construct the facilities.
The design consisted of the following components:
- Lot Level Controls
- Runoff from the roof and rear yards is directed over grassed surfaces to a swale/infiltration trench system. The swale/infiltration trench system is designed to route, collect and infiltrate the runoff from all events up to the 5 year design storm.
- Conveyance Controls
- The runoff from the driveway and road surfaces is routed through oil/grit manholes to pre-treat the runoff prior to the release to the end-of-pipe system. It was decided that direct infiltration of the road runoff was undesirable.
- End-of-Pipe Controls
- The infiltration basin/trench system implemented for the end-of-pipe control, through the centre of the site, has the capacity to collect, filter and recharge the runoff from all rainfall events up to the 100 year design storm for the entire development. The "first flush" (2 year) storm is infiltrated through the vegetated sand filter that extends over the bottom of the greenway for the full length of the facility. Runoff volumes greater than the "first flush" event up to the 100 year event are routed to an infiltration trench system constructed along both sides of the greenway basin.
An "Environmental Implementation Plan" was prepared to compile the information generated at the conceptual design stage plus the final stormwater management design into a single comprehensive document to guide construction. Edited excerpts from this document have been included focussing on the stormwater management design and the supporting documentation required for approvals [Editor’s Note: Appendices and non-essential figures have been omitted for purposes of conciseness].
The following drawings are attached in reduced format to show the construction details:
- A General Plan showing the layout of Phase I of the Subdivision (Figure I.10);
- Four Plan and Profile drawings showing the construction details for the end-of-pipe greenway system (Figures I.11, I.12, I.13 and I.14);
- One Plan showing the details of the rear lot infiltration gallery system (Figure I.15); and
- One Drawing showing the landscaping details for the end-of-pipe greenway system (Figure I.16).
I.4.1 Environmental implementation report
Excerpts from the City of Guelph’s Environmental Implementation Report are outlined below, including the rationale, design criteria and analysis results used to design and construct the stormwater management system in the Pine Ridge Subdivision.
Introduction
The Pine Ridge Subdivision received Draft Plan Approval in July 1995. The conditions of Draft Plan Approval require that the following reports and/or plans be prepared to support the detailed final design of the subdivision and the implementation of the works:
- Stormwater Management Report;
- Site Grading and Drainage Plan;
- Erosion and Sediment Control Plan; and
- Tree and Hedgerow Inventory and Conservation Plan.
Instead of separate documents, the above reports are combined into one comprehensive Environmental Implementation Report for the Pine Ridge Subdivision. The preparation of this document was guided by but supersedes all previous reports. The Environmental Implementation Report was jointly prepared by various consultants to specifically address Conditions 17 and 18 of the Ministry of Municipal Affairs and Housing and Conditions 19, 20, 27, 35, 37, 41, and 46 of the City of Guelph resolution dated June 12, 1995.
The Environmental Implementation Report is intended to govern and direct the design, construction, monitoring and maintenance of the services and stormwater management facilities in the Pine Ridge Subdivision.
Location
Figure I.7 shows the location of the proposed development and the surrounding area. The site is bounded by Gordon Street to the west, the Farley Farm to the south, by Ridgeway Avenue/Malvern Crescent to the north and by other lands owned by the developer in the annexed area east to Victoria Road.
Existing conditions
- Land Use: The existing land use for the Pine Ridge lands is agriculture. The predominant crops grown on these lands in recent years has been corn, beans and wheat. The adjacent lands to the east and south are also in agricultural production. The lands to the north (Malvern/Ridgeway) and west (Lowes/Dawn) have been developed with individual wells and septic systems.
- Topography: The topography on the Pine Ridge lands is relatively flat. Most of the site slopes in a northwesterly direction toward Gordon Street. The north easterly part of the site slopes toward the kettle features in the Torrance Creek Watershed. The average gradient of these lands is 0.5%.
- Soils:
The predominant surface soil type throughout the Pine Ridge lands is Burford Loam (Wellington County Soils Maps). The hydrologic soil classification for Burford Loam is AB. The good drainage characteristics and high infiltration rates for this soil type have been verified by the geologic and hydrogeologic investigations completed for the Hanlon Creek Watershed Plan (Marshall Macklin Monaghan and LGL Ltd., 1993) and the Watershed Management Strategy for the Upper Hanlon Creek and its Tributaries (Gamsby and Mannerow Limited, Cumming Cockburn Ltd., and Code MacKinnon Ltd., 1993).
The kettle lake features located on the eastern boundary of the proposed development are identified as having a layer of muck soils in the bottom.
- Water Table Monitoring: A network of water table observation wells was installed in the area of Clair Road and Gordon Street in 1988. Monitoring of the observation wells has been carried out on a bi-monthly basis since the installation. Figure I.8 shows the monitoring wells installed on the Pine Ridge property.
- Site Constraints:
The lands in the area of Gordon Street and Clair Road, and in this particular instance the Pine Ridge lands, do not have a typical or manmade drainage connection to Hanlon Creek or its tributaries. Therefore, surface runoff from the site is negligible. The combination of flat topography and permeable soils infiltrates the precipitation from the normal range of rainfall events. Only under extreme rainfall events such as a Regional Storm will surface runoff occur.
The recommendation of the Hanlon Creek Watershed Plan and the Watershed Management Strategy is that all runoff generated by the normal range of design storms (2 to 100 year events) be pre-treated and recharged to the shallow groundwater system.
Stormwater management criteria
The studies, policies and guidelines used to develop the stormwater management plan for the Pine Ridge Subdivision were as follows [Editor’s Note: some references may be out of date]:
- Hanlon Creek Watershed Plan, October 1993
- A Watershed Management Strategy for the Upper Hanlon Creek and its Tributaries, June 1993
- Environmental Impact Statement, Ariss Glen Developments, Torrance Creek/ Hamilton Corners, Class 2 Wetland Complex
- Stormwater Management Practices Planning and Design Manual, 1994
- Interim Stormwater Quality Control Guidelines, 1991
- Stormwater Quality Best Management Practices, 1991
- MTO Drainage Management Technical Guidelines, 1989
- Urban Drainage Design Guidelines, 1987
Figure I.7: Location of the Proposed Development and Surrounding Area
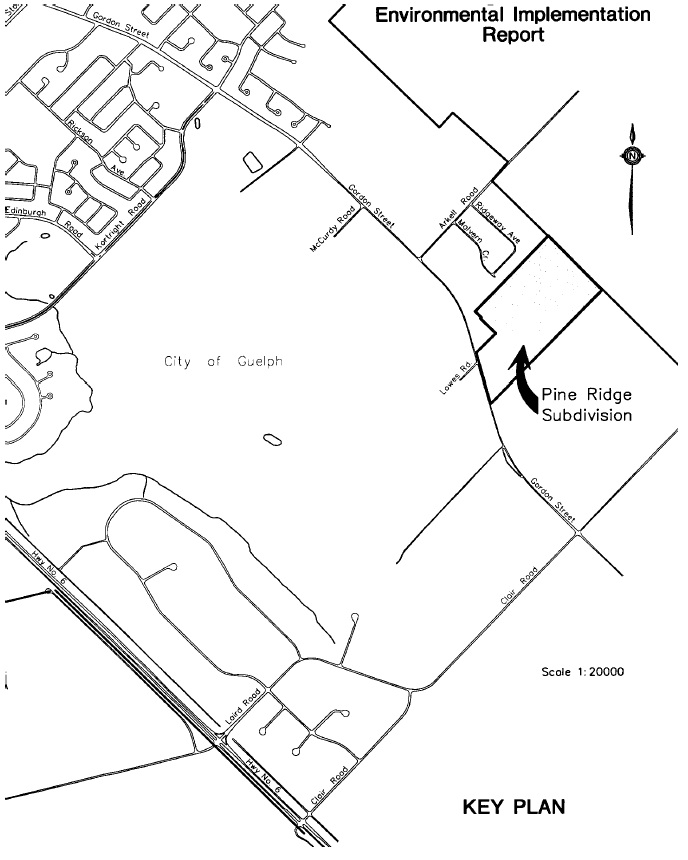
Figure I.8: Locations of Monitoring Wells on Pine Ridge Property
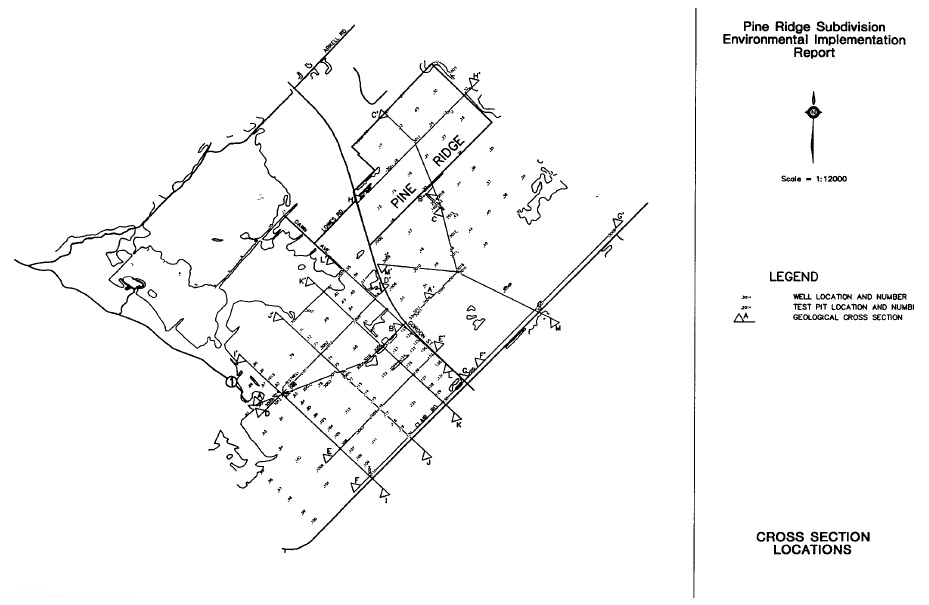
The objectives of the stormwater management plan are as follows:
- Promote the recharge of storm runoff on all grassed or pervious surfaces remote from the end-of-pipe system using lot level controls.
- Promote runoff infiltration in the end-of-pipe system after suitable pre-treatment to remove sediments that could have a detrimental impact on the functioning of the greenway system.
- Provide stormwater quantity controls for a range of design storms (up to the 100 year event). All events within this range of storms will be contained, treated and recharged in the greenway system. Adequate storage capacity will be provided to ensure that surface runoff will not occur under any rainfall event up to the 2 to 100 year design storms.
The method used to evaluate and design the stormwater management plan was as follows:
1) The mass rainfall data for the "first flush" design storm was generated using a two hour duration rainfall event. A three hour duration rainfall event was used to generate the mass rainfall data required to model the 5 and 100 year design storms. The Chicago parameters and the total depth of rainfall for each storm are as follows:
| First Flush | 5 Year | 100 Year | |
|---|---|---|---|
| a = | 743.000 | 1,593.000 | 4,688.000 |
| b = | 6.000 | 11.000 | 17.000 |
| c = | 0.799 | 0.879 | 0.962 |
| r = | 0.400 | 0.400 | 0.400 |
| td = | 120.000 | 180.000 | 180.000 |
| Rainfall depth (mm) = | 31.200 | 47.200 | 87.300 |
The Horton infiltration method was used in the runoff calculations. The infiltration parameters are very conservative to account for the long-term efficiency of the proposed drainage system. The parameters used in MIDUSS were as follows:
| Impervious Areas | Pervious Areas | |
|---|---|---|
| Maximum Infiltration | 0.0 mm/hr | 76.0 mm/hr |
| Minimum Infiltration | 0.0 mm/hr | 13.0 mm/hr |
| Lag Constant | 0.0 hr | 0.25 mm/hr |
| Depression Storage | 1.5 mm | 5.00 mm |
Based on the hydrogeologic investigation completed for the Watershed Management Strategy for the Upper Hanlon Creek and its Tributaries, the estimated soil permeability for the sand and gravel overburden found on the Pine Ridge site was 1.7 x 10⁻¹ m³/s. In the Hanlon Creek Watershed Plan, the estimated permeability for this soil type was found to range between 1 and 1 x 10⁻¹ m³/s. For design purposes, the coefficient of permeability for the soils on this site was reduced to 5 x 10⁻² m³/s. The more conservative permeability has been used to account for the expected long-term efficiency of the infiltration system.
The hydrologic model MIDUSS was used to create the runoff hydrographs and to route the flows through the storage and infiltration structures.
Stormwater management design concept
Under the normal range of rainfall events, storm runoff does not occur from the Pine Ridge lands. The stormwater management system implemented for this development must emulate those existing conditions. To achieve this, the stormwater management system must have the capacity to infiltrate all runoff generated for the complete range of design storms up to and including the 100 year event. Only extreme events exceeding the 100 year storm are expected to generate surface flow that will leave the site.
The approach to stormwater management on this site must be an integrated one. This involves using the highly permeable soils throughout the development to start the infiltration process as close as possible to the point where the precipitation lands on the ground. The stormwater management system will include lot level, conveyance and end-of-pipe controls.
Lot level controls will include rear lot infiltration galleries [Editor’s Note: type of infiltration trench], flat swale drainage and sump pumps discharging to the rear yards. With minor exceptions, all roof drainage will be directed to the rear yard.
Multiple storm sewer outlets will direct runoff to the greenway to keep the size of the drainage catchments small and to minimize the length of the impervious flow paths. Pre-treatment will be provided by oil/grit manholes (to clean the runoff by removing sediments and oils).
The end-of-pipe system is the greenway that stretches through the center of the Pine Ridge Subdivision. The greenway is comprised of three terraces that will collect, clean, filter and infiltrate the runoff. Quality control will be achieved by routing the discharge from the storm sewer outlets through settling areas to further remove sediments. The runoff will then be distributed over the surface of the greenway for infiltration through the bottom of the greenway.
To provide stormwater quantity control, for events exceeding the quality control rates identified in the current policies and guidelines, inlet structures will convey the pre-treated runoff to a gallery for direct recharge to the permeable native soils.
The greenway system will be designed with the capacity to provide treatment and recharge for the entire development site under the full range of design storms (2 to 100 year events). The lot level controls will be enhancements to the greenway. The lot level facilities will reduce the volume of runoff being conveyed to the greenway, thereby creating reserve capacity within the greenway.
The description and function of the end-of-pipe stormwater management facilities are outlined below:
a) Greenway
The greenway is continuous from Gordon Street at the southwest corner of the site to the kettle at the northeast corner,
- to provide stormwater access as frequently and uniformly as possible throughout its length to minimize the runoff volume and velocity that will be discharged to the ground surface at any location.
- to distribute the infiltration function over as much of the site as possible to maximize pervious surface contact.
- to permit flows that will exceed the storage capacity of the greenway (greater than the 100 year design storm) to discharge directly to the Gordon Street right-of-way and the kettles.
The operational features of the greenway will be graded essentially flat from end to end,
- to provide multiple access points for storm runoff and to minimize stormwater travel distance and time from any point in the subdivision. This will direct the rainfall from hard surfaces onto vegetated surfaces as quickly as possible.
- to distribute the runoff to the largest possible ground surface area to maximize the contact surface and thereby minimize the length of time necessary for infiltration to occur. This also utilizes the maximum surface area for aerobic bacterial activity, thereby maximizing the treatment of any biodegradable contaminants that may be carried to the greenway.
- to minimize the flow velocity within the greenway and thereby minimize the potential for erosion.
- perimeter of the site, thereby minimizing the potential for drainage problems. Even so, the new homes adjacent to Ridgeway and Malvern will be higher than the existing ones. This is due to the grading of the road to permit sanitary and storm servicing and to ensure the operation of the rear lot infiltration gallery.
- to maintain the natural surface and ground water drainage divides.
- micro variations in the topography of the bottom of the greenway terraces, below the operational levels, will be incorporated to create a meandering undulating landscape to provide enhanced visual, ecological and habitat diversity.
The greenway has been designed with 3:1 side slopes,
- to create a small terrace approximately a metre in height, from the rear lot line to the bottom of the greenway. This will maximize the flat area available for recharge.
- to create a protected area for the installation of the recharge galleries which will accept flows exceeding the infiltration capability of the greenway bottom.
- to create a flat area for maintenance access within the greenway and to define the edge of the public property.
- a variety of side slopes (3:1 to 6:1) will be incorporated throughout the greenway system to create an aesthetically pleasing landscape during final design.
The vegetation in the greenway has been ecologically selected,
- to maintain the porosity of the soils and maximize the infiltration capability.
- to minimize the level of municipal maintenance required in the facility.
- to maximize the nutrient uptake from the runoff that reaches the greenway.
- to create an atmosphere of aesthetic, cultural, social and recreational interaction.
A 300 mm thick sand filter layer will be constructed for the entire length and width of the greenway bottom, at the interface between the native gravel soils and the topsoil that will be placed over top, to prevent fine surface soils and sediments from penetrating the gravelly native soils and interfering with natural percolation capacity.
At storm sewer outlets, a peat layer may be added to further filter and polish the runoff prior to spreading over the greenway bottom for infiltration.
The sand layer will also permit the use of the greenway for some stormwater management and sediment control during construction. Sand contaminated by sediment accumulations can simply be removed and replaced before the final landscaping.
The inlet distribution/gallery system will be constructed of perforated polyethylene field tile, fed by catchbasin inlet structures strategically placed along the length of the tile and the greenway.
The inlet distribution/gallery system will be located in the side slope terraces of the greenway, adjacent to the rear lot lines:
- for more cover and protection than would be afforded in the middle of the greenway (protection from frost and damage by human activity).
- for aesthetic, inconspicuous placement of inlet structures.
The inlet elevation to the distribution/gallery network will be set at the 2 year storm flood storage level to ensure that all storms with runoff volumes less than the two year storm are infiltrated through the grassed surface of the greenway.
The bottom of the distribution/gallery will be located approximately 1.0 metre above the average high water table to ensure adequate soil contact to facilitate recharge.
b) Park
The park block has soil capabilities similar to the greenway and can infiltrate not only its own rainfall, but also the runoff from adjacent lands. The park will receive runoff from the rear of Lots 7 to 12, 33 to 36, and the Malvern Crescent lots that slope toward them. Any runoff from the rear of Lots 37 to 42 will drain to the east, to Terrace 3000.
An infiltration structure is proposed along the rear of Lots 7 to 12, 33 to 36, and 37 to 42. A similar structure could be extended along Street B to ensure the collection and infiltration of any runoff that may be generated in the park.
The grading in the park has been prepared based on discussions with the City of Guelph’s Parks and Recreation Department.
c) Quality control
Quality control on this site will consist primarily of keeping any sediment accumulations on the surface of the greenways. During construction, there could be accumulations of sediment requiring periodic clean up, especially before final landscaping.
After servicing and house building is complete, accumulations of sediment will be very small, course grained and will be distributed over a very large surface area. It will be many decades, if ever, before it will be necessary to clean up post-development deposits.
Stormwater management plan
The SWMPs in the Stormwater Management Practices Planning and Design Manual (1994) were screened and nearly all were found to be applicable to this site. Not all were selected, however, because not all will be acceptable to the municipality and not all are cost-effective.
A significant factor in the selection of SWMPs for this site is the "closed" nature of the stormwater management facility. There will be no runoff from the site until a rainfall exceeding the 100 year storm occurs. Thus, no routine rainfalls, sediments, or contaminants will discharge from the site to any other property or water body.
Sediment accumulation during construction is the only contamination of any concern, and this can be effectively managed through physical means, as described in Section 5.0(c) and Section 8.0 [Editor’s Note: these sections have not been included].
The selected SWMPs can be categorized as lot level controls, pre-treatment controls, and end-of-pipe controls (although the end-of-pipe controls could be considered "conveyance controls").
Lot level controls
Stormwater management practices recommended to provide lot level control on this site are as follows:
Flat rear yard swales/rear lot infiltration galleries
Drawing 16 [Editor’s Note: drawing has not been included] shows the profile of the rear lot line through Catchments 130, 160, 264, 287, 501 and 502 and the location and the construction details for the rear yard swale/infiltration gallery systems to be installed in Phase I. The grade on the rear yard swale is 1.0%. The lot grading can be adjusted to create a small amount of ponding at the rear of each lot (about 0.1 m). This will collect and infiltrate minor runoff from the rear yards. When rainfall events are intense enough to cause flow in the swale, the inlet structures will convey the runoff to the infiltration gallery for more direct recharge.
The analysis shows that the swale/infiltration gallery systems will collect and infiltrate the runoff from all events up to and including the 5 year design storm. Approximately 70% of the storage/discharge capacity of the infiltration gallery would be used to control the rear lot drainage for a 5 year event. The following tables summarize the runoff rate and volume and the routing results through the infiltration galleries in Catchments 130, 160, 264, 287, 501 and 502.
| Design Storm | Catchment 130 | Catchment 160 | Catchment 264 | Catchment 287 | Catchment 501 | Catchment 502 | ||||||
|---|---|---|---|---|---|---|---|---|---|---|---|---|
| Flow Rate m³/s | Runoff Volume m³ | Flow Rate m³/s | Runoff Volume m³ | Flow Rate m³/s | Runoff Volume m³ | Flow Rate m³/s | Runoff Volume m³ | Flow Rate m³/s | Runoff Volume m³ | Flow Rate m³/s | Runoff Volume m³ | |
| First Flush | 0.024 | 32 | 0.068 | 94 | 0.053 | 72 | 0.085 | 117 | 0.025 | 31 | 0.007 | 29 |
| 5 Year | 0.032 | 58 | 0.096 | 169 | 0.073 | 130 | 0.118 | 211 | 0.035 | 55 | 0.080 | 214 |
| 100 year | 0.064 | 135 | 0.177 | 392 | 0.142 | 300 | 0.227 | 487 | 0.082 | 128 | 0.402 | 890 |
| Control Point | Available Capacity | Actual Capacity Used | ||||
|---|---|---|---|---|---|---|
| Peak Flow m³/s | Storage Volume m³ | Storage Depth m | Peak Flow m³/s | Storage Volume m³ | Storage Depth m | |
| Bottom of Gallery | 0 | 0 | 0.00 | |||
| First Flush | - | - | - | 0.02 | 6 | 0.21 |
| 5 Year | - | - | - | 0.03 | 8 | 0.30 |
| 100 Year | - | - | - | 0.05 | 18 | 0.66 |
| Top of Gallery | 0.08 | 27 | 1.00 | |||
*Editor’s Note: The five tables for Catchments 160, 264, 287, 501 and 502 have been omitted for purposes of conciseness.
Conveyance controls
Figure I.9 shows the drainage sub-catchments, drainage areas and the location of the storm outlet for each catchment. The catchments are as small as possible to minimize the discharge at any one location. The multiple storm sewer outlets will reduce the potential sediment accumulation.
The direct infiltration of runoff is not acceptable because adequate pre-treatment cannot be provided. However, the conveyance methods that will remove sediment and other potential contaminants from the runoff prior to discharging to the greenway will be implemented.
It is recommended that oil/grit manholes be installed to pre-treat the runoff from the streets in Phase I prior to discharging it to the greenway.
Oil/grit manholes are recommended for catchments with a drainage area less than or equal to 2 hectares. The sub-catchments for this development meet that criteria.
The removal of sediments through the use oil/grit manholes followed by the sediment forebays at the stormsewer outlets will provide pre-treatment of the runoff entering the greenway terraces.
End-of-pipe management
The end-of-pipe system is the greenway that stretches from Gordon Street through the center of the site to the kettle in the northeast corner. The greenway is comprised of three ponding terraces. The terrace at Gordon Street (Terrace 1000) is set slightly lower than the central terrace (Terrace 2000) which will be slightly lower than the kettle terrace (Terrace 3000).
The entire greenway system will be pre-graded as part of Phase I of the development. Terrace 1000 and part of 2000 will be constructed as part of Phase I. The rest of Terrace 2000 and Terrace 3000 will be topsoiled and seeded after pre-grading with the final construction occurring during the subsequent phases of the Pine Ridge Subdivision.
Figure I.9: Drainage Area Plan
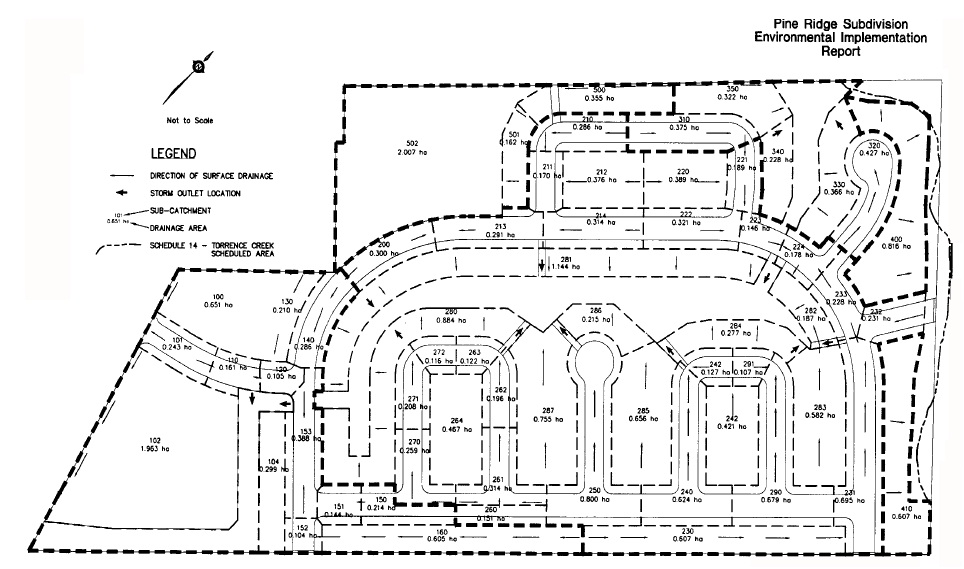
Pre-treated runoff from the street network is released to the greenway in small quantities at multiple locations. A settling forebay will be constructed at each of the storm sewer outlets. These areas will provide energy dissipation and some sediment removal. The attached drawings show the construction details for the greenway system. A planting scheme for the greenway system is detailed on the attached drawings and in Section 9.0 [Editor’s Note: these drawings and this section has not been included].
The discharge from the settling bays will spread over the adjacent surface of each greenway terrace and will infiltrate through the vegetated surface of the greenway. Any suspended solids will settle on the surface. A sand filter will be constructed in the bottom of the greenway to prevent the surface soils from clogging the permeable native soils below. The sand filter will allow plant roots to maintain a porous interface between the soil surface and the underlying permeable soils.
Runoff volumes exceeding the quality control depth (first flush/2 year design storm) will flow by way of a series of inlet structures into the distribution/gallery network for direct recharge to the groundwater system.
The attached drawings show the location and extent of the greenway gallery network in Phase I of the Pine Ridge Subdivision [Editor’s Note: see Figures I.10 to I.16 at the end of this appendix].
Summer operation
The greenway is comprised of three terraces identified as Terrace 1000 (Gordon Street), Terrace 2000 (centre) and Terrace 3000 (kettle). The depth of the terraces from the pond bottom to top-of-bank (rear lot line) is 1.80, 1.20 and 1.20 metres, respectively. The active storage depth in each terrace is 0.95, 0.65 and 1.53 metres, respectively. The remaining depth in each terrace up to the overflow weir is freeboard. The greenway system has been designed to contain the 100 year design storms within the above storage depths. The freeboard provides reserve storage and attenuation capability for events exceeding the 100 year design storm while protecting basements and foundations.
Table I.6 lists the total flow rate and the total runoff volume received by the each terrace under the "first flush," 5 year and 100 year design storms.
| Design Storm | Terrace 1000 | Terrace 2000 | Terrace 3000 | |||
|---|---|---|---|---|---|---|
| Flow Rate m³/s | Runoff Volume m³ | Flow Rate m³/s | Runoff Volume m³ | Flow Rate m³/s | Runoff Volume m³ | |
| First Flush | 0.74 | 1,021 | 1.61 | 2,305 | 0.2 | 287 |
| 5 Year | 1.02 | 1,738 | 2.32 | 4,066 | 0.29 | 509 |
| 100 Year | 1.95 | 3,737 | 4.72 | 9,110 | 0.61 | 1,140 |
Table I.7 compares the greenway routing results with the available stage-storage- discharge capacities for each terrace.
| Control Point | Available Capacity | Actual Capacity Used | ||||
|---|---|---|---|---|---|---|
| Peak Flow m³/s | Storage Volume m³ | Storage Elev.. m | Peak Flow m³/s | Storage Volume m³ | Storage Elev.. m | |
| Pond Bottom | 0 | 0 | 332 | |||
| First Flush | 0.03 | 1,080 | 332.50 | 0.03 | 856 | 332.42 |
| 5 Years | - | - | - | 0.1 | 1,304 | 332.95 |
| 100 Years | - | - | - | 0.26 | 2,651 | 332.95 |
| Weir | 0.41 | 6,232 | 333.6 | |||
| Rear Lot Line | 3.67 | 7,531 | 333.80 | |||
| Control Point | Available Capacity | Actual Capacity Used | ||||
|---|---|---|---|---|---|---|
| Peak Flow m³/s | Storage Volume m³ | Storage Elev.. m | Peak Flow m³/s | Storage Volume m³ | Storage Elev.. m | |
| Bottom of Gallery | 0 | 0 | 332 | |||
| First Flush | - | - | - | - | - | - |
| 5 Year | - | - | - | 0.07 | 22 | 332.23 |
| 100 Year | - | - | - | 0.23 | 77 | 332.79 |
| Top of Gallery | 0.29 | 97 | 333 | |||
*Editor’s Note: The tables for Greenway Terrace 2000 and Terrace 3000 have been omitted for purposes of conciseness.
The attached drawings indicate the storage elevations for the "first flush," 5 year and 100 year design storms for Phase I.
The estimated "drawdown" time for the "first flush" storm is 8 hours, for the 5 year storm 10 hours and for the 100 year storm 11 hours.
Water quality
'Reasonable use' guideline MOE
The MOE 'Reasonable Use' guideline (Guideline B-7: The Incorporation of the Reasonable Use Concept into Groundwater Management Activities) was applied to this site to protect water quality.
Landscape strategy and vegetation
The following section presents the landscaping strategy for the Greenway System. The planting strategy has been designed to address concerns regarding the pre-treatment of stormwater runoff prior to infiltration to the groundwater system and the maintenance of the infiltration characteristics of the site.
The end-of-pipe control for the proposed development is provided by the Greenway System. Pre-treated runoff from the road network will be released to the Greenway at several locations. At each of these outlet points, a shallow (i.e., 30-45 cm deep) sediment forebay will be constructed to provide energy dissipation and additional removal of sediments, nutrients and heavy metals from the runoff.
Sediment forebay planting strategy
The sediment forebays will be graded with 0.3 m of lower permeability soils (i.e., organics) to retain stormwater for a longer duration providing opportunities for the creation of a wet-mesic meadow habitat. By providing a wet meadow habitat within the sediment forebays, water quality can be enhanced through a variety of processes such as:
- sedimentation and physical filtration through root entrapment and sediment stabilization;
- adsorption to wetland vegetation, substrates and organic detritus; and
- nutrient uptake by plant root systems.
The wet meadow concept provides increased ecological, habitat and visual diversity. It is a safe method of pre-treating runoff since no permanent standing water will be present.The following species that are tolerant of periodic short-term inundation with water have been recommended for planting within or around the margin of the wet meadow:
- Typical Trees: eastern white cedar, tamarack, green ash, trembling aspen, balsam poplar, red maple, silver maple.
- Typical Shrubs: red-osier dogwood, shrub willow spp., nannyberry, elderberry, chokecherry, Juneberry, grey dogwood, highbush cranberry, alternate-leaved dogwood.
The following low maintenance hydroseed mixture is recommended for ground cover establishment within the wet meadow:
- 25% Canada blue joint grass (Calamagrostis canadensis)
- 25% Rough-stalked meadow grass (Poa trivialis) or native substitute
- 20% Highland Colonial bentgrass (Agrostis capillaris) or native substitute
- 15% Creeping red fescue (Festuca rubra var. genuina)
- 5% Tall White Aster (Aster lanceolatus)
- 10% New England Aster (Aster novae-angliae)
The following native/non-invasive ground covers are recommended to supplement the above wet-mesic meadow seed mixture: sedge species, ostrich fern, virginia creeper, aster species, reed canary grass, tall manna grass, rattlesnake manna grass, common cattail.
Annual mowing with standard Parks and Recreation Department equipment following the release of plant seeds (i.e., fall) in the wet meadow/forebay areas is recommended to reduce biomass accumulation and maintain the infiltration characteristics of the site. Wetter areas within the sediment forebay area should be cut by hand rather than with a tractor to avoid disturbance to the vegetation and substrate. It should be noted that the annual detritus build up following mowing/dieback and subsequent decomposition is an important source of plant nutrients necessary to maintain the meadow system.
Balance of the greenway
Once the storage volume within the settling bays is exceeded, runoff will flow in a diffuse manner into the adjoining greenway. A sand filter will be installed in the base of the greenway to trap sediments and maintain the permeability of the underlying native soils. The greenway will be vegetated with a low maintenance, successional dry-mesic meadow seed mixture to maintain and enhance the infiltration characteristics of the site.
Micro-grading of the greenway is recommended to create a gently undulating appearance. This will provide a slower and rougher conveyance system to promote additional sediment/pollutant removal and nutrient uptake by plants.
Micro-variations in the topography of the bottom of the greenway and a variety of side slope grades (i.e., 3:1 - 6:1) will also provide enhanced visual, ecological and habitat diversity. A 3 metre wide maintenance access with a permeable base (i.e., crushed limestone) is proposed around the perimeter of the greenway terraces and sediment forebays, and would be suited for a pedestrian walkway.
The following low maintenance successional dry-mesic meadow seed mixture is recommended for hydroseeding within the balance of the greenway:
- 25% Canada blue grass (Poa compressa)
- 25% Creeping red fescue (Festuca rubra var. genuina)
- 25% Perennial ryegrass (Lolium perenne var. perenne)
- 10% Red clover (Trifolium pratense)
- 10% Black-eyed susan (Rudbeckia hirta)
- 5% New England Aster (Aster novae-angliae)
Random clusters of native trees and shrubs are also recommended within the greenway to provide habitat diversity, aesthetic value and visual buffering. The following tree and shrub species are recommended for planting within the dry-mesic meadow component of the greenway: (This is not intended to be an all-inclusive species list. Other native/non-invasive species can be considered for upland side slopes and top-of-bank areas.)
- Trees: Eastern white cedar, white pine, white spruce, white ash, trembling aspen, balsam poplar, large tooth aspen, sugar maple, white oak and bur oak.
- Shrubs: Elderberry, chokecherry, pin cherry, Juneberry, highbush cranberry, nannyberry, grey dogwood, red-osier dogwood and staghorn sumac.
Annual mowing with standard Parks and Recreation department equipment (as described above) is also recommended within this portion of the greenway to reduce the build up of detritus and maintain the infiltration characteristics of the site. (It should be noted that 75% of the dry-mesic meadow seed mixture is comprised of the same grass species used in standard MTO applications. This grass mixture is generally low growing (i.e., 25 cm - 40 cm in height), requires little maintenance (once a year cutting), is drought/salt resistant and is also tolerant of periodic short-term inundation from runoff.)
Sediment and erosion control plan
Prior to the start of construction activity, silt fencing will be installed along the property boundary. The silt fence will serve two purposes. The first will be to eliminate the opportunity for water borne sediments to be washed on to the adjacent properties. The second will be to delineate the environmental protection zones for trees and vegetation around the perimeter of the site. The ecologist will flag the location of the silt fence with the contractor to ensure that the drip line and root zones are protected.
Two types of silt fence will be used. Type 1 silt fence is a geotextile material attached to wooden stakes. Type 2 silt fence is steel T-bar fence posts with wire fencing to which a geotextile material will be attached. The Type 2 fencing will be placed in the more critical environmental preservation areas such as along the Torrance Creek/Hamilton Corners Wetland kettle formations and along the Norway Spruce hedgerow on the townhouse block (formerly commercial) in the northwest corner of the site near Gordon Street.
Once catchbasins or ditch inlets connecting to the infiltration galleries have been installed, the grates will be wrapped in filter cloth. This feature will be maintained until all building and landscaping has been completed in the individual drainage catchments.
A temporary berm will be placed at the upstream end of the first phase to prevent sediments from the following phases from contaminating the finished works. The procedure described above will be repeated for each phase of development.
Inspection and maintenance of all silt fencing and the temporary sediment pond will start after installation is complete. The fence and/or ponds will be inspected on a weekly basis or after a rainfall event of 13 mm or greater. Maintenance will be carried out, within 48 hours, on any part of the facility found to need repair.
Monthly reports on the condition of the sediment and erosion control measures will be submitted to the City of Guelph and the Grand River Conservation Authority.
Once all construction and landscaping has been substantially completed in a development phase, the sand filter will be inspected and any contaminated material removed. The sand filter will then be re-constructed and the final grading completed. The distribution/gallery system will then be installed and the terrace topsoiled and planted.
After construction of the complete development, erosion will not occur and sediment transport will be minimal. The swale drainage in the rear lot areas will be as flat as possible to minimize flow velocities. Sediment forebays at the storm sewer outlets will provide energy dissipation and sediment removal.
Maintenance plan
A two-phase maintenance plan is recommended. Phase I will address the short-term, more intensive maintenance necessary during and immediately after construction. Once all landscaping has been completed, maintenance will shift to Phase II.
Phase I will include weekly inspections of all sediment control devices plus "as needed" inspection after any rainfall event exceeding 13 mm, with repairs completed within 48 hours of any damaged works and the collection of captured sediment. This work will be carried out by the consultant on behalf of the owner during the construction of the works. A monthly status report will be prepared and distributed to the City and the Conservation Authority.
Phase II will be the maintenance carried out by the City after all construction has been completed. This work will include the following:
- The catchbasin sumps and the oil/grit type manholes will require pumping and cleaning twice a year (spring and fall) to remove accumulated silt.
- The sediment forebay areas will require a yearly visual inspection to determine sediment accumulation. When sediment removal is required, the surface of the forebay should be removed, the sand filter restored, and the recommended vegetation replanted.
- The remaining surface in the greenway should be mowed once a year. After many years, some areas of the terrace bottom may show signs of silt accumulation. If so, the surface should first be aerated. If this does not restore the infiltration characteristics, then the surface of the sand filter should be removed, re-constructed, topsoiled and reseeded with the recommended vegetation.
- The gallery system should be inspected regularly to ensure the system is draining. The inlets should be inspected seasonally to ensure that there is no blockage by leaves and debris.
- The road grades throughout the development are flat (0.5%). The City of Guelph should re-evaluate their winter sanding practices to minimize the application within this development. This will reduce the potential impact from chlorides and sediments being directed to the greenway terrace system.
Conclusions
The stormwater management system has been designed to collect, clean, filter and recharge all the runoff up to the 100 year design storm within the boundaries of the development. Reserve capacity has been provided in the freeboard of the greenway terraces to store and attenuate more severe rainfall events such as the Regional Storm. The greenway system also creates an amenity for passive recreation by the residents.
From the foregoing analysis, the following conclusions are drawn:
-
The lot level controls will collect and infiltrate the runoff from roofs and rear lot drainage catchments, for all storms up to the 5 year event, through a rear lot swale/infiltration gallery system.
This will reduce the volume of runoff directed to the greenway. It will also separate the cleaner roof and yard runoff from the potentially more contaminated runoff generated on the street right-of-way.
-
Oil/grit separators (pre-treatment controls) can pre-treat the road runoff prior to discharge to the greenway by removing sediments. This, in turn, will minimize any long-term deterioration of the infiltration function.
The use of infiltration techniques on the municipal right-of-way is not recommended because of the limited ability to pre-treat the runoff.
-
The greenway system has been designed as a stand-alone system. The greenway terraces have the capacity to retain, filter and infiltrate the full range of design storms (up to the 100 year events) from the entire development. The "first flush" storm will infiltrate through the bottom of the greenway terraces. The larger design storms will be partially infiltrated and partially conveyed to the inlet distribution/gallery system for more rapid recharge.
Under winter operating conditions, the greenway terrace system has the capacity to retain and infiltrate the runoff generated by a 100 year design storm.
- The proposed stormwater management system for this development will maintain the existing surface and groundwater divides for all design storms up to and including the 100 year event.
-
Under Regional Storm conditions, the freeboard provided in the greenway terraces (approximately half the total storage depth) will provide further attenuation and storage prior to overflow to either Gordon Street in the west or the kettle to the east. This storage and attenuation will reduce the Regional Storm flows released from the site below pre-development levels.
Any flows released from the site at Gordon Street will be directed to the north to match the existing drainage patterns. When development occurs to the south of this site, the City of Guelph and the Grand River Conservation Authority can consider re- directing the Regional Storm flows to the extended greenway system being proposed on those lands.
- The major/minor system has the capacity to convey storm runoff to the greenway system under all rainfall events.
- Development of this site will provide a net improvement to the water quality in the area by bringing sanitary services to existing residences and by reducing the amount of fertilizer and herbicides applied relative to the current agricultural practices.
- Environmental management measures have been specifically developed to provide a high level of protection for vegetation and wildlife habitat features adjacent to the site. These measures include protective fencing, erosion and siltation control, infill plantings, naturalized buffer zones and a public education/awareness program.
- The landscaping strategy for the Greenway System has been designed to address concerns regarding the pre-treatment of stormwater prior to infiltration to the groundwater system and the maintenance of the infiltration characteristics of the site. In addition to improving stormwater quality, the planting strategy has been developed to enhance habitat diversity and aesthetic value, and to provide passive recreational opportunities for the future residents of the proposed development.
In our opinion, the proposed stormwater management system meets the intent of the Hanlon Creek Watershed Plan and the Watershed Management Strategy for Hanlon Creek and its Tributaries.
References for design example 3 [editor’s note: some references may be out of date]
- Braun Consulting Engineers and Jagger Hims Limited, 1991. Water Supply Study, Phase 1, Prepared for the City of Guelph Engineering Department.
- Canadian Council of Resources and Environmental Ministers, 1987. Canadian Water Quality Guidelines.
- Department of Environmental Programs, Metropolitan Washington Council of Governments. Analysis of Urban BMP Performance and Longevity in Prince George’s County, Maryland.
- Ecoplans Ltd., 1993. Environmental Impact Statement, Ariss Glen Developments Ltd., City of Guelph, Torrance Creek/Hamilton Corners Class 2 Wetland Complex.
- Galli, J., 1989. Peat-sand Filters: A Stormwater Management Practice for Urbanized Areas. Department of Environmental Programs, Metropolitan Washington Council of Governments.
- Gamsby and Mannerow Ltd., Cumming Cockburn Ltd. and Code, MacKinnon Ltd., 1993. A Watershed Management study for the Upper Hanlon Creek and its Tributaries.
- Grand River Conservation Authority, 1982. Storm Water Management Guidelines.
- Karrow, P. F., 1968. Pleistocene Geology of the Guelph Area. Ontario Department of Mines Geological Report 61.
- Karrow, P. F., et al, 1979. Bedrock Topography, Guelph Area, Southern Ontario. Ontario Geological Survey Preliminary Map P-2224.
- Karrow, P. F., 1987. Quaternary Geology of the Hamilton-Cambridge Area, Southern Ontario. Ontario Geological Survey Report 255.
- Klein, R. D., 1990. Protecting the Aquatic Environment from the Effects of Golf Courses. Community and Environmental Defense Associates.
- Kubota, J., Mills, E. L., and Oglesby, R. T., 1974. "Lead, Cd, Zn, Cu and Co in Streams and Lake Waters of Cayuga Lake Basin, New York". Eviron. Sci. Technol. 8: 243-248.
- Marsalek, J., May 1993. Laboratory Testing of Stormceptor I. National Water Research Institute, Environment Canada.
- Marsalek, J., Long, R., and Doede, D., October 1994. Laboratory Development of Stormceptor II. National Water Research Institute, Environment Canada.
- Marshall Macklin Monaghan Ltd., 1991. Final Report on Stormwater Quality Best Management Practices. Prepared for the Ministry of the Environment.
- Marshall Macklin Monaghan Ltd., June 1994. Stormceptor Modelling Study.
- Marshall Macklin Monaghan Ltd., June 1994. Stormwater Management Practices Planning and Design Manual. Ontario Ministry of Environment and Energy.
- Marshall Macklin Monaghan Ltd. and LGL Ltd., 1993. Hanlon Creek Watershed Plan. Final Report.
- Ministry of Natural Resources, 1992. Wetland Planning Policy Statement.
- Ontario Ministry of the Environment, 1986. Incorporation of the Reasonable Use Concept into MOE Groundwater Management Activities. MOE Policy Manual, Policy No. 15-08-01.
- Ontario Ministry of the Environment, et al, 1991. Interim Stormwater Quality Control Guidelines for New Development.
- Ontario Ministry of Natural Resources, et al, 1987. Urban Drainage Design Guidelines Manual.
- Ontario Ministry of Transportation, 1989. Drainage Management Technical Guidelines.
- Schueler, T. R., 1987. Controlling Urban Runoff: A Practical Manual for Planning and Design of Urban BMP's. Metropolitan Washington Council of Governments.
- Smith, Alan A., Inc., 1989. MIDUSS User’s Manual.
- Steele, K. F. and Wagner, A. H., 1975. "Trace Metal Relationships in Bottom Sediments of a Freshwater Stream – The Buffalo River, Arkansas". J. Sediment. Petrol. 45: 310-319. (cited in U.S. EPA 1979).
Figure I.10: General Plan showing the Layout of Phase I of the Subdivision
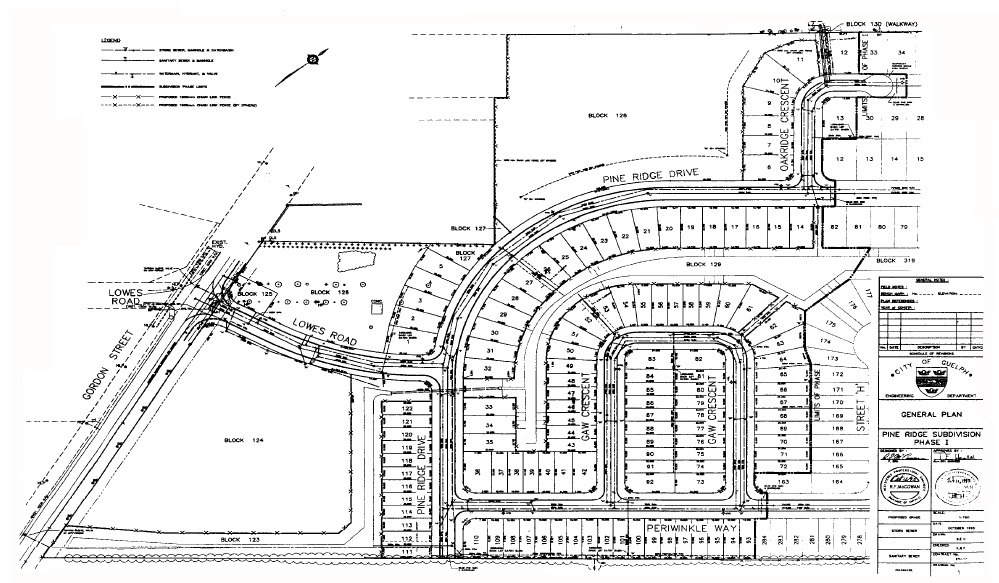
Figure I.11: Plan and Profile Drawing showing Construction Details for the End-of-pipe Greenway System
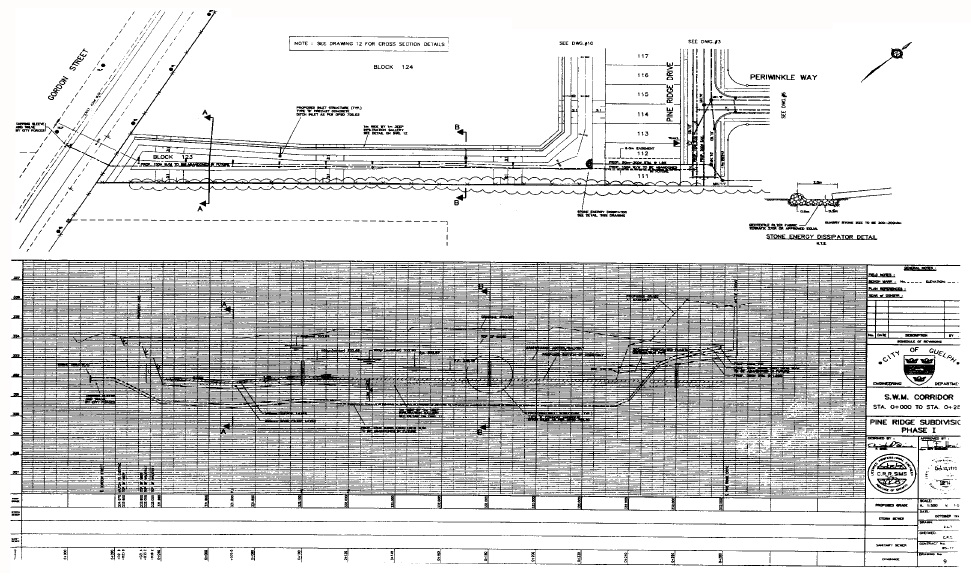
Figure I.12: Plan and Profile Drawing showing Construction Details for the End-of-pipe Greenway System
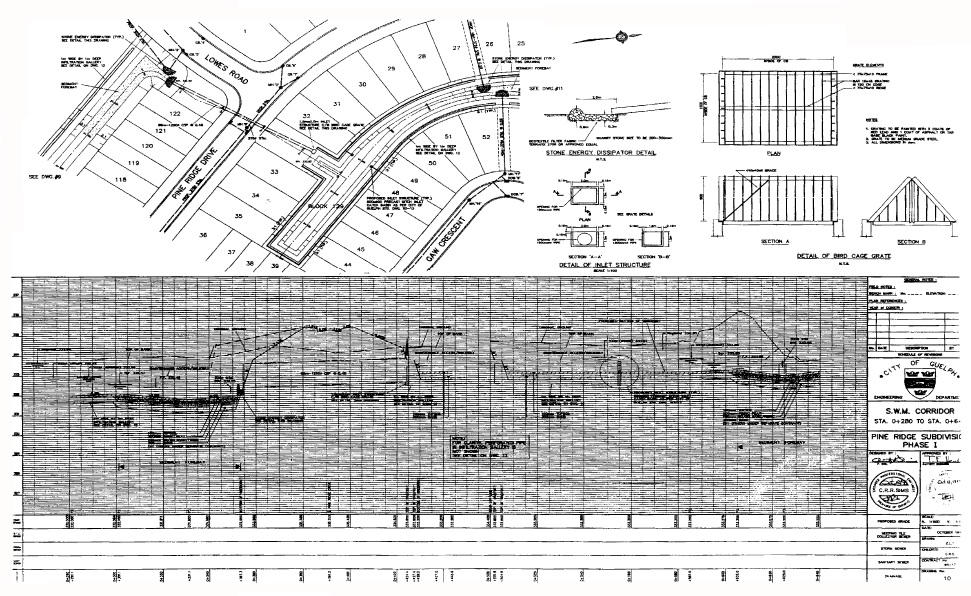
Figure I.13: Plan and Profile Drawing showing the Construction Details for the End-of-pipe Greenway System
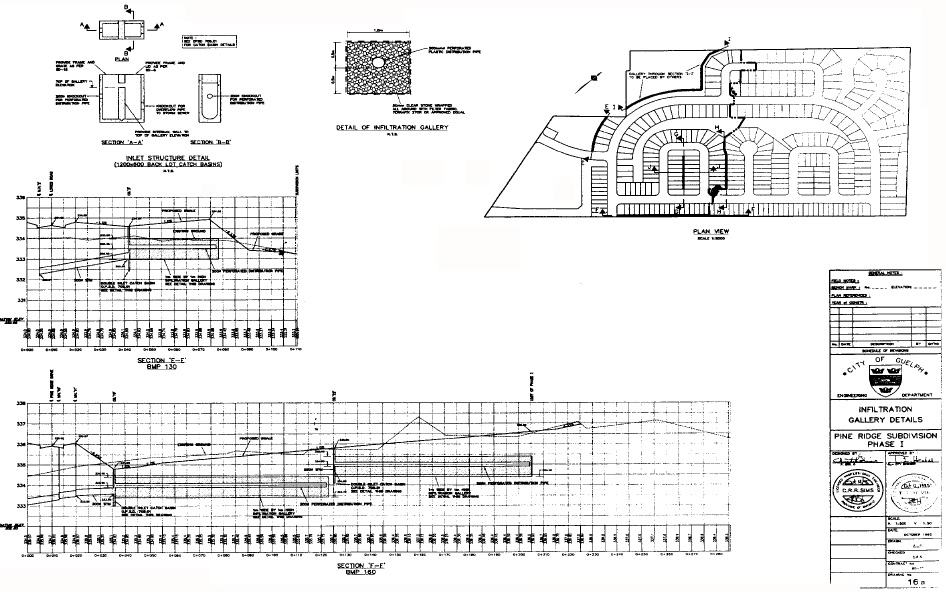
Figure I.14: Plan and Profile Drawing showing the Construction Details for the End-of-pipe Greenway System
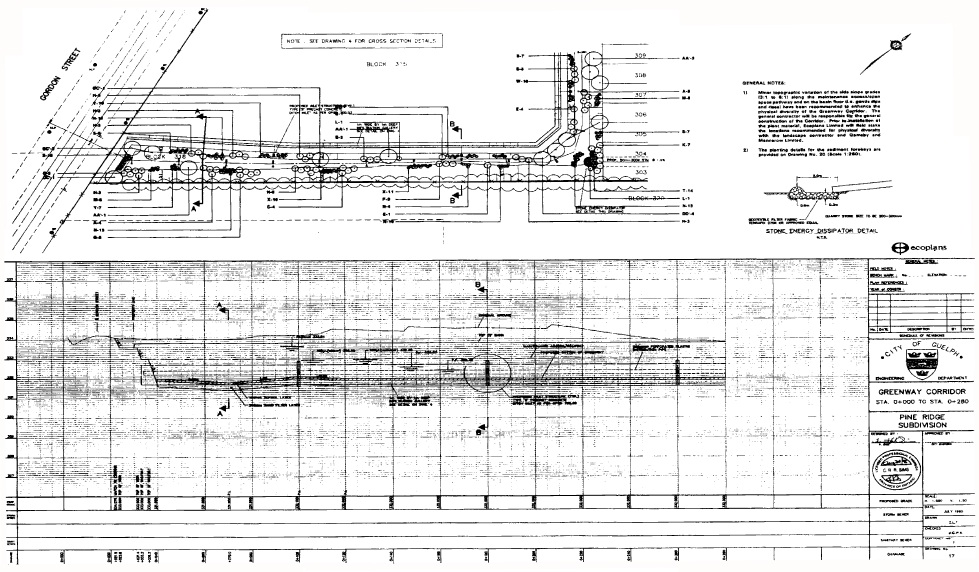
Figure I.15: Plan showing Details of the Rear Lot Infiltration Gallery System
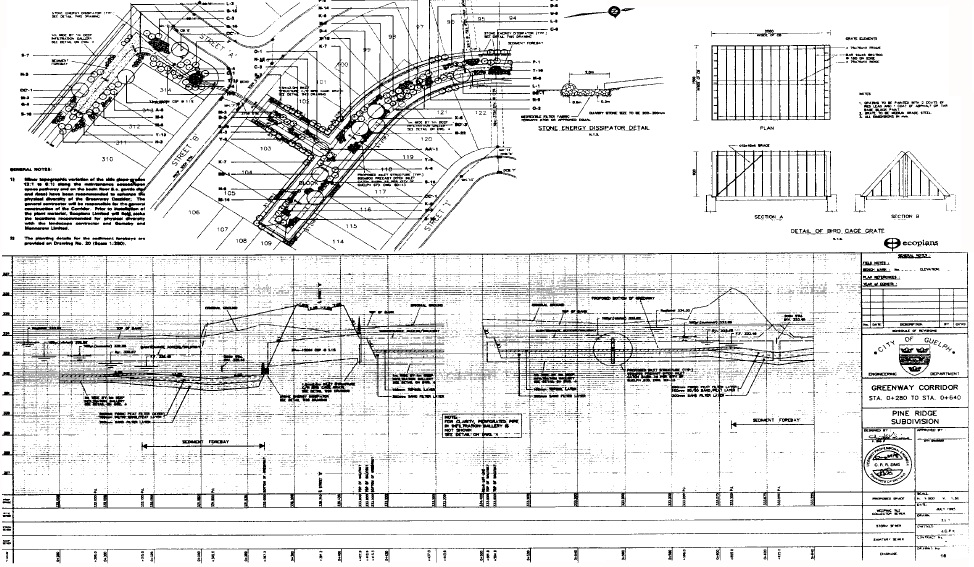
Figure I.16: Landscaping Details for the End-of-pipe Greenway System