Estimating soil erosion by water in Ontario
Learn how to estimate soil movement and loss due to water erosion on Ontario farmland. This technical information is for Ontario producers.
ISSN 1198-712X, Published January 2023
Introduction
This fact sheet discusses the differences between the USLE and RUSLE2 for Ontario and introduces mapping tools available in AgMaps to estimate soil movement and loss due to water erosion on Ontario farmland.
RUSLE2 (U.S.)
RUSLE2 refers to version 2 of the Revised Universal Soil Loss Equation. It is a software program that estimates long-term average soil loss, sediment yield and sediment characteristics from rill and interrill (sheet and rill) erosion caused by rainfall and related overland flow.
Like its predecessor, the Universal Soil Loss Equation (USLE), RUSLE2 is used in the U.S. to guide conservation planning, inventory erosion rates over large areas and estimate sediment production on upland areas that enter and silt up streams and lakes.
RUSLE2 relies on a statistical approach to estimate soil loss. Its calculations are based on 10,000+ plot years of field observations, and more than 2,000 runs of rainfall simulation observations from standard soil erosion plots, to estimate soil losses from actual field and site situations.
With proper input and related datasets, RUSLE2 can estimate soil loss from:
- cropland
- pastureland
- forestland
- construction sites
- mined land
- reclaimed land
The following websites help American RUSLE2 users with the general operation of the program and interpreting results. They also contain useful background information for other users of RUSLE2 around the world, including Canada:
- The RUSLE2 website provides information on the development and use of the software in the U.S.
- The Natural Resources Conservation Services Internet site for RUSLE2 contains the official NRCS version of RUSLE2.
RUSLE2 for Ontario
RUSLE2 for Ontario is the same software program that is used and distributed in the U.S., but it includes only the datasets specifically assembled to represent the Ontario environment. This makes RUSLE2 more applicable for use in the Ontario context.
Contact us to get a copy of RUSLE2 for Ontario software and access to training videos.
Training videos
5 training videos are available to help you become comfortable with using RUSLE2 for Ontario.
Watch Module 1 to learn how to install the software.
The other modules will help you familiarize yourself with the commonly used RUSLE2 input screens:
- Module 1: getting started with RUSLE2 for Ontario
- Module 2: making a simple soil erosion rate estimate using the “profile” view in RUSLE2 for Ontario
- Module 3: representing crop rotations in RUSLE2 for Ontario
- Module 4: describing complex hillslopes in RUSLE2 for Ontario
- Module 5: comparing alternative soil management practices in RUSLE2 for Ontario
Switching from USLE to RUSLE2 for Ontario
Since the USLE is a relatively simple equation, it is routinely used in Ontario for many erosion-related investigations. RUSLE2 for Ontario is a “next-generation” product that, while more complex, overcomes a number of the USLE’s limitations.
The USLE is only capable of estimating a long-term average annual erosion rate. RUSLE2 for Ontario can generate estimates of long-term average seasonal, even daily, erosion rates. This is valuable information as much of the sediment loading to Ontario waters occurs during the non-growing season (November through April). By breaking down soil loss estimates by season, we can better identify the seasonal effectiveness of best management practices for protecting the soil and reducing the sedimentation of our watercourses.
There are many different management and tillage practices that farmers use on their farms. RUSLE2 for Ontario, with its introduction of the “Management Practice Factor” approach, has the ability to describe these different field practices in much more detail than is possible with the USLE’s old C factor. The downside to this is that RUSLE2 for Ontario requires more detailed management information input by the user. Tables of RUSLE2 for Ontario annual management practice factor values are available for some of the more common cropping and tillage combinations applied in Ontario. Contact us to get this table.
RUSLE2 for Ontario also has the capability of estimating the soil saving benefits of select erosion control practices such as vegetated filter strips, buffers and silt fences.
RUSLE2 for Ontario can more easily estimate soil movement and loss along complex hill shapes. Field hillslopes are generally not simple, “uniform” or “straight line” slopes as is typically described in the USLE. They are often convex, concave or S-shaped. Read Measuring field slopes for nutrient management and conservation planning for more detailed information on hillslope shapes and how to define and measure them.
A hillslope’s shape affects the rate of soil erosion and deposition along a slope’s length. The sediment load leaving the bottom of the hillslope depends on how much erosion and deposition occurred along the entire hillslope length. RUSLE2 for Ontario users can describe these more complex slope characteristics by selecting the OMAFRA Segmented Slope user template in RUSLE2. RUSLE2 for Ontario will estimate the erosion rate at each point along the hillslope’s length as well as the sediment load leaving the bottom of it.
RUSLE2 for Ontario has other tools that help assess soil quality. For example, the Soil Conditioning Index (SCI) scores the ability of specific crop production and management practices to build or deplete soil organic matter levels. This is useful for assessing soil health, understanding the long-term effects on soil health of harvesting biomass or for demonstrating a farm’s sustainable practices.
Estimating soil erosion using AgMaps
OMAFRA developed an online water erosion potential mapping tool that estimates and displays rill and inter-rill (sheet and rill) water erosion rates two-dimensionally across a field. It can be applied anywhere in Ontario where soil mapping exists. This tool is accessed through OMAFRA’s online geoportal, AgMaps.
The Water Erosion Potential Mapping Tool can be accessed by clicking on the “Mark-up & Printing” tab in AgMaps and then navigating to the “Create Map” icon. Clicking on the “Create Map” option will display a list of mapping tools within AgMaps, including the Water Erosion Potential Map tool found near the bottom of this list. Click on that option and you can begin to delineate your field of interest and prepare a variety of erosion risk and soil erosion estimation maps. For example, by entering an appropriate “Management Practice Factor” value or annual “C Factor” for the field of interest, a two-dimensional map of the estimated annual inter-rill and rill (sheet and rill) erosion rate can be prepared. By entering Management Practice Values for “alternative” or “planned” management practice options, estimates can be made of the change in erosion rates possible by implementing these alternative best management practices on the field.
The following are examples of maps that can be prepared using this special mapping feature in AgMaps.
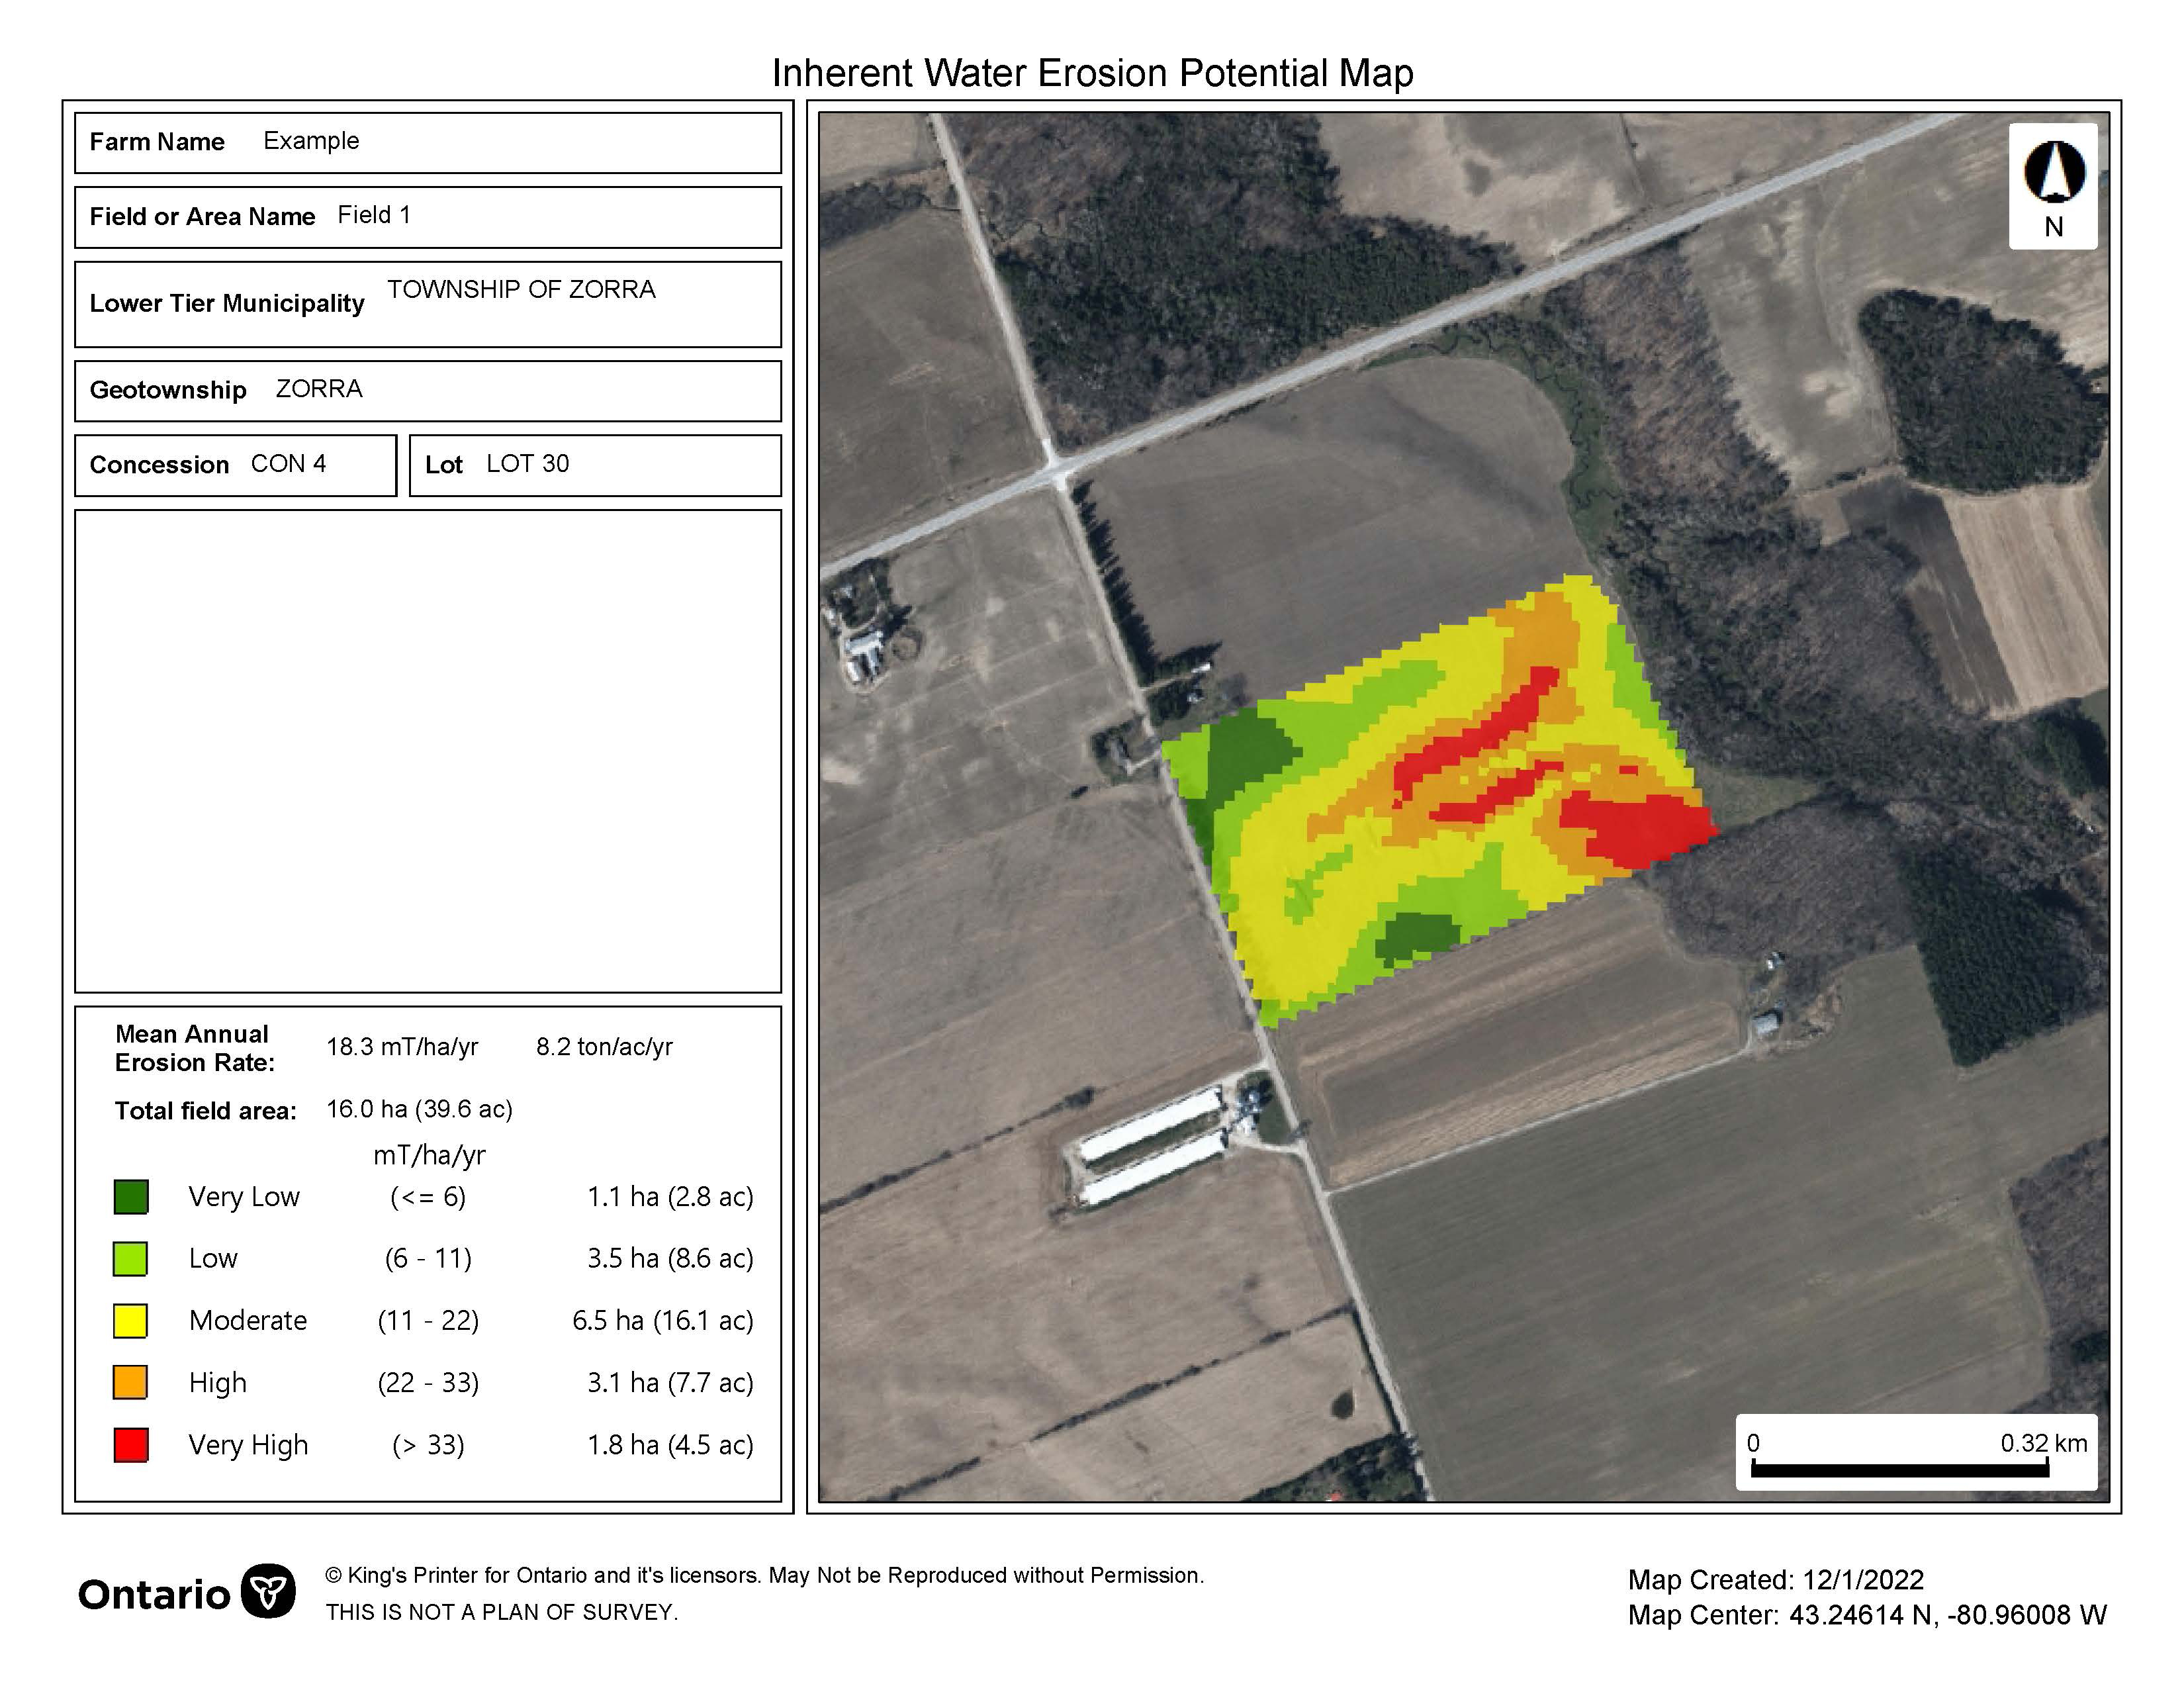
Inherent water erosion potential “risk” map
This map (Figure 1) shows the inherent or natural susceptibility of the field to soil erosion by water given the soil and landscape characteristics of the site. Management practices (tillage and cropping practices) are not considered in this map. The management practice factor is assumed to be 1 (that is, no practices, in other words, or bare soil conditions).
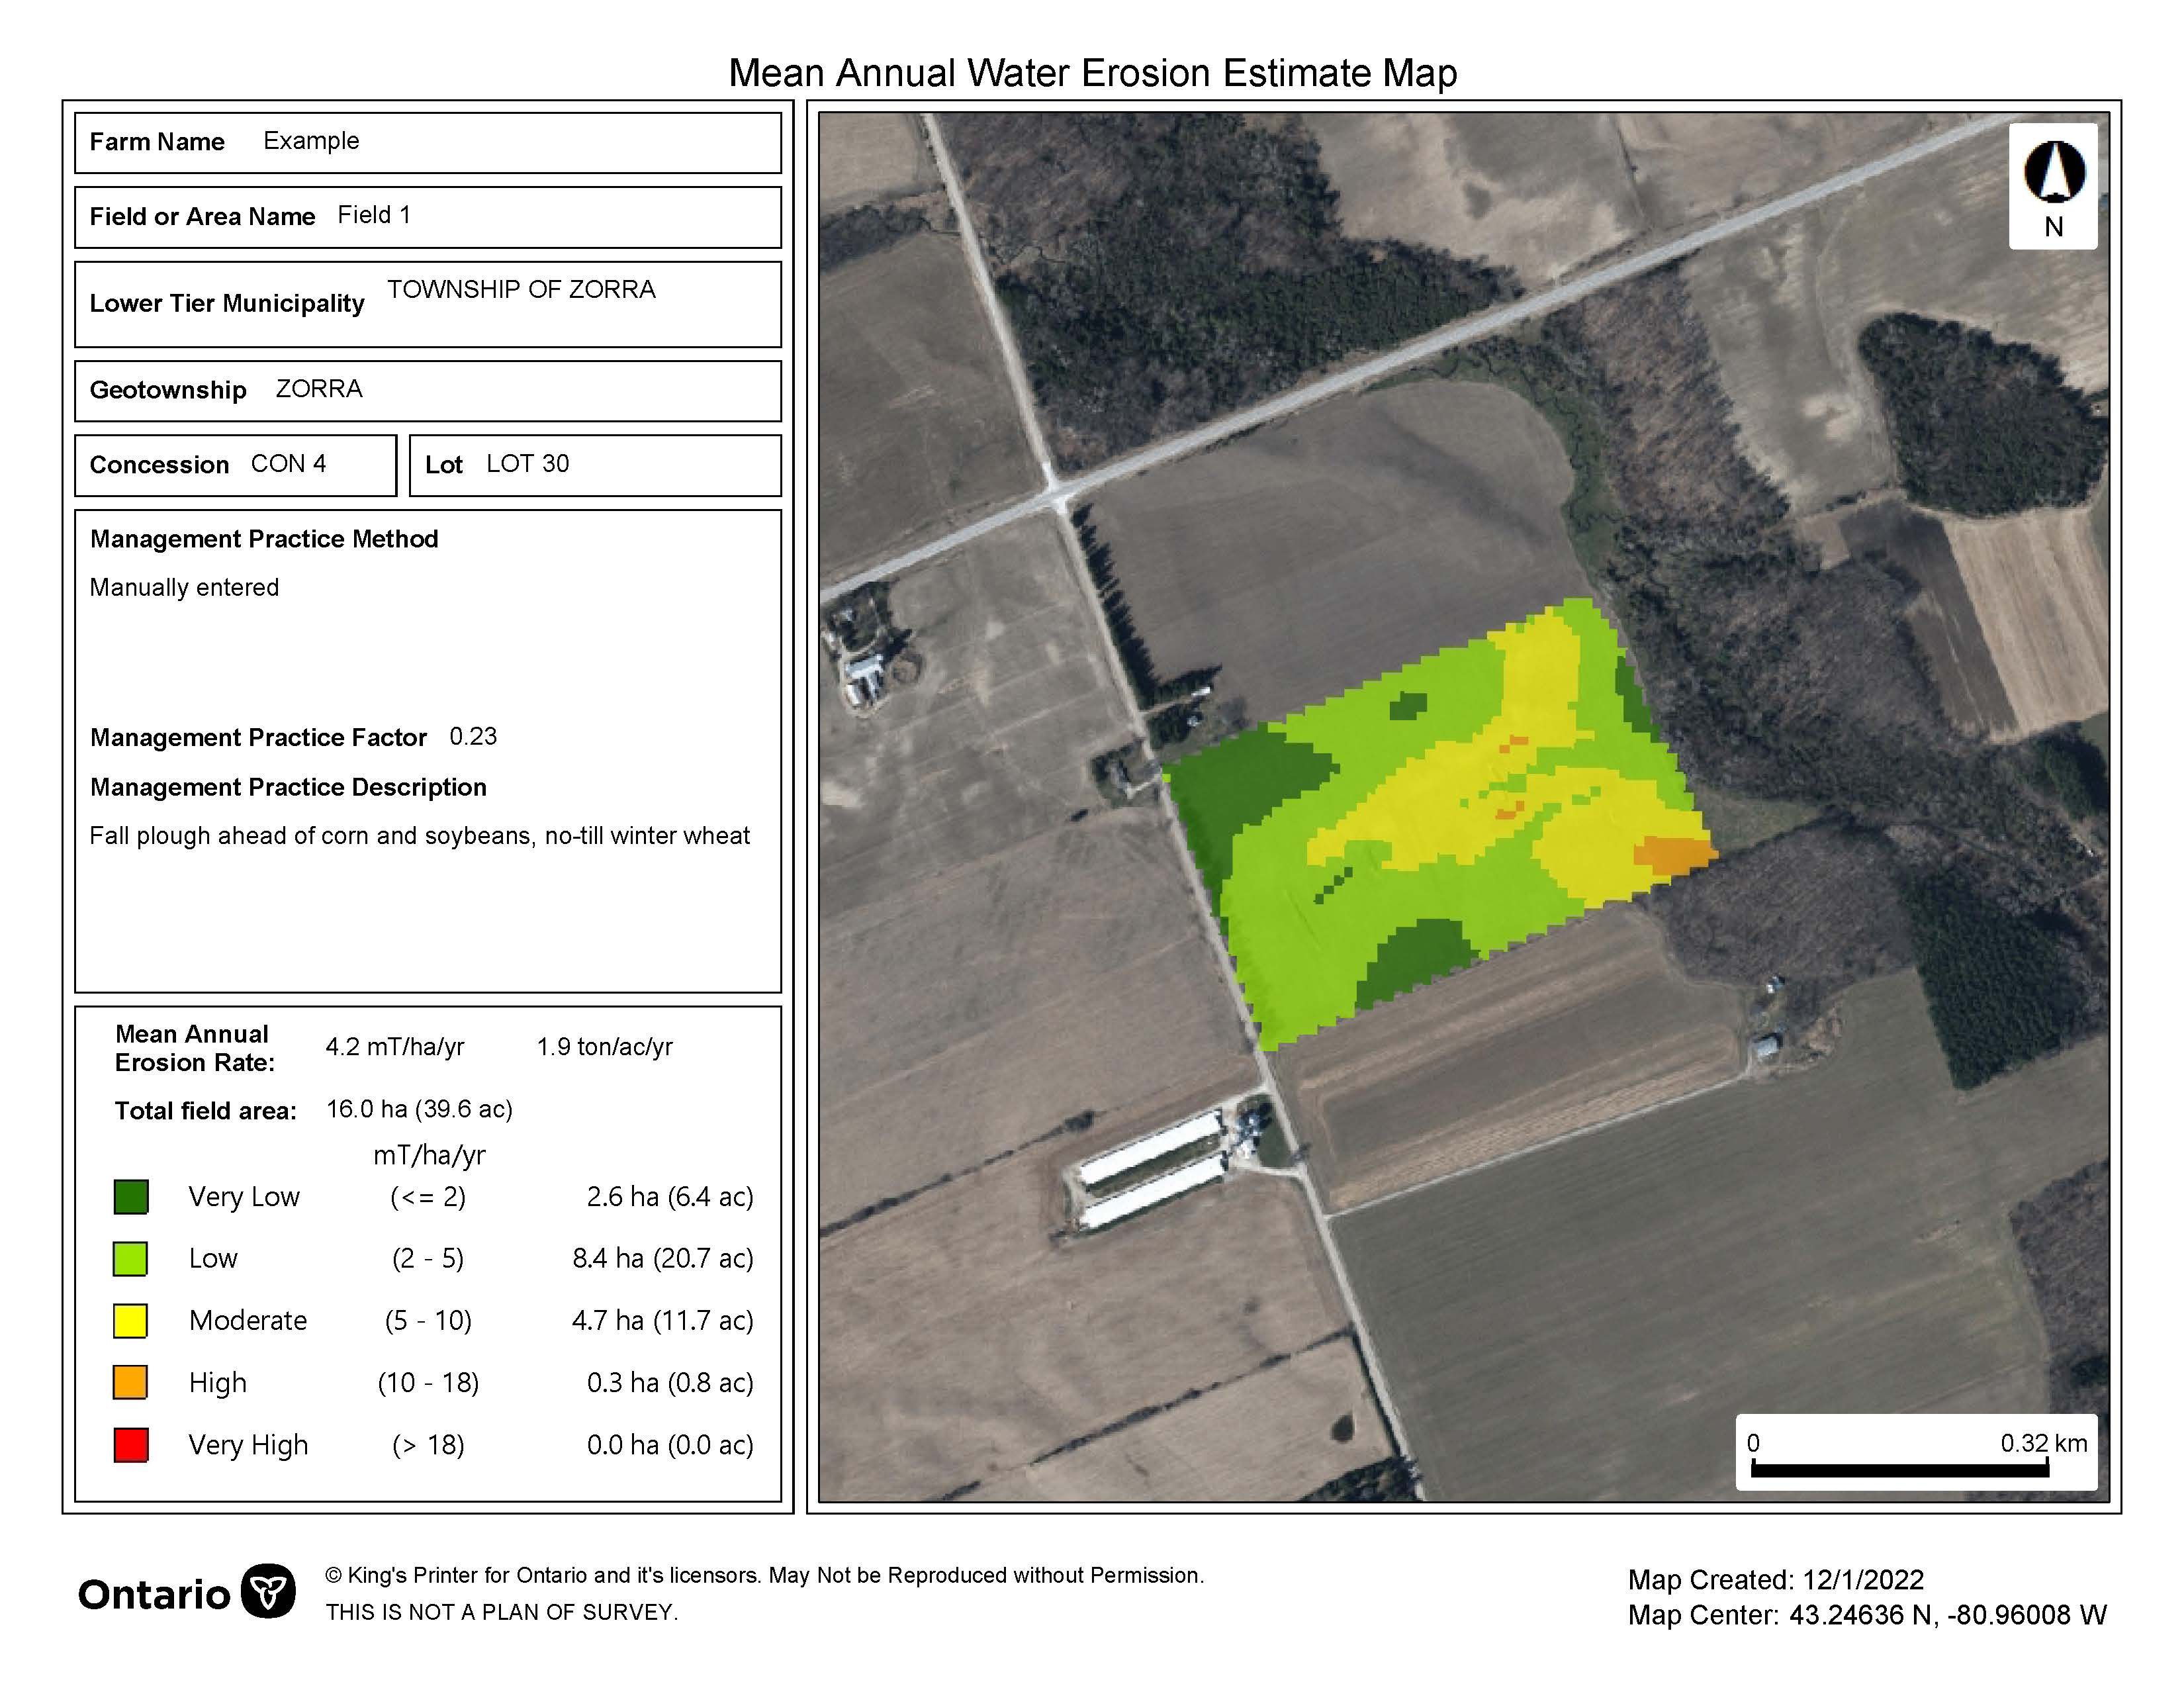
Mean annual water erosion “estimate” map
This map (Figure 2) takes information describing the tillage and cropping practices currently being used on the field (for example, the current RUSLE2 “Management Practice Factor” or USLE “C Factor” for the field) and uses it to recalculate erosion estimates across the field. The influence that different tillage and cropping choices have on a field’s erosion rates can be determined by entering management practice values or C factor values that best represent the tillage and cropping practices happening on, or proposed for, the field.
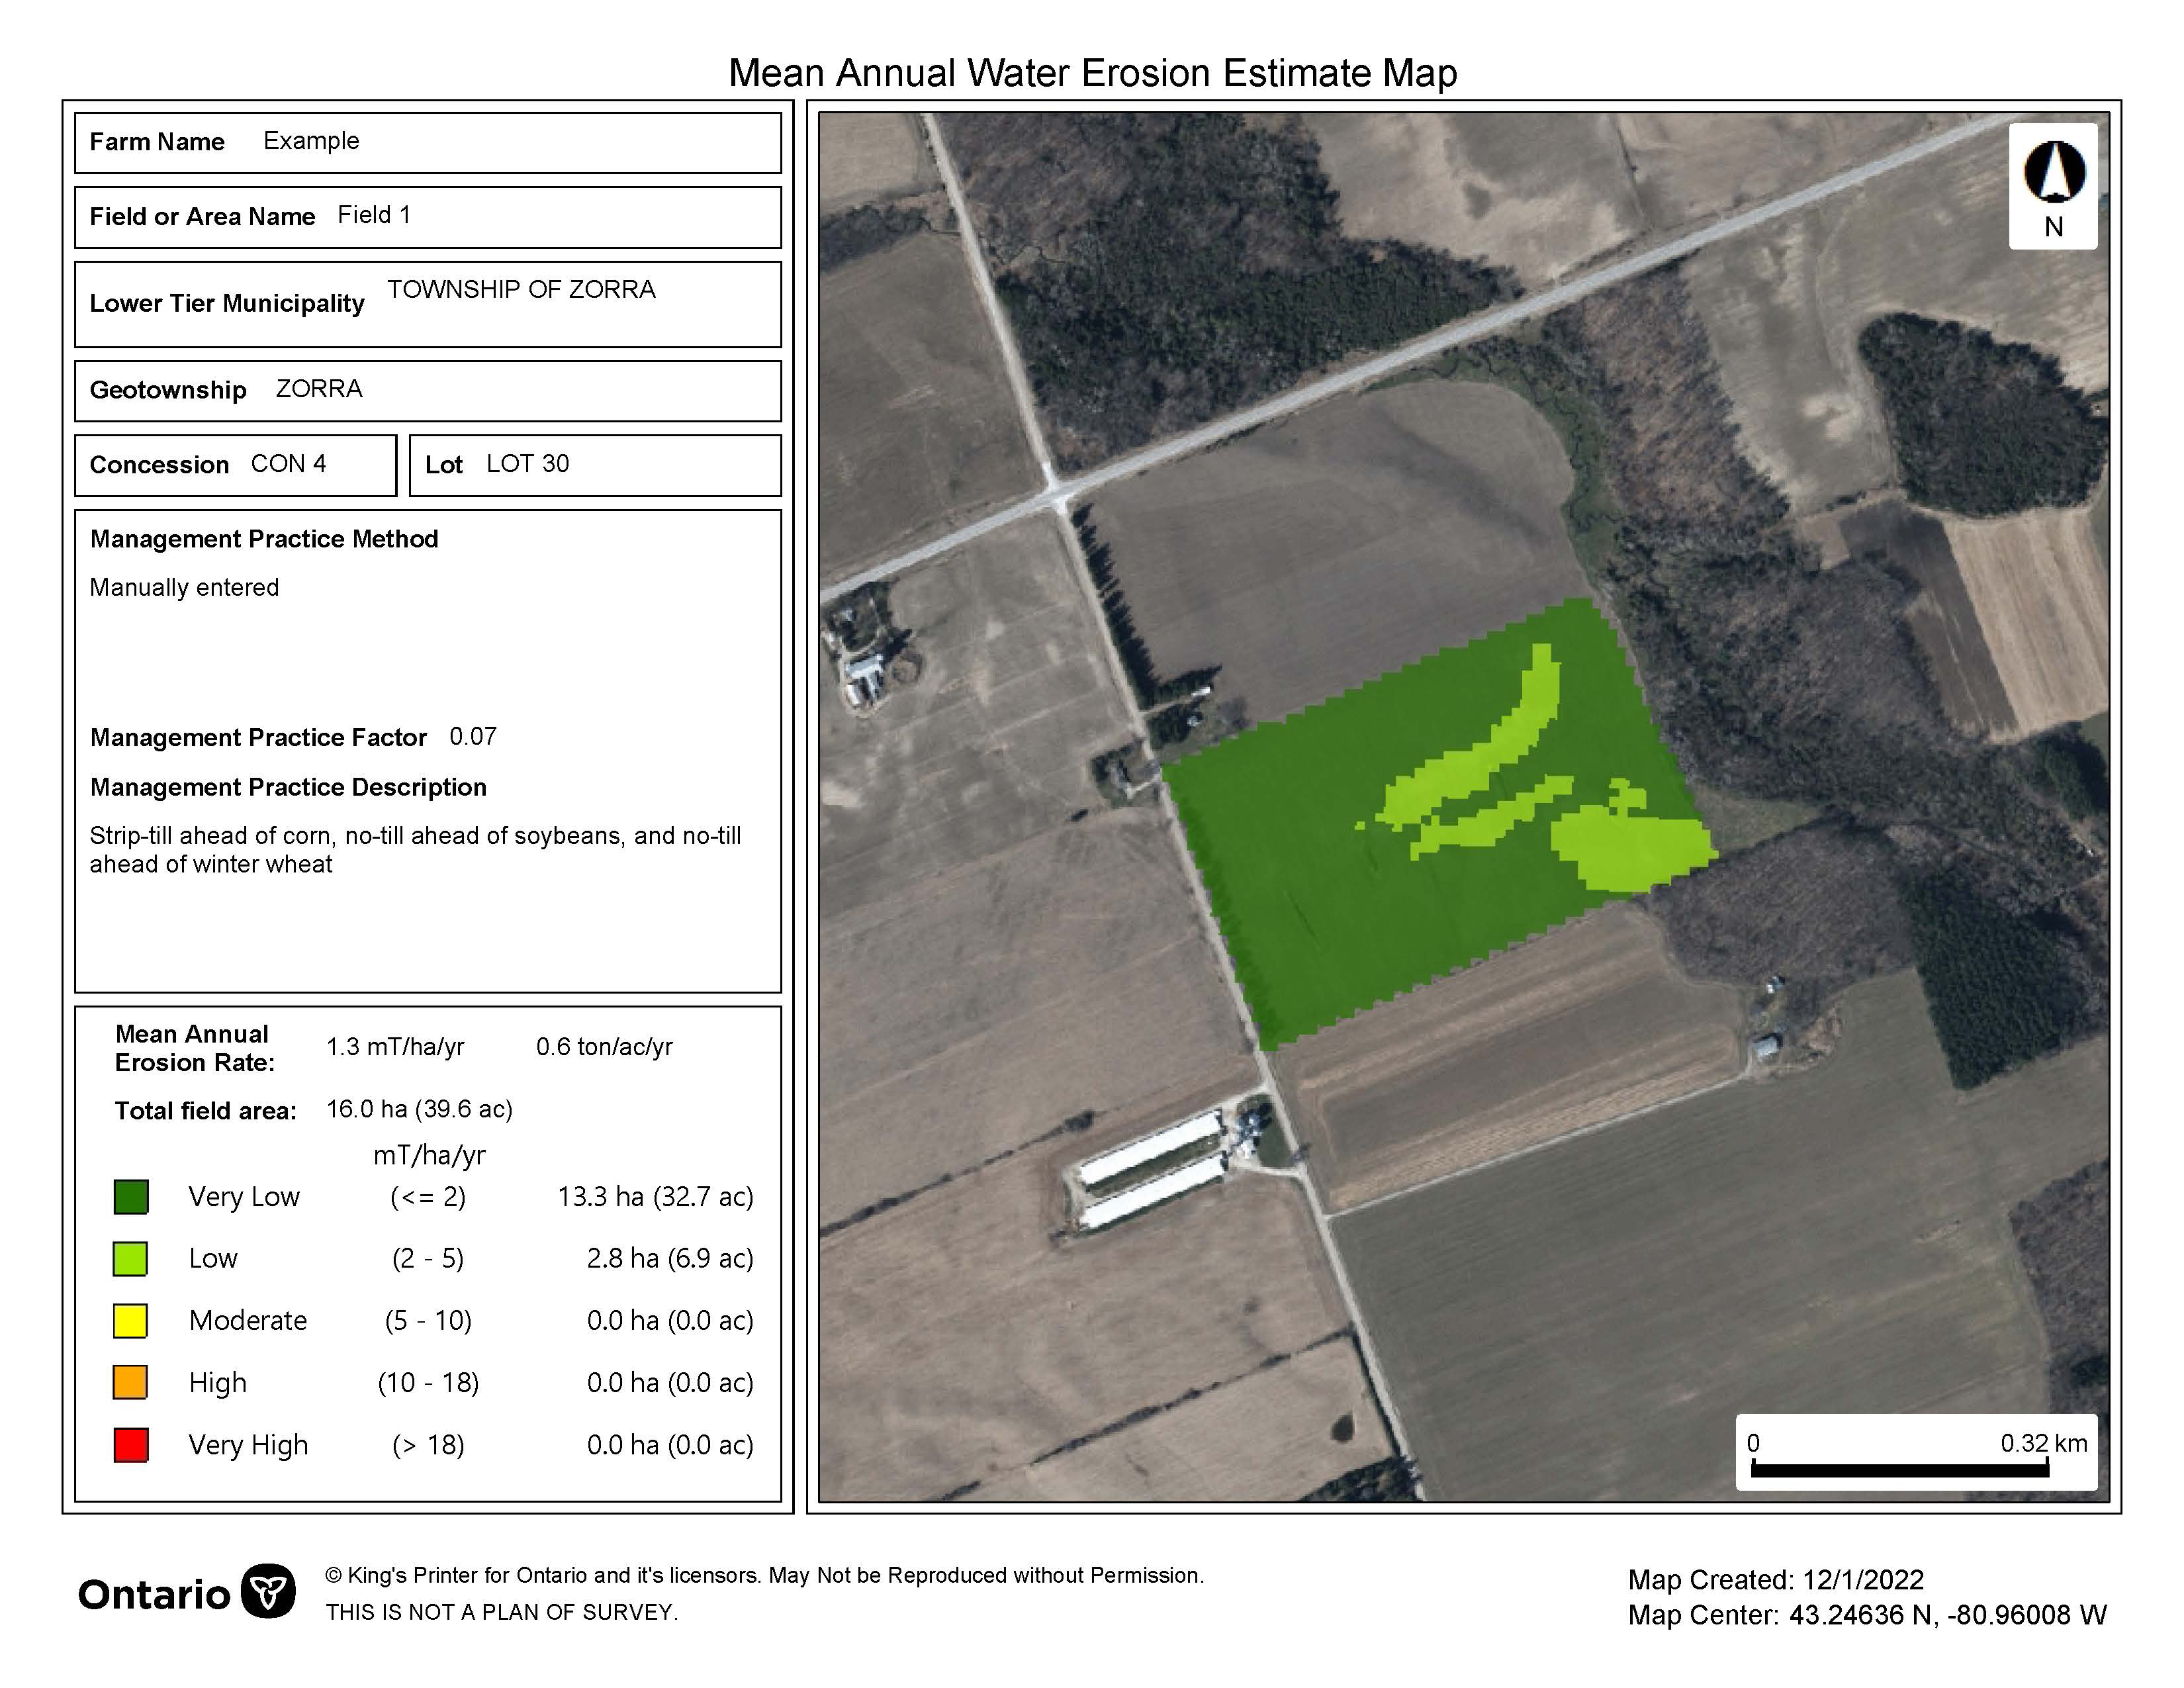
In Figures 2 and 3 for example, both maps assume the landowner is following a corn-soybean-winter wheat rotation. Figure 2 presents the current field practices where the land is moldboard ploughed in the fall and cultivated in the spring ahead of both the corn and soybean crops. Figure 3 considers a conservation practice change that could be made whereby the corn is established using strip tillage methods, and the soybeans are no-tilled into the corn stubble. In both cases, the winter wheat is no‑tilled into the soybean stubble in the fall.
In comparing the map presented in Figure 2 with the map in Figure 3, it is possible to evaluate the erosion rate reduction that can be expected from these proposed changes in tillage practices ahead of the corn and soybeans.
Contact us
If you need help setting up RUSLE2 for Ontario or preparing erosion maps in AgMaps, or have other questions related to soil erosion by water, contact the Agricultural Information Contact Centre:
- ag.info.omafra@ontario.ca
- toll-free:
1-877-424-1300
We will connect you with a technical specialist.
This fact sheet was written by Kevin McKague, P. Eng., water quality engineer, OMAFRA.