This page is no longer current and is provided for archival and research purposes.
Read the most recent information.
Canadian Ambient Air Quality Standards
In May of 2013 the federal government published the Canadian Ambient Air Quality Standards (CAAQS) as non-binding objectives under the Canadian Environmental Protection Act. The CAAQS were developed under the auspices of the Canadian Council of Ministers of the Environment (CCME) as outdoor air quality targets that “set the bar” for air quality actions across the country.
The CAAQS replaced the existing Canada-wide Standards (CWS) for ozone and PM2.5 in 2013 by setting stricter targets, and introducing an annual standard for PM2.5. An annual standard helps protect human health from long-term or chronic exposure to fine particles. The purpose of the CAAQS is to drive continuous improvement in air quality. In 2015, provinces and territories were formally required to report ambient air quality measurements against the CAAQS. Table 1 shows the 2015 standards for achieving the CAAQS.
| Ozone 8h | PM2.5 24h | PM2.5 Annual |
|---|---|---|
| 63 ppb(1) | 28 μg/m3(2) | 10 μg/m3(3) |
(1) based on the annual 4th highest daily maximum eight-hour running average, averaged over three consecutive years.
(2) based on the 98th percentile measurement annually, averaged over three consecutive years.
(3) based on the annual mean averaged over three consecutive years.
The influence of transboundary flow - weight of evidence analysis
Outdoor concentrations of ozone and PM2.5 can be influenced by emission sources that are outside the control of provinces and territories, such as transboundary flows and exceptional events including forest fires. The CCME Guidance Document on Achievement Determination for the Canadian Ambient Air Quality Standards for Fine Particulate Matter and Ozone (2012) guides provinces and territories in the consideration of transboundary flows and exceptional events when implementing management actions, and in conveying to the public that a CAAQS was not achieved as a result of these influences.
Transboundary influences, mainly from the U.S., account for a significant portion of Ontario’s smog when their levels are higher. Emission reductions in Ontario and the U.S. have contributed to decreases in PM2.5 and ozone concentrations. However, while ambient concentrations have improved, the province continues to experience high levels of ozone due to both transboundary air pollution and increasing global background levels, which has contributed to exceedances of the ozone standard. It is therefore important to consider the influence of transboundary flows using WOE for CAAQS designated air monitoring stations when reporting on achievement of the CAAQS.
Meeting Ozone CAAQS in Ontario
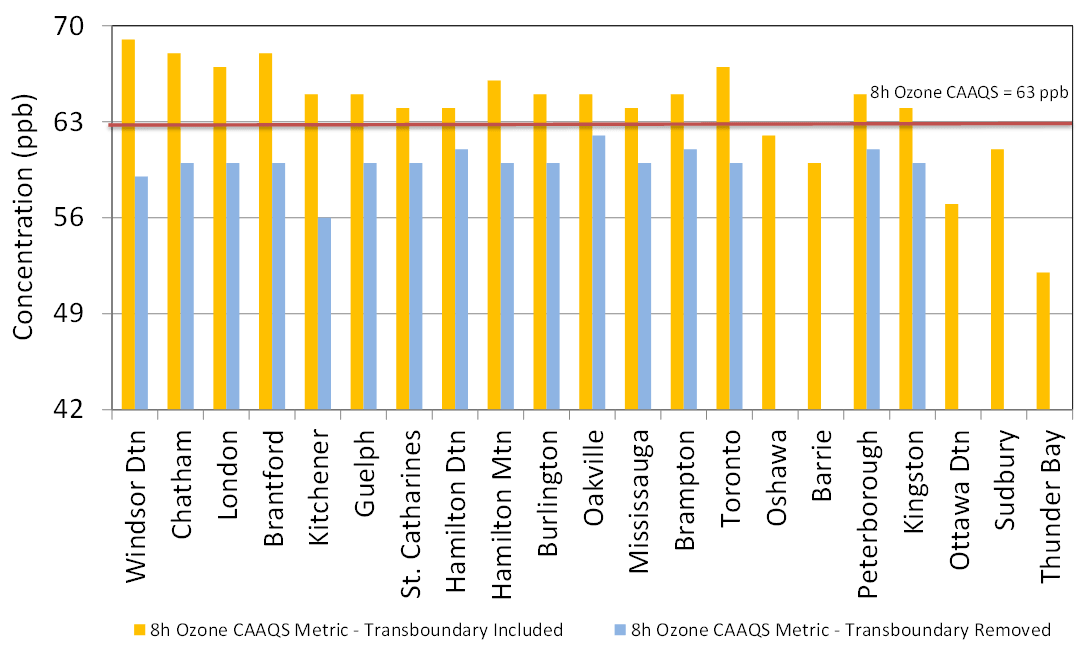
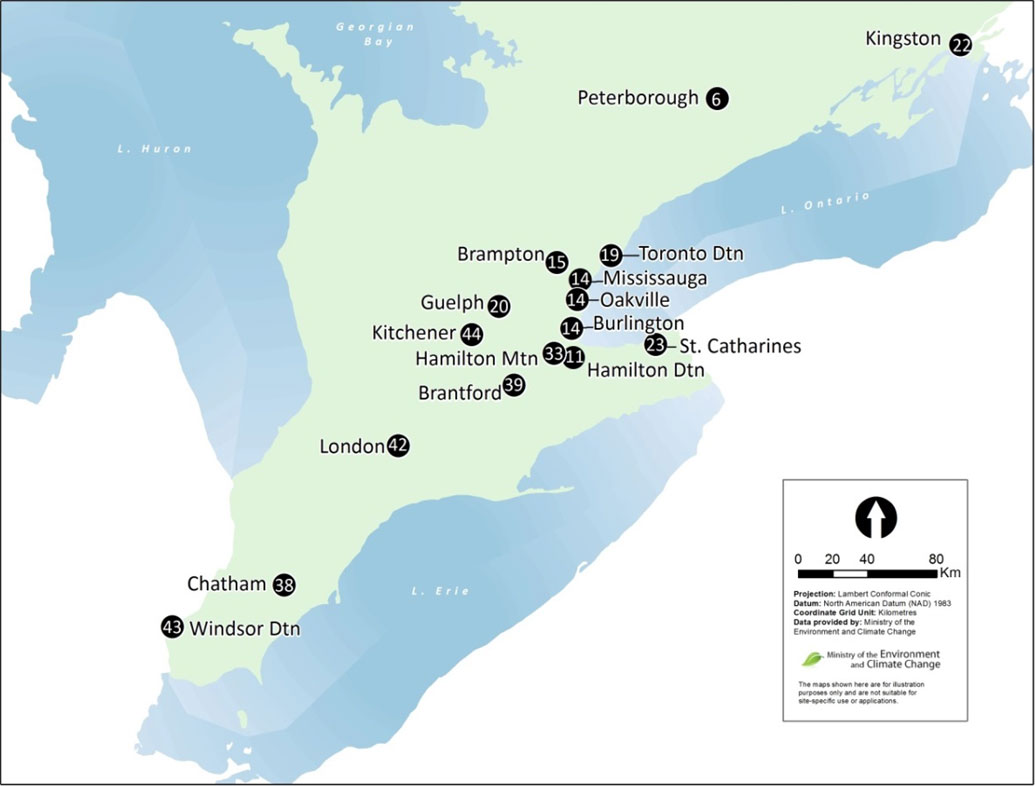
The ozone CAAQS metric values for CAAQS designated Ontario ambient air monitoring sites for 2015 is based on a three-year average, 2013-2015. The 2015 ozone CAAQS metric values ranged from 52 ppb, reported for Thunder Bay, to 69 ppb, reported for Windsor Downtown. Five of the 21 designated sites originally met the CAAQS of 63 ppb for ozone in 2015. A weight of evidence (WOE) analysis was thus conducted to demonstrate the influence of transboundary flows for CAAQS designated air monitoring sites where the ozone CAAQS was exceeded in 2015 – the first year that achievement has been assessed relative to the CAAQS. The WOE approach consists of performing, evaluating and documenting a series of technical analyses that collectively support the conclusion that exceedances of the standard on a given day were influenced by, in this case, transboundary flows. Figure 14 shows the 2015 ozone CAAQS metric values for designated CAAQS sites across Ontario, in addition to the amended CAAQS metrics which exclude transboundary flow days, only for those locations where the ozone CAAQS was originally exceeded. The WOE analysis confirms that these Ontario cities displayed in Figure 14 would have met the ozone CAAQS if they had not been influenced by days with transboundary flow. Figure 15 displays the number of transboundary flow days that were removed for each of the exceeding CAAQS sites using WOE. The WOE approach is applied if the three-year ozone metric value and the corresponding annual 4th highest daily maximum eight-hour running average(s) exceed the ozone CAAQS. For more details on the CAAQS metrics for ozone and the WOE approach, refer to Tables A19-A21 of the Appendix.
Figure 14: Ozone CAAQS Metric Values for Designated Sites Across Ontario, 2015

Note: The CAAQS for ozone (63 ppb) is based on the consecutive three year average of the annual 4th highest daily maximum eight-hour running average. The weight of evidence analysis was applied to those sites which exceeded the CAAQS for ozone; as such, the ozone metric values were amended after removing transboundary-influenced days accordingly.
Figure 15: Total Number of Transboundary Days Removed (2013-2015)

Meeting PM2.5 CAAQS in Ontario
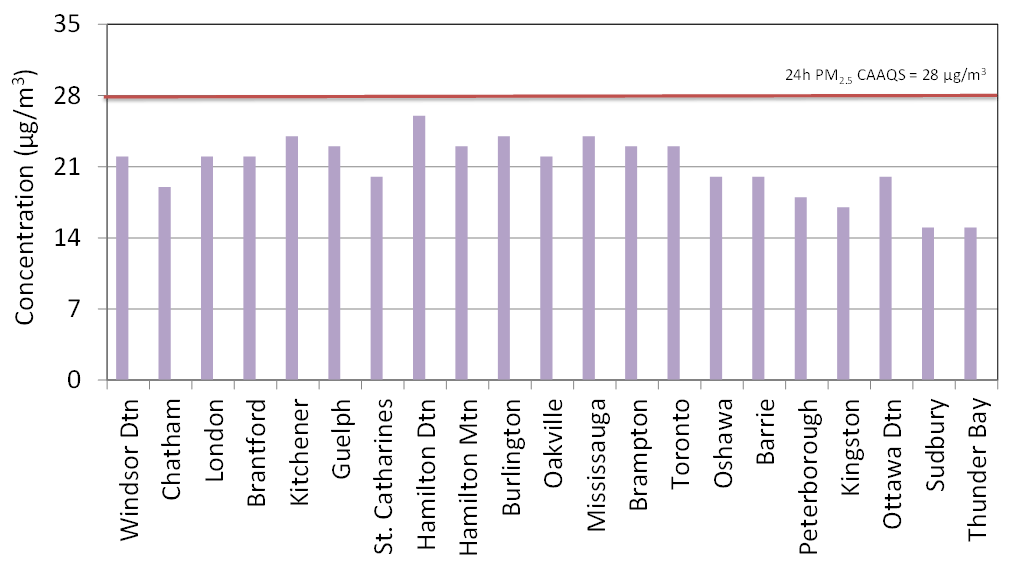
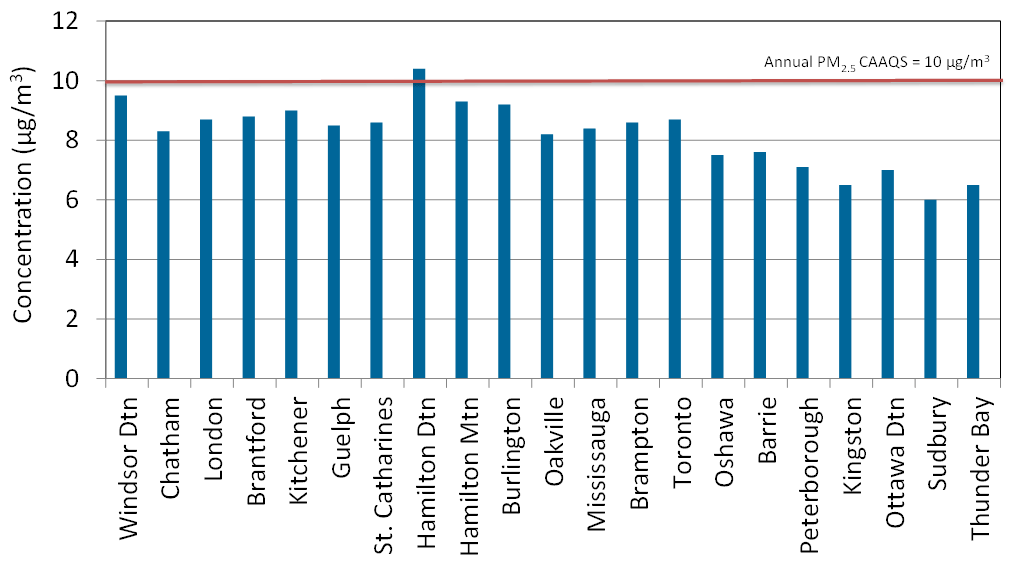
The 2015 24-hour PM2.5 CAAQS metric values ranged from 15 μg/m3, reported for both Sudbury and Thunder Bay, to 26 μg/m3, reported for Hamilton Downtown. The 2015 annual PM2.5 CAAQS metric concentrations ranged from 6.0 μg/m3, reported for Sudbury, to 10.4 μg/m3, reported for Hamilton Downtown which is the only site to exceed the PM2.5 CAAQS of 10 μg/m3 in 2015. The CAAQS metric values for the 24h and annual PM2.5 are displayed in Figures 16 and 17, respectively, and in Table A19 of the Appendix.
Figure 16: 24h PM2.5 CAAQS Metric Values for Designated Sites Across Ontario, 2015

Note: The CAAQS for 24h PM2.5 (28 μg/m3) is based on the 98th percentile measurement annually, averaged over three consecutive years.
Figure 17: Annual PM2.5 CAAQS Metric Values for Designated Sites Across Ontario, 2015

Note: The CAAQS for annual PM2.5 (10 μg/m3) is based on the annual mean averaged over three consecutive years.