This page is no longer current and is provided for archival and research purposes.
Read the most recent information.
Other Air Pollutants
Nitrogen Dioxide
Nitrogen dioxide is a reddish-brown gas with a pungent odour, which transforms in the atmosphere to form gaseous nitric acid and nitrates. It plays a major role in atmospheric reactions that produce ground-level ozone, a major component of smog. Nitrogen dioxide also reacts in the air and contributes to the formation of PM2.5 (Seinfeld and Pandis, 2006). All combustion in air produces NOx, of which NO2 is a component. Major sources of NOx emissions include the transportation sector, industrial processes and utilities.
Nitrogen dioxide can irritate the lungs and lower their resistance to respiratory infection. People with asthma and bronchitis have increased sensitivity to NO2. Nitrogen dioxide chemically transforms into nitric acid in the atmosphere and, when deposited, contributes to the acidification of lakes and soils in Ontario. Nitric acid can also corrode metals, fade fabrics, degrade rubber, and damage trees and crops.
There were no exceedances of the provincial one-hour and 24-hour AAQC for NO2, 200 ppb and 100 ppb, respectively, at any of the monitoring locations in Ontario during 2015. The Toronto West air monitoring station, located in an area of Toronto influenced by significant vehicular traffic, recorded the highest NO2 annual mean (16.6 ppb) during 2015; whereas Tiverton, a rural site, recorded the lowest NO2 annual mean (2.4 ppb). The highest NO2 means were recorded in large urbanized areas, such as the Greater Toronto Area of southern Ontario. The Toronto East station recorded the highest one-hour NO2 concentration (69 ppb), and both Toronto West and Sudbury recorded the highest 24-hour NO2 concentration (42 ppb).
The NO2 annual mean concentrations across Ontario have decreased 32 per cent from 2006 to 2015, as displayed in Figure 10. The NOx emission trend from 2006 to 2015 indicates a decrease of approximately 38 per cent as shown in Figure 11 (2015 APEI). Ontario’s emissions trading regulations on sulphur dioxide and nitrogen oxides (O. Reg. 397/01 and O. Reg. 194/05) have contributed to the reduction in nitrogen oxides emissions in recent years. Nitrogen oxides emissions from on-road vehicles have also decreased due to the phase-in of new vehicles having more stringent emission standards. The implementation of the Ontario Drive Clean program in southern Ontario in 1999 has also helped further reduce the NOx emissions from light duty gasoline vehicles.
Figure 10: Trend of NO2 Annual Means Across Ontario (2006 - 2015)
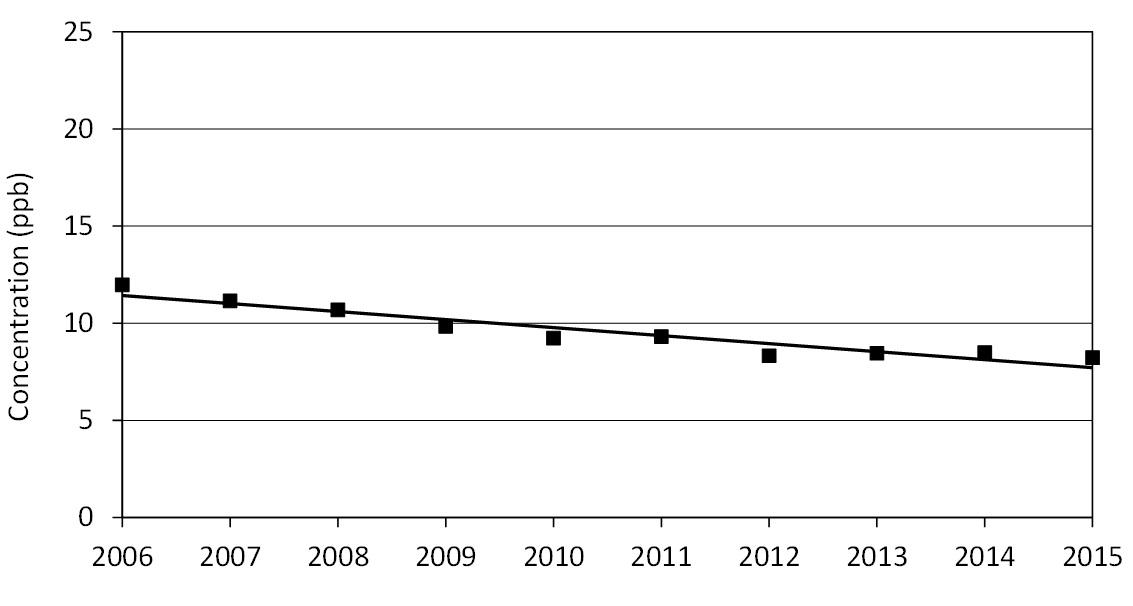
Note: 10-year trend is a composite mean based on data from 31 monitoring sites.
Figure 11: Ontario NOX Emissions Trend (2006 to 2015)
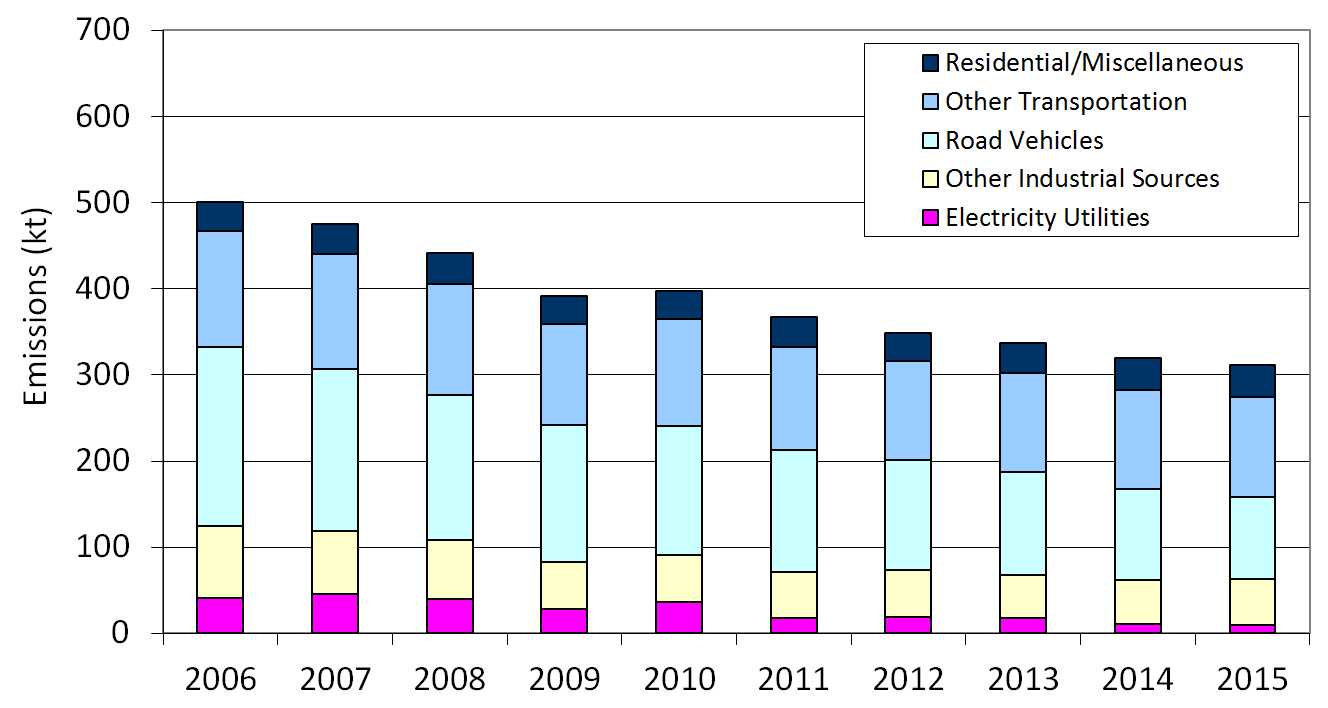
Note: Excludes emissions from open and natural resources.
Sulphur Dioxide
Sulphur dioxide is a colourless gas that smells like burnt matches. It can also be oxidized in the atmosphere to form sulphuric acid aerosols. In addition, sulphur dioxide is a precursor to sulphates, one of the main components of airborne secondary PM2.5. Major sources of SO2 include smelters, industrial processes and electric utilities.
Health effects caused by exposure to high levels of SO2 include breathing problems, respiratory illness, and the exacerbation of respiratory and cardiovascular disease. People with asthma, chronic lung disease or heart disease are the most sensitive to SO2. Sulphur dioxide damages trees and crops. Similar to NO2, SO2 leads to the formation of PM2.5 and is also a precursor to acid rain, which contributes to the acidification of soils, lakes and streams, accelerated corrosion of buildings, and reduced visibility.
Smelters in central Ontario are the major sources of SO2 emissions in Ontario, accounting for approximately 71 per cent of the provincial SO2 emissions according to 2015 estimates for point, area and transportation sources (excluding emissions from open and natural sources). Industrial processes (e.g. petroleum refining, cement and concrete manufacturing) accounted for an additional 26 per cent. The transportation sector and miscellaneous sources accounted for the remaining 3 per cent of all SO2 emissions in the province (2015 APEI).
There were no exceedances of the provincial one-hour, 24-hour and annual AAQC for SO2 of 250 ppb, 100 ppb and 20 ppb, respectively, at any of the ambient air monitoring locations in Ontario during 2015. Hamilton Downtown recorded the highest SO2 annual mean (4.3 ppb) during 2015, and the highest 24-hour maximum concentration (39 ppb) was recorded at Sarnia. Sudbury recorded the highest one-hour maximum concentration (221 ppb) during 2015.
The SO2 annual mean concentrations from 2006 to 2015 show a decreasing trend of 48 per cent across Ontario in Figure 12. Overall, provincial SO2 emissions have decreased by approximately 44 per cent from 2006 to 2015 as shown in Figure 13 (2015 APEI). The reduction of SO2 emissions over the years is the result of various initiatives, which include, but are not limited to,
- Control orders for Ontario smelters;
- Countdown Acid Rain program and Canada-wide Acid Rain Strategy;
- Ontario emissions trading regulations on sulphur dioxide and nitrogen oxides (O. Reg. 397/01 and O. Reg. 194/05);
- Cessation of coal use in electricity generation; and
- Low sulphur content in transportation fuels.
NOx and SO2 electricity sector emissions trading regulation (O. Reg. 397/01) placed limits on Ontario Power Generation’s (OPG) fossil fuel-fired generating stations starting 2002. Effective January 1, 2004 the program also applied to independent power producers (IPPs). The trading program was expanded in 2006 to include thirty facilities from seven industrial sectors. NOx and SO2 emissions for electricity generators covered under the trading program have fallen by approximately 78% and 98% respectively between 2006 and 2015, largely because of coal closure. NOx and SO2 emissions for the industrial facilities regulated under the program (O.Reg. 194/05) have fallen by approximately 26% and 27% between 2006 and 2015. This decline is the result of a combination of factors including emissions reduction initiatives undertaken by facilities covered by the program and industry restructuring.
Figure 12: Trend of SO2 Annual Means Across Ontario (2006 - 2015)
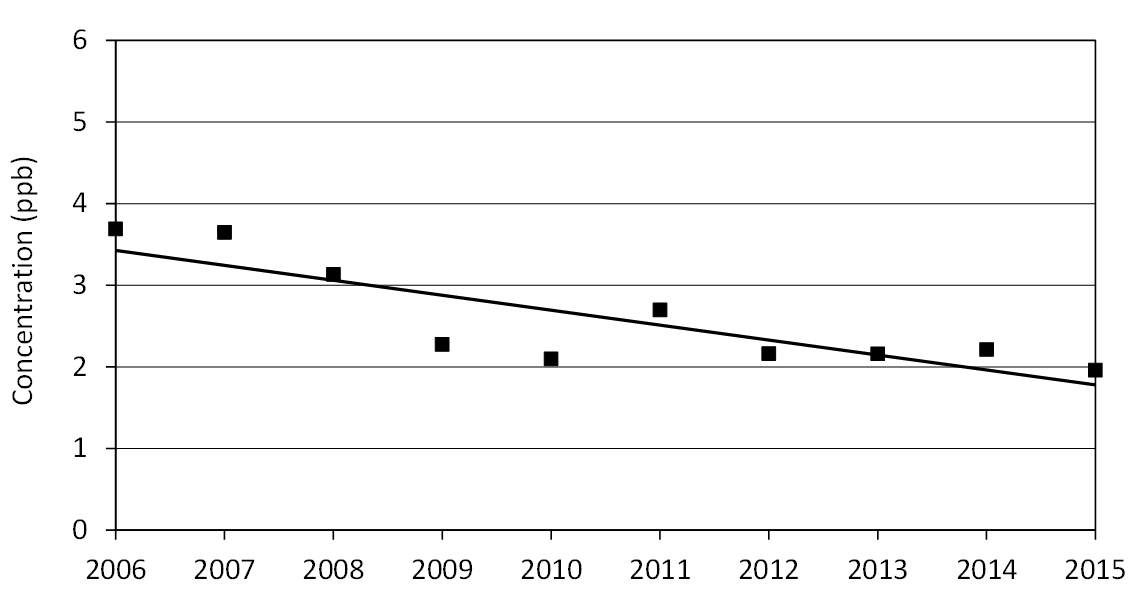
Note: 10-year trend is a composite mean based on 10 ambient air monitoring sites.
Figure 13: Ontario SO2 Emissions Trend (2006 - 2015)
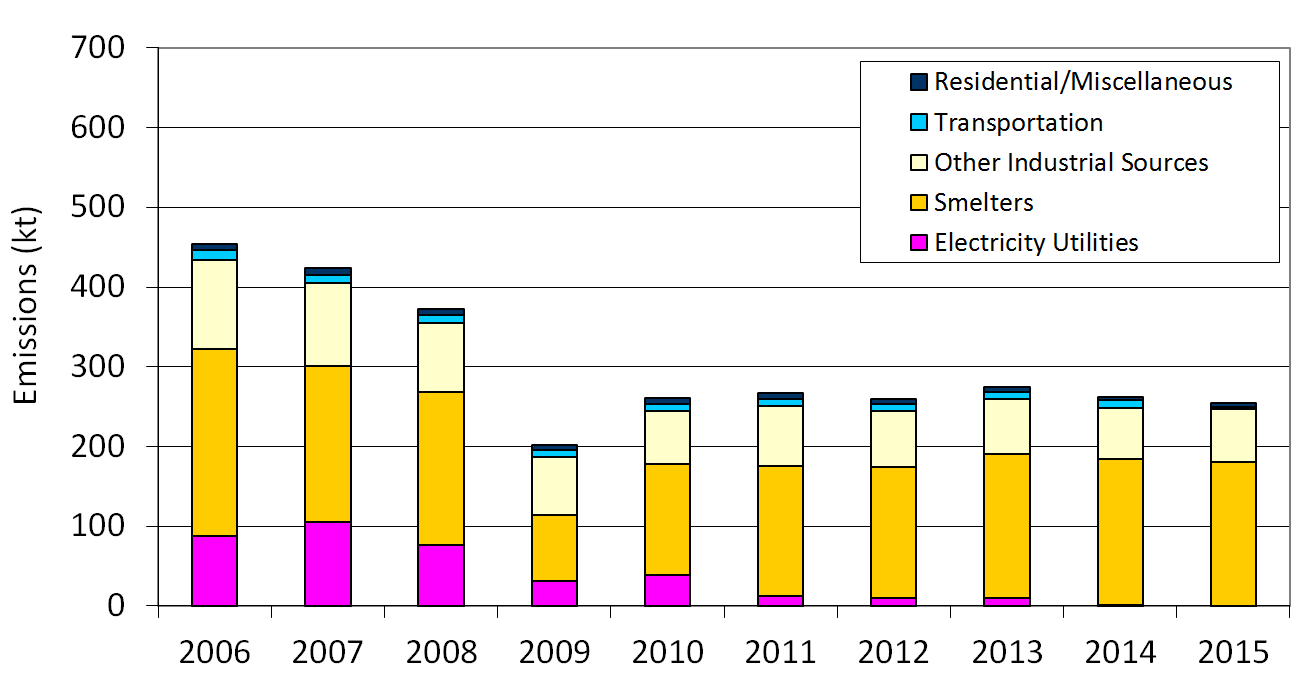
Note: Excludes emissions from open and natural sources.
Ontario Coal Closure
Ontario was the first jurisdiction in North America to eliminate coal as a source of electricity production, resulting in significant decreases in emissions of NOx, SO2 and mercury.
As a result of the introduction of the Cessation of Coal Use Regulation in August 2007, coal went from 25% of Ontario’s energy supply mix in 2003 to zero in 2014 when the last plant ceased coal use. Improvements in SO2 and NOx pollution control technologies at operating fossil fuel generating stations also contributed to reductions during the 1990’s to mid-2000’s. Between the mid-1990’s and 2000’s, SO2 and NOx emissions increased because coal-fired power generation capacity was increased to compensate for the lost capacity while the nuclear generating units were refurbished. The coal generating capacity has since been replaced with a mix of emission-free energy sources including nuclear, hydro and renewables beginning in the early to mid-1990’s, along with lower-emission energy sources such as natural gas and biomass beginning in the late 2000’s. More than 90% of the power generated in Ontario now comes from clean energy.
NOx Emission Trend from Electric Utilities Ontario
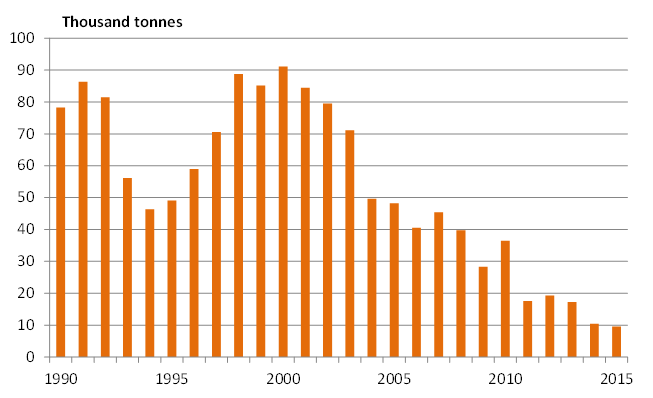
Source of Data: 2015 APEI.
NOx Emission Trend from Electric Utilities United States
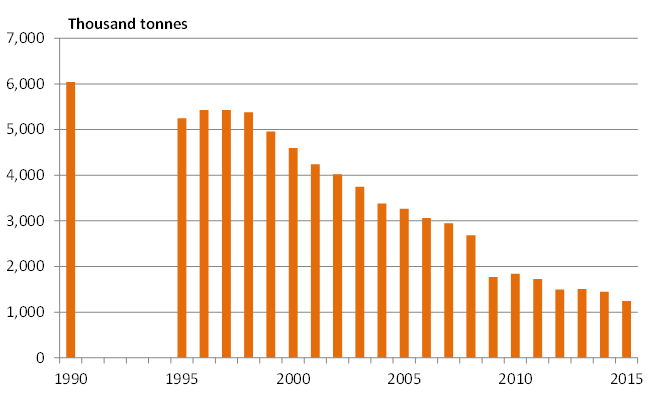
Source of Data: 2015 AMPD and 1990 APETD.
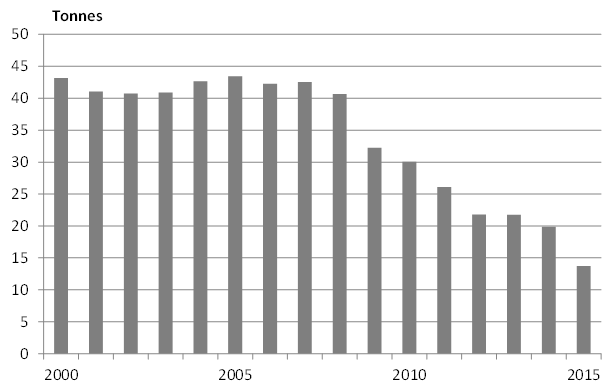
SO2 Emission Trend from Electric Utilities Ontario
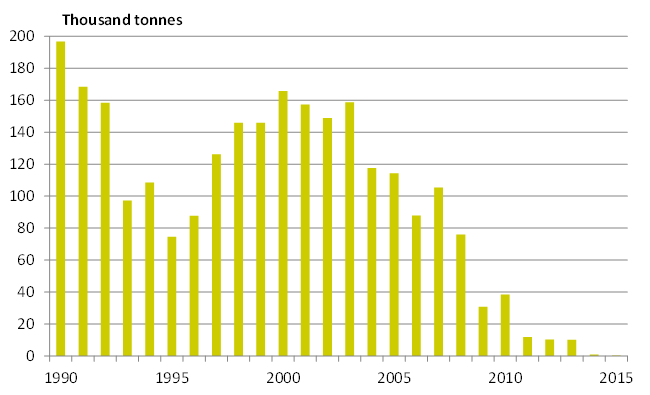
Source of Data: 2015 APEI.
SO2 Emission Trend from Electric Utilities United States
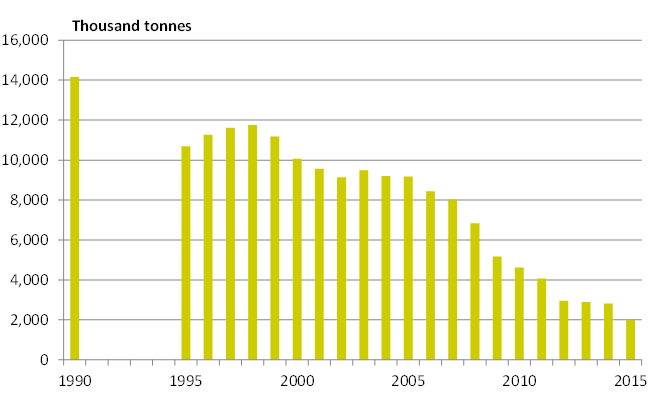
Source of Data: 2015 AMPD and 1990 APETD.
The U.S. has also reduced emissions from power plants and industrial units over the same period as a result of introducing its Clean Air Markets Programs which targeted SO2, NOx and other contaminants by either placing caps on emissions or imposing reduction targets. The first nationwide program was the Acid Rain Program, which was first phased in 1995 and was fully implemented by 2010, followed by the NOx Budget Trading Program (2003-2008) which was subsequently replaced by the Clean Air Interstate Rule (CAIR) beginning in 2009.
Mercury Emission Trend from Electric Utilities Ontario
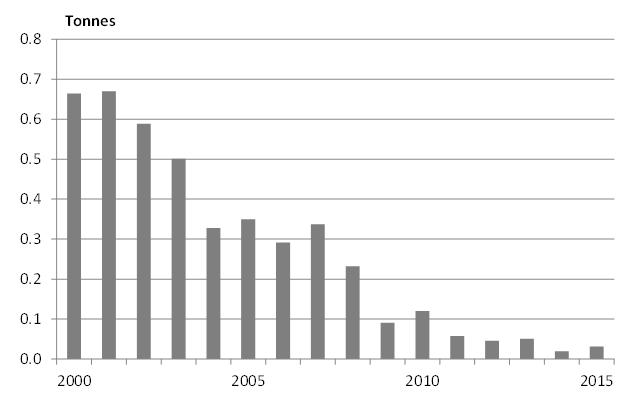
Source of Data: 2015 APEI.
Mercury Emission Trend from Electric Utilities United States
Source of Data: 2015 TRI.
Between 1990 and 2015 NOx emissions from Ontario’s electricity sector (including coal, natural gas, fuel oil, diesel and biomass generating stations) decreased by 87.8% and SO2 emissions decreased by 99.8%, and mercury emissions decreased by 95.3% between 2000 and 2015; due in part to the elimination of coal. By comparison, for the same periods, NOx emission from the electricity sector in the U.S. decreased by 79.5%, SO2 by 85.9% and mercury by 68.2%.
Further, a comparison of the emission reductions attributable to coal elimination as compared to overall provincial emission reductions, illustrates the significance of coal cessation – coal plant NOx emission reductions were 24% of provincial total, SO2 was 22% and mercury was 29%.
| Pollutant | Ontario Emission Reductions | Coal Plants Emission Reductions | Coal Plant Emissions Reductions relative to Ontario |
|---|---|---|---|
| SO2 | ↓ 878 kt | ↓ 193 kt | 22% |
| NOx | ↓ 313 kt | ↓ 75 kt | 24% |
| Mercury | ↓ 1897 kg | ↓ 549 kg | 29% |
Notes:
Excludes emissions from open and natural sources.
NOx and SO2 emission reductions are based on 1990-2015 data.
Mercury emission reductions are based on 2000-2015 data.
Carbon Monoxide
Carbon monoxide is a colourless, odourless, tasteless and, at high concentrations, poisonous gas. This gas can enter the bloodstream and reduce oxygen delivery to the organs and tissues. People with heart disease are particularly sensitive to CO. Exposure to high CO levels is associated with the impairment of vision, work capacity, learning ability and performance of complex tasks. Carbon monoxide is produced primarily by the incomplete combustion of fossil fuels. The 2015 estimates for point, area and transportation sources (excluding emissions from open and natural sources) indicate that the transportation sector accounted for 66 per cent of all CO emissions (2015 APEI).
In 2015 there were no exceedances of the provincial one-hour and eight-hour AAQC of 30 parts per million (ppm) and 13 ppm, respectively, at any of the ambient air monitoring locations in Ontario. Windsor Downtown recorded the highest one-hour CO maximum of 1.91 ppm and the highest eight-hour maximum of 1.20 ppm. Typically, higher CO concentrations recorded in urban centres are attributable to vehicle emissions.
The composite means of the one-hour and eight-hour CO maximums have decreased 53 per cent and 41 per cent, respectively, across the province from 2006 to 2015. Carbon monoxide emissions have been reduced by approximately 32 per cent from 2006 to 2015 (2015 APEI).