This page is no longer current and is provided for archival and research purposes.
Read the most recent information.
Fine Particulate Matter
Airborne particulate is the general term used to describe a mixture of microscopic solid particles and liquid droplets suspended in air. Particulate matter (PM) is classified according to its aerodynamic size, mainly due to the different health effects associated with particles of different diameters. Fine particulate matter, denoted as PM2.5, refers to respirable particles that are less than 2.5 micrometres in diameter, approximately 30 times smaller than the average diameter of a human hair. Due to their small size, they can penetrate deep into the lungs.
Particulate matter includes aerosols, smoke, fumes, dust, fly ash and pollen. Its composition is complex and varies with origin, residence time in the atmosphere, time of year and environmental conditions. Major components of PM2.5 in Ontario are typically nitrates, sulphates, organic matter and particle-bound water. Higher nitrate levels are common in the cooler months whereas sulphates are more elevated during warm temperatures. Fine particulate matter may be emitted directly into the atmosphere as a by-product of fuel combustion or it may be formed indirectly in the atmosphere through a series of complex chemical reactions. Major sources of PM2.5 include motor vehicles, smelters, power plants, industrial facilities, residential fireplaces and wood stoves, agricultural burning and forest fires.
The 2015 estimates for Ontario’s PM2.5 emissions from point, area and transportation sources (excluding emissions from open and natural sources) indicate residential fuel combustion accounted for 53 per cent, as shown in Figure 6. The major contributor to residential emissions is fuel wood combustion in fireplaces and wood stoves. Industrial processes and transportation sectors accounted for 21 per cent and 12 per cent, respectively (2015 APEI).
Figure 6: Ontario PM2.5 Emissions by Sector (2015 Estimates for Point/Area/Transportation Sources)
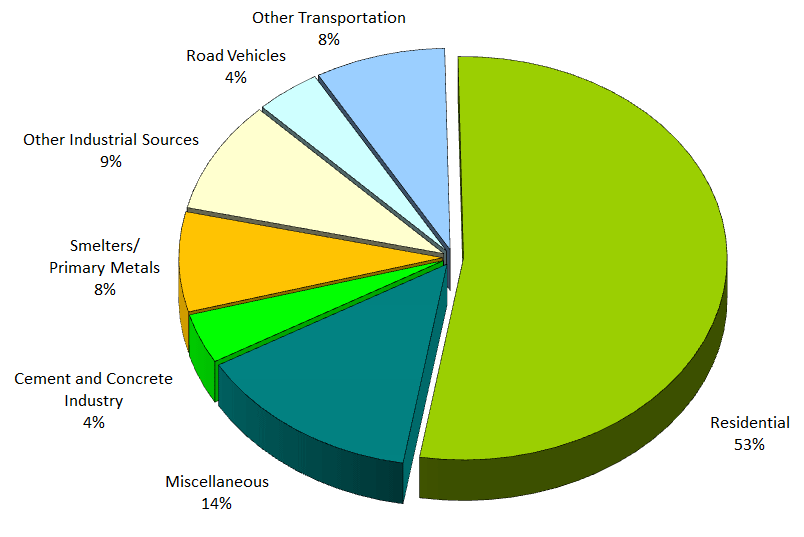
Note: Excludes emissions from open and natural resources.
In 2013, as part of a national initiative funded by Environment and Climate Change Canada (ECCC), Ontario upgraded all PM2.5 monitors across its ambient air monitoring network and started reporting with this new technology. While annual means and maximums are reported for 2015, 10-year trends for the entire ambient air monitoring network cannot be determined since the 2013 to 2015 PM2.5 data set is not directly comparable to data collected using the older technology. Ontario’s new PM2.5 measurement technology and 10-year trends are discussed further in Section 3.1: Technical Discussion - New PM2.5 Measurement Technology in Ontario.
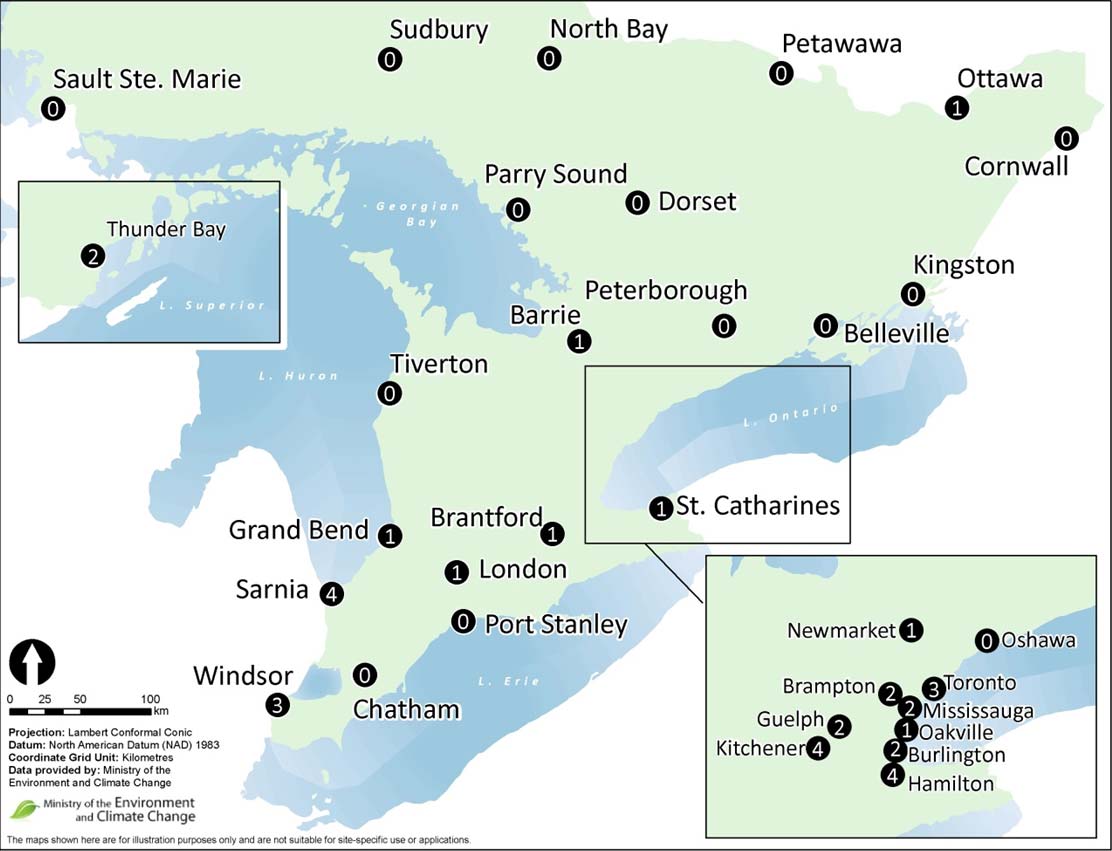
In 2015, 39 AQHI sites measured PM2.5; annual mean concentrations ranged from 4.8 μg/m3 in Petawawa to 10.2 μg/m3 in downtown Hamilton. The PM2.5 24-hour maximum concentrations ranged from 15 μg/m3 in Petawawa to 42 μg/m3 recorded at Windsor West. Twenty-five air monitoring sites in 18 locations across the province measured daily averages above Ontario’s 24-hour PM2.5 reference level of 28 μg/m3 on at least one occasion as shown in Figure 7.
Figure 7: Geographical Distribution of the Number of Days Above the 24-Hour PM2.5 Reference Level Across Ontario in 2015
Provincial PM2.5 emissions have decreased approximately 11 per cent from 2006 to 2015 as shown in Figure 8. Fine particulate matter emissions from electric utilities and industrial processes have been reduced approximately 35 per cent during this period. Emissions from the transportation sector decreased 44 per cent with the phase-in of new vehicles/engines having more stringent emission standards over the same period.
Figure 8: Ontario PM2.5 Emissions Trend (2006 - 2015)
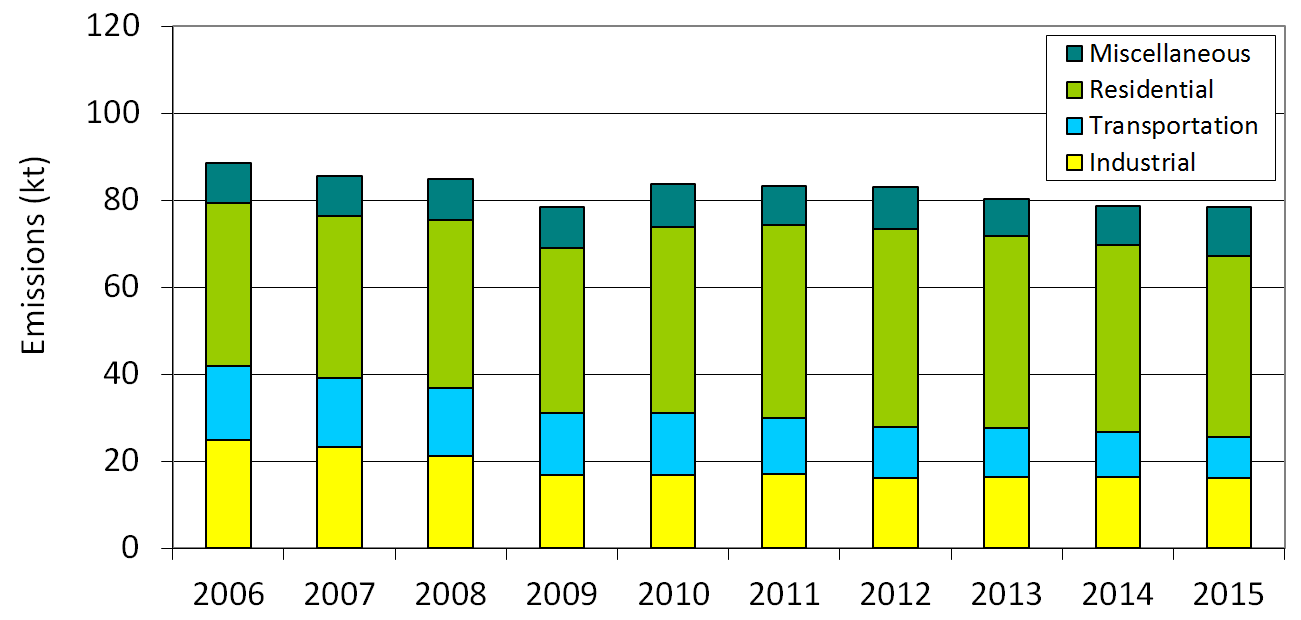
Note: Excludes emissions from open and natural sources.
Technical Discussion
New PM2.5 Measurement Technology in Ontario
In 2002 Ontario became the first province in Canada to report hourly PM2.5 concentrations to the public under the Air Quality Index (AQI) program utilizing Tapered Element Oscillating Microbalance (TEOM) instruments that provided continuous PM monitoring. Continuous PM monitoring is essential for reporting hourly ambient concentrations. The TEOM was the most innovative method at the time for continuous real-time PM2.5 monitoring (Patashnick and Rupprecht, 1991), and continues to be used by many jurisdictions across North America.
Over the last decade, continuous PM2.5 monitoring technologies have evolved dramatically to address the technical issues associated with cold weather PM2.5 measurements. After extensive evaluation of four new PM2.5 monitors, it was determined that Ontario’s TEOM instruments did not perform as well as these new PM2.5 monitors, particularly during the winter. Ontario selected the Synchronized Hybrid Ambient Real-time Particulate (SHARP) 5030 to replace the aging TEOM monitors deployed in the AQI network. As part of a national initiative funded by ECCC, Ontario deployed the SHARP 5030 monitors in 2012 across the ambient air monitoring network for testing. In January 2013, Ontario commenced public reporting with the new SHARP 5030 instruments. The SHARP 5030 reports higher PM2.5 concentrations than the TEOM analyzer during cold weather due to the improved performance of the SHARP 5030 (Sofowote et al, 2014). This has resulted in an increase in Ontario’s PM2.5 annual mean from 2013 to 2015, however this is not an indication that the air quality has changed; only that the measurement is more accurate.
A network-wide trend using historical TEOM and 2013-2015 SHARP data cannot be determined as the two datasets are not directly comparable. In anticipation of this, TEOM and SHARP monitors were collocated at a sub-set of air monitoring stations to continue reporting annual trends and work towards making the new PM2.5 measurements comparable to historical data. Seven sites including Sarnia, Port Stanley, Hamilton Downtown, Toronto West, Ottawa Downtown, Cornwall and North Bay, were selected to be representative of Ontario’s PM2.5 network, taking into consideration the differences in air quality across the province. The 10-year PM2.5 trend for these sites, using TEOM technology, continues to show a decrease of PM2.5 levels. For the period of 2006 to 2015 a decrease of 31 per cent was observed (Figure 9). Additionally, Ontario developed corrections for historical TEOM measurements, for the fall and winter seasons, for the purpose of making them more comparable to SHARP measurements through a multiple linear regression analysis. This analysis, using collocated TEOM and SHARP instruments, showed that on average, annual SHARP measurements were 25 per cent higher than TEOM measurements (Sofowote et al, 2014). Using this as an approximate correction factor, Figure 9 displays an estimated SHARP-like 10-year trend that parallels the TEOM trend, and illustrates that Ontario’s air quality is still improving based on measurements using the new technology. With more accurate, but higher, reported PM2.5 values resulting from the implementation of SHARP instruments, achievement of PM2.5 reference levels and standards may be more challenging.
Figure 9: Trend of PM2.5 Annual Means at Select Sites Across Ontario (2006 - 2015)
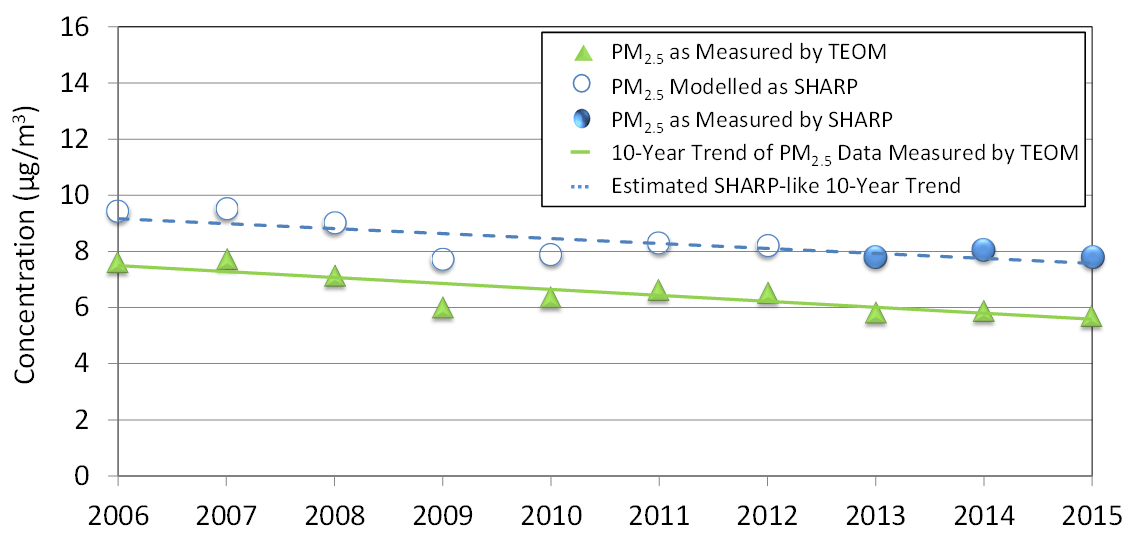
Note: The trend is a composite mean based on data from Sarnia, Port Stanley, Hamilton Downtown, Toronto West, Ottawa Downtown, Cornwall and North Bay. PM2.5 concentrations as measured by TEOM operated at 30°C with Sample Equilibration System (2006-2015) and by SHARP 5030 (2013-2015).