This page is no longer current and is provided for archival and research purposes.
Read the most recent information.
Ground-Level Ozone
Ground-level ozone is a gas formed when nitrogen oxides (NOx) and VOCs react in the presence of sunlight. While ozone at ground level is a significant environmental and health concern, the naturally occurring ozone in the stratosphere, 10 to 40 kilometres above the earth’s surface, is beneficial as it shields the earth from harmful ultraviolet radiation.
Ozone is a colourless, odourless gas at typical ambient concentrations, and is a major component of smog. Ozone is not generally emitted directly into the atmosphere; the formation and transport of ozone is strongly dependent on meteorological conditions and emissions of chemical precursors, particularly NOx and VOCs. Changing weather patterns contribute to differences in ozone concentrations hour-to-hour, day-to-day, season-to-season, and year-to-year. In Ontario, the highest concentrations of ground-level ozone are typically recorded on hot and sunny days mainly from May to September, between noon and early evening.
Ozone irritates the respiratory tract and eyes. Exposure to ozone in sensitive people can result in chest tightness, coughing and wheezing. Children who are active outdoors during the summer, when ozone levels are highest, are particularly at risk. Individuals with pre-existing respiratory disorders, such as asthma and chronic obstructive pulmonary disease (COPD), are also at risk. Ozone is associated with increased hospital admissions and premature deaths. Ozone may cause losses in agricultural crops each year in Ontario, with visible leaf damage in many crops, garden plants and trees, especially during the summer months.
Figure 1 shows the estimates of Ontario’s VOCs emissions from point, area and transportation sources. General solvent use accounted for approximately 27 per cent of VOCs emissions and the second largest source was the transportation sectors accounting for approximately 26 per cent. Figure 2 shows the estimates for Ontario’s NOx emissions from point, area and transportation sources. The transportation sectors accounted for approximately 68 per cent of NOx emissions (2015 APEI).
Figure 1: Ontario VOCs emissions by sector (2015 estimates for point/area/transportation sources)
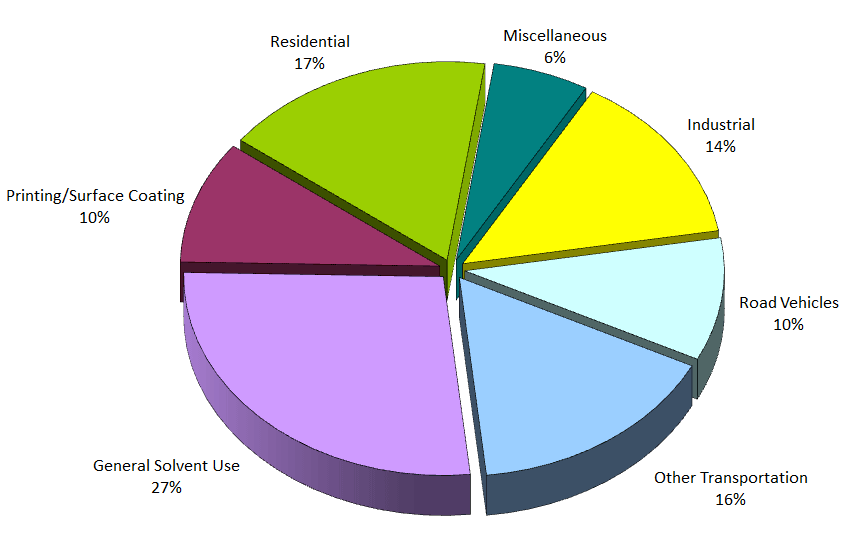
Note: Excludes emissions from open and natural resources.
Figure 2: Ontario Nitrogen Oxides emissions by sector (2015 estimates for point/area/transportation sources)
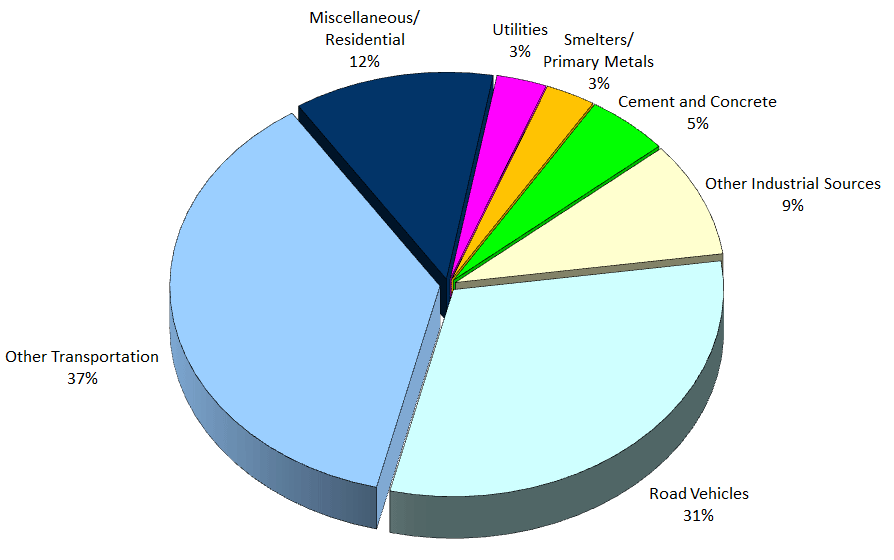
Note: Excludes emissions from open and natural resources.
In 2015, ozone was monitored at the ministry’s 39 AQHI sites. The highest annual mean was 32.8 parts per billion (ppb), measured at Port Stanley, a transboundary-influenced site on the northern shore of Lake Erie. The lowest annual mean, 21.3 ppb, was measured at Toronto West, an urban site located near a major transportation corridor, Highway 401, and directly impacted by local nitric oxide (NO) emissions from vehicles. Generally, ozone concentrations are lower in urban areas because ozone is depleted by reacting with NO emitted by vehicles and other local combustion sources.
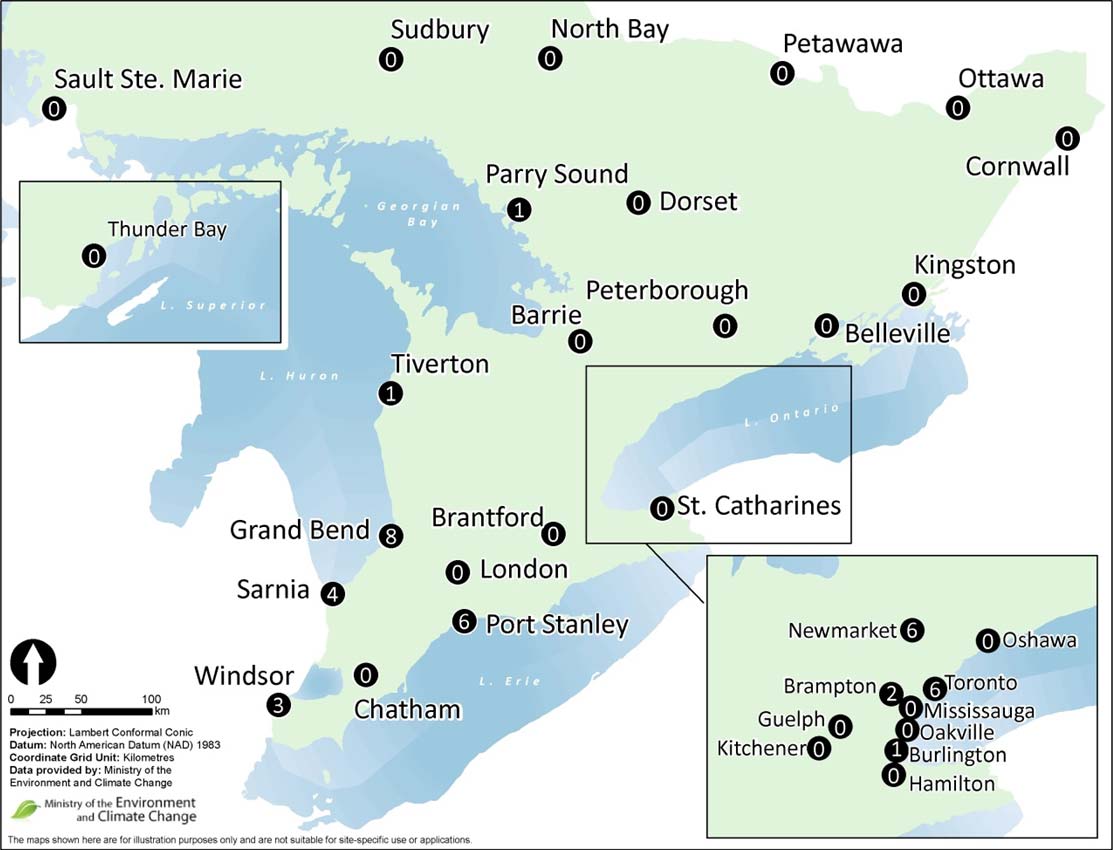
Ground-level ozone was monitored at 39 AQHI sites in 2015. The maximum one-hour ozone concentrations ranged from 62 ppb recorded in Thunder Bay, to 92 ppb recorded in Newmarket. In 2015, thirteen sites in 10 locations across the province measured ozone levels above Ontario’s one-hour AAQC of 80 ppb for at least one hour as shown in Figure 3. Ontario’s one-hour AAQC for ozone was exceeded the most often at Grand Bend on eight occasions.
The ozone exceedances reported in southwestern Ontario, on the eastern shore of Lake Huron and on the northern shore of Lake Erie, are typically resulting from transboundary flow of pollutants. As stated in the Transboundary Air Pollution in Ontario report, elevated ozone levels in southwestern Ontario are generally attributed to the long-range transport of pollutants from the United States (Yap et al, 2005).
Figure 3: Geographical Distribution of the Number of Hours Above the 1-Hour Ozone AAQC Across Ontario in 2015
The ozone annual means in Figure 4 display an increasing trend of 3 per cent for the 10-year period from 2006 to 2015. The trend for ozone summer means and ozone winter means are shown in Figure 5. The ozone summer means trend decreased by 4 per cent from 2006 to 2015, whereas the ozone winter means have increased by 9 per cent over the same 10-year period. The decrease in summer means over the past 10 years is largely due to the progressive reductions of NOx emissions in Ontario and the U.S. resulting in the decrease in local ozone formation and transboundary influences especially during the summer months. Summer ozone, however, continues to exceed the Ontario AAQC during the warmer months and remains a challenge in areas of the province. The increase in the ozone winter means are mainly attributed to the rising global background concentrations which in turn drives the increasing trend of ozone annual means (Reid et al, 2008). In general, even with the increase in ozone winter means, ozone concentrations during the winter months continue to remain well below the Ontario AAQC of 80 ppb.
Figure 4: Trend of Ozone Annual Means Across Ontario (2006 - 2015)
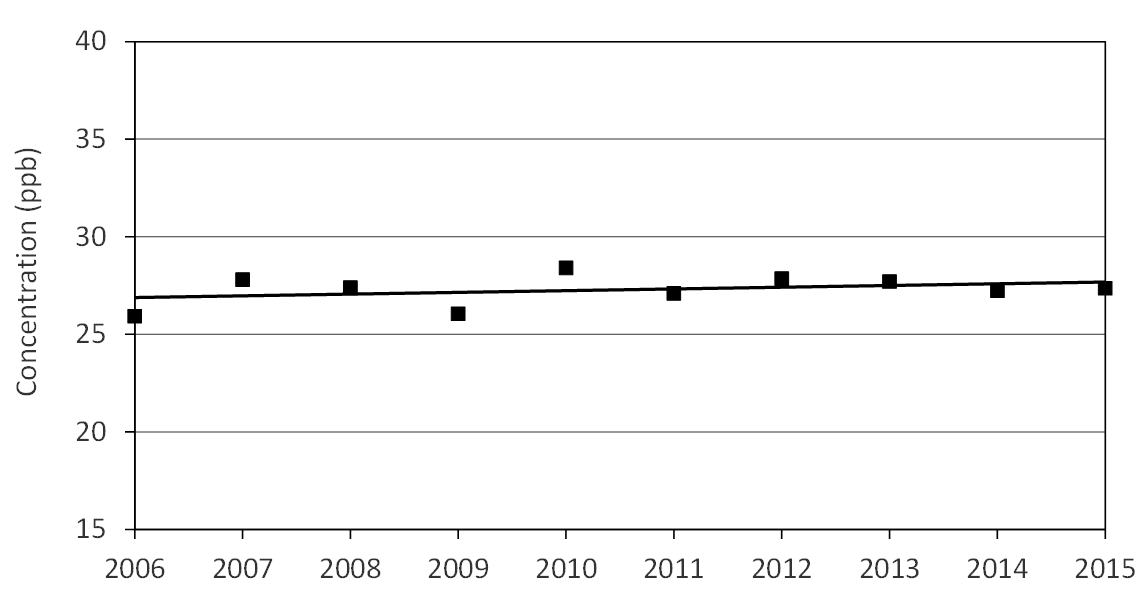
Note: 10 year trend is a composite annual mean based on data from 39 monitoring sites.
Figure 5: Trend of Ozone Summer and Winter Means Across Ontario (2006 - 2015)
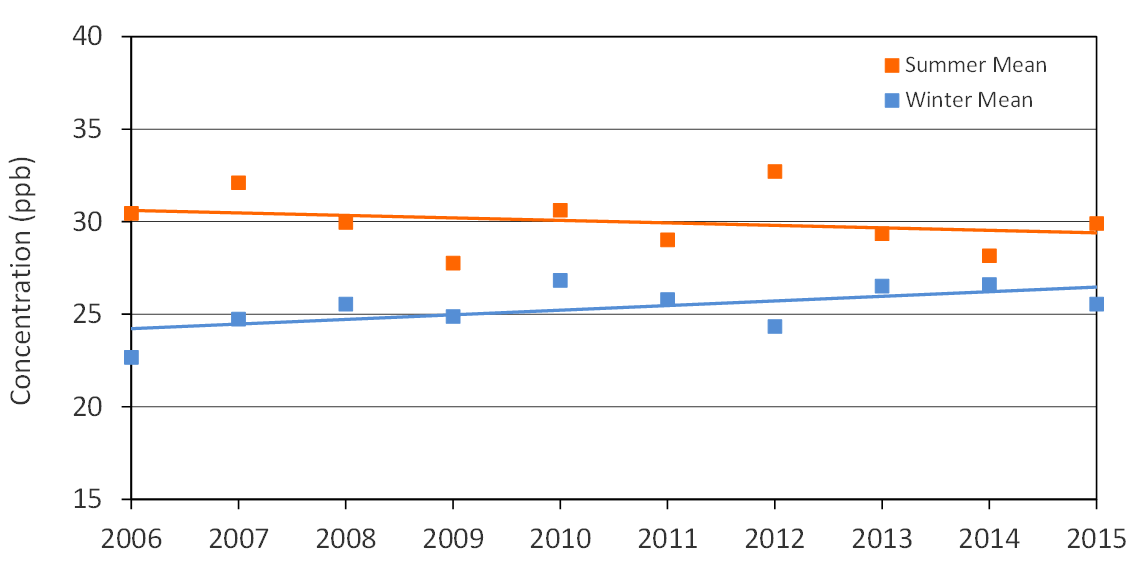
Note: 10 year trends are composite means for the summer and winter months based on data from 39 monitoring sites. Summer: May-September; Winter: January April, October-December