Road user deaths
All types of road users can be killed or injured in motor vehicle collisions, including motor vehicle occupants (drivers and passengers); motorcyclists, motorcycle passengers, cyclists, e-bike riders, as well as pedestrians. Those involved can suffer varying degrees of injury ranging from a fatality to a minor injury or no injury. Among the 84 fatal collisions reviewed by the FCRC, a total of 92 road users were killed between 2017 and 2020. Table 6 summarizes the number of deaths annually according to road user types.
| Road user type | Fatalities 2017 | Fatalities 2018 | Fatalities 2019 | Fatalities 2020 | Fatalities total |
|---|---|---|---|---|---|
| Motor vehicle driver | 17 | 9 | 3 | 9 | 38 (41%) |
| Motor vehicle passenger | 4 | 5 | 4 | 1 | 14 (15%) |
| Pedestrian | 4 | 6 | 9 | 3 | 22 (24%) |
| Motorcyclist | 2 | 2 | 5 | 2 | 11 (12%) |
| Cyclist | 0 | 0 | 3 | 1 | 4 (5%) |
| E-bike rider | 0 | 0 | 1 | 2 | 3 (3%) |
| Total | 27 | 22 | 25 | 18 | 92 (100%) |
More than half of the road users killed were motor vehicle occupants (i.e., drivers or passengers of motor vehicles including cars, buses and trucks). The second largest number of road deaths involved pedestrians, with motorcyclists, cyclists and e-bike riders accounting for fewer fatalities. No motorcycle passengers were killed in collisions reviewed by the FCRC during this timeframe.
A comparison of fatality data to population data provides useful context to determine if certain types of road users or road users with certain characteristics (e.g., age and sex) are over- represented in fatalities. Average population estimates for Ottawa from 2017–2020 were obtained from the Ontario Ministry of Health and Long-Term Care IntelliHEALTH system for comparison purposes. In addition, the age and sex of road users involved in reportable collisions on City roadways between 2017 and 2020 was used to make comparisons. Comparisons are only made with respect to the types of road users involved in fatal collisions. As such, information about motorcyclist passengers was excluded.
Age
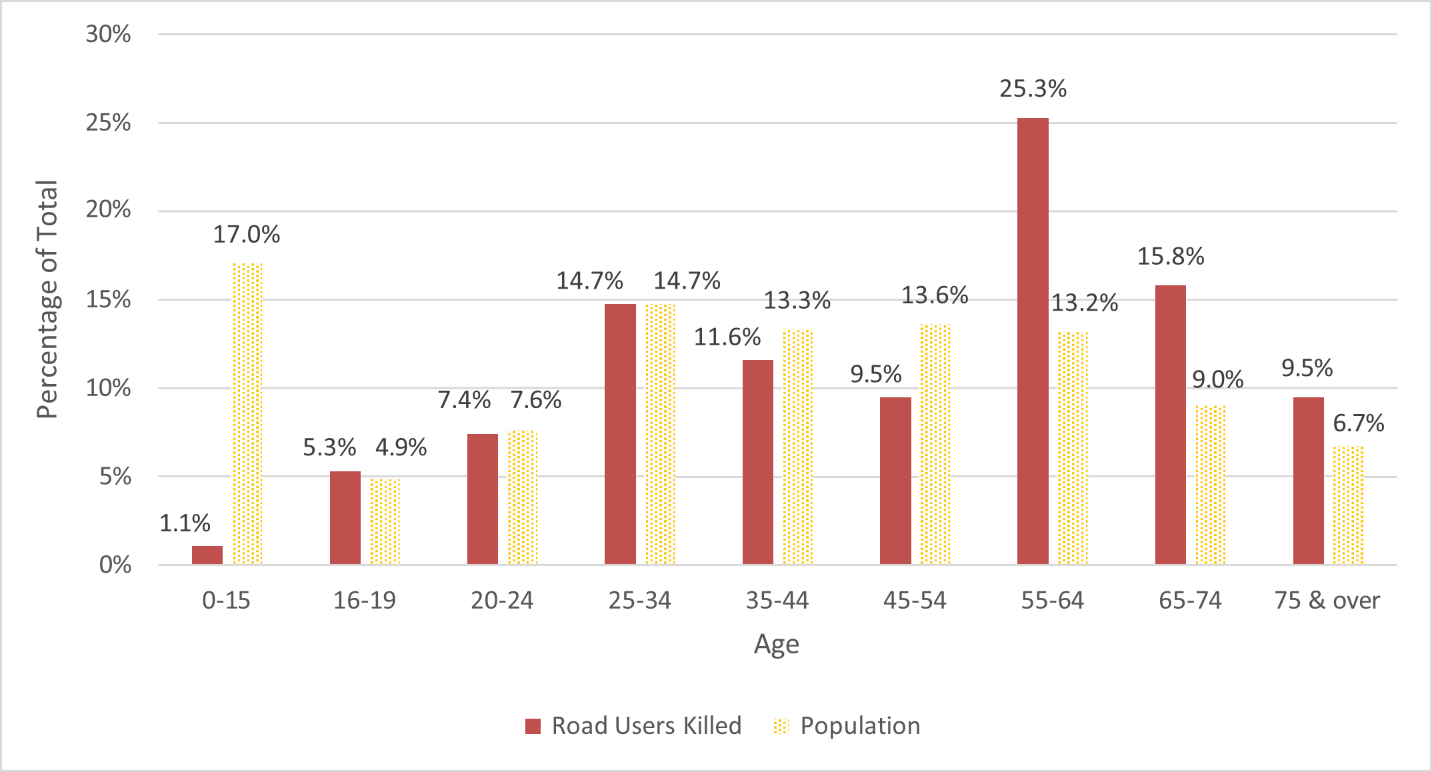
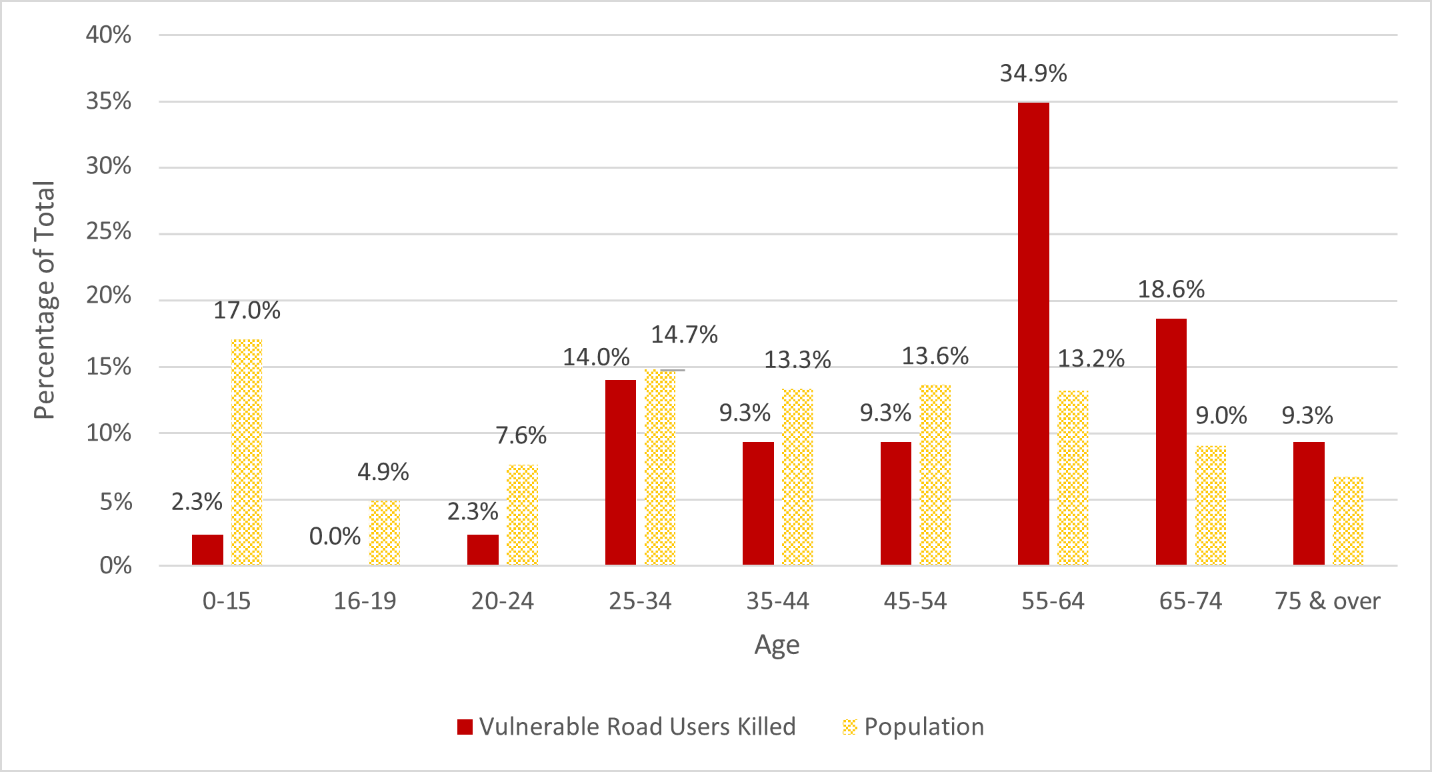
Persons killed in road crashes ranged considerably in age. Due to small numbers, age groups were created for ease of analysis and interpretation of the data. As such, the 92 persons killed in 84 collisions are reported according to age categories and compared to the age distribution of Ottawa’s population in Figure 10.
In several age categories, the percentage of road users killed was comparable to, or lower than, the general population. However, in all groups aged 55 years and older, the percentage of road users killed was higher as compared to the general population. The 55–64 age group represented 25% of road users killed which is almost twice as high as the percentage of the population represented by that age group. This may be due, in part, to the fact older road users are more fragile and may have medical conditions that are complicated by injuries when crash-involved. In addition, drivers over the age of 80 are also more prone to driver errors which contribute to crash-involvement (Mayhew et al., 2015; Li et al., 2003; Vanlaar et al., 2008; TIRF, 2016).
Figure 10: Distribution of road users killed and average Ottawa population by age group, 2017–2020
(Ottawa population estimates, 2017–2020. Ontario Ministry of Health and Long-Term Care, IntelliHEALTH ONTARIO, Extracted May 27, 2022.)
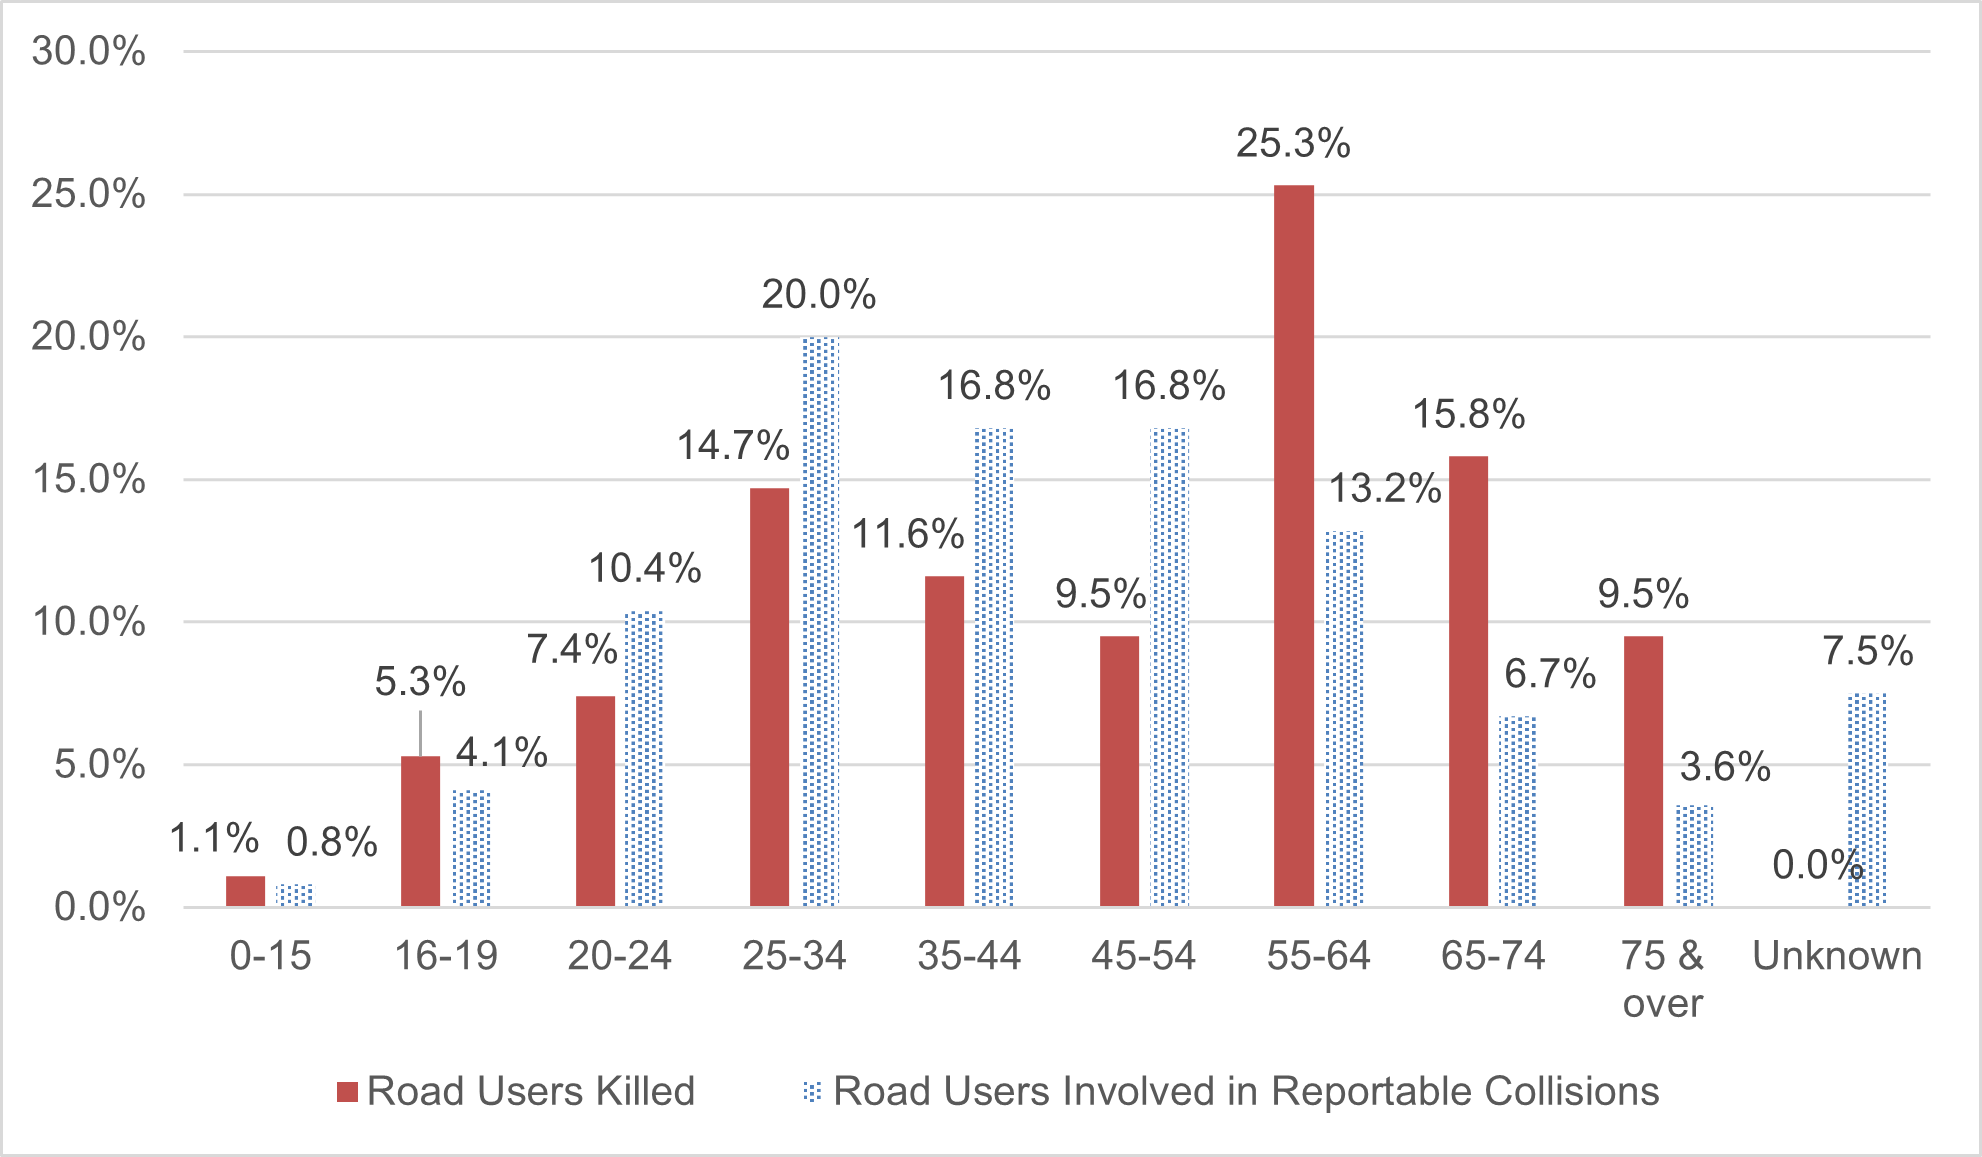
However, road users in the 20–54 age categories were over-represented in reportable collisions compared to fatalities, while those aged 55–64 were in a slightly smaller percentage of reportable collisions than other age cohorts. A smaller percentage of road users aged 65 and older were involved in reportable collisions but represented much larger percentages of fatalities. Young road users aged 16–19 years represented slightly more fatalities than those involved in reportable collisions, and this may be associated with their greater propensity for risk-taking and inexperienced driving (GDL Safety Center, 2022). Figure 11 compares the road users killed and the road users involved in reportable collisions.
Figure 11: Distribution of road users killed and road users involved in reportable collisions by age group, 2017–2020
Motor vehicle occupants
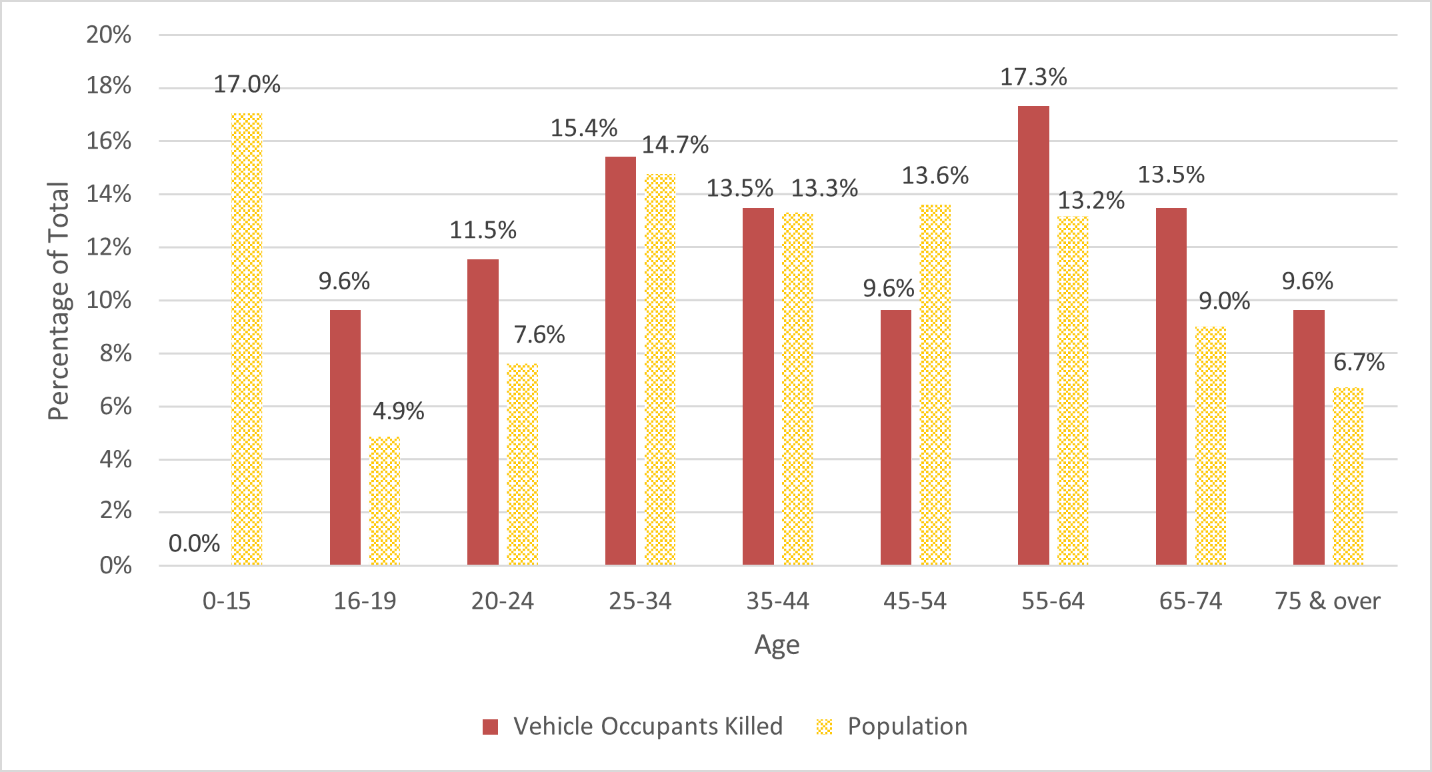
Motor vehicle occupants (i.e., drivers or passengers) accounted for more than half (52) of the 92 road users killed in the 84 collisions reviewed by the FCRC. The largest age cohorts represented in fatalities included persons aged 55–64 years (17%) followed by those aged 25–34 years (15%). Figure 12 presents the age distribution of the motor vehicle occupant fatalities and average Ottawa population.
Vehicle occupants aged 16–24 years killed in collisions were over-represented compared to the Ottawa population. Similarly, older age groups (55+ years) were also still over- represented, but to a lesser extent whereas middle-aged adults (45–54) were under- represented. These findings reflect that teens and young adults as well as aging drivers/occupants are more at risk for collision involvement, albeit for different reasons, and this is consistent with national data (TIRF, 2016).
Figure 12: Age distribution of motor vehicle occupants killed and Ottawa population, 2017–2020
(Ottawa Population Estimates, 2017–2020. Ontario Ministry of Health and Long-Term Care, IntelliHEALTH ONTARIO, Extracted May 27, 2022.)
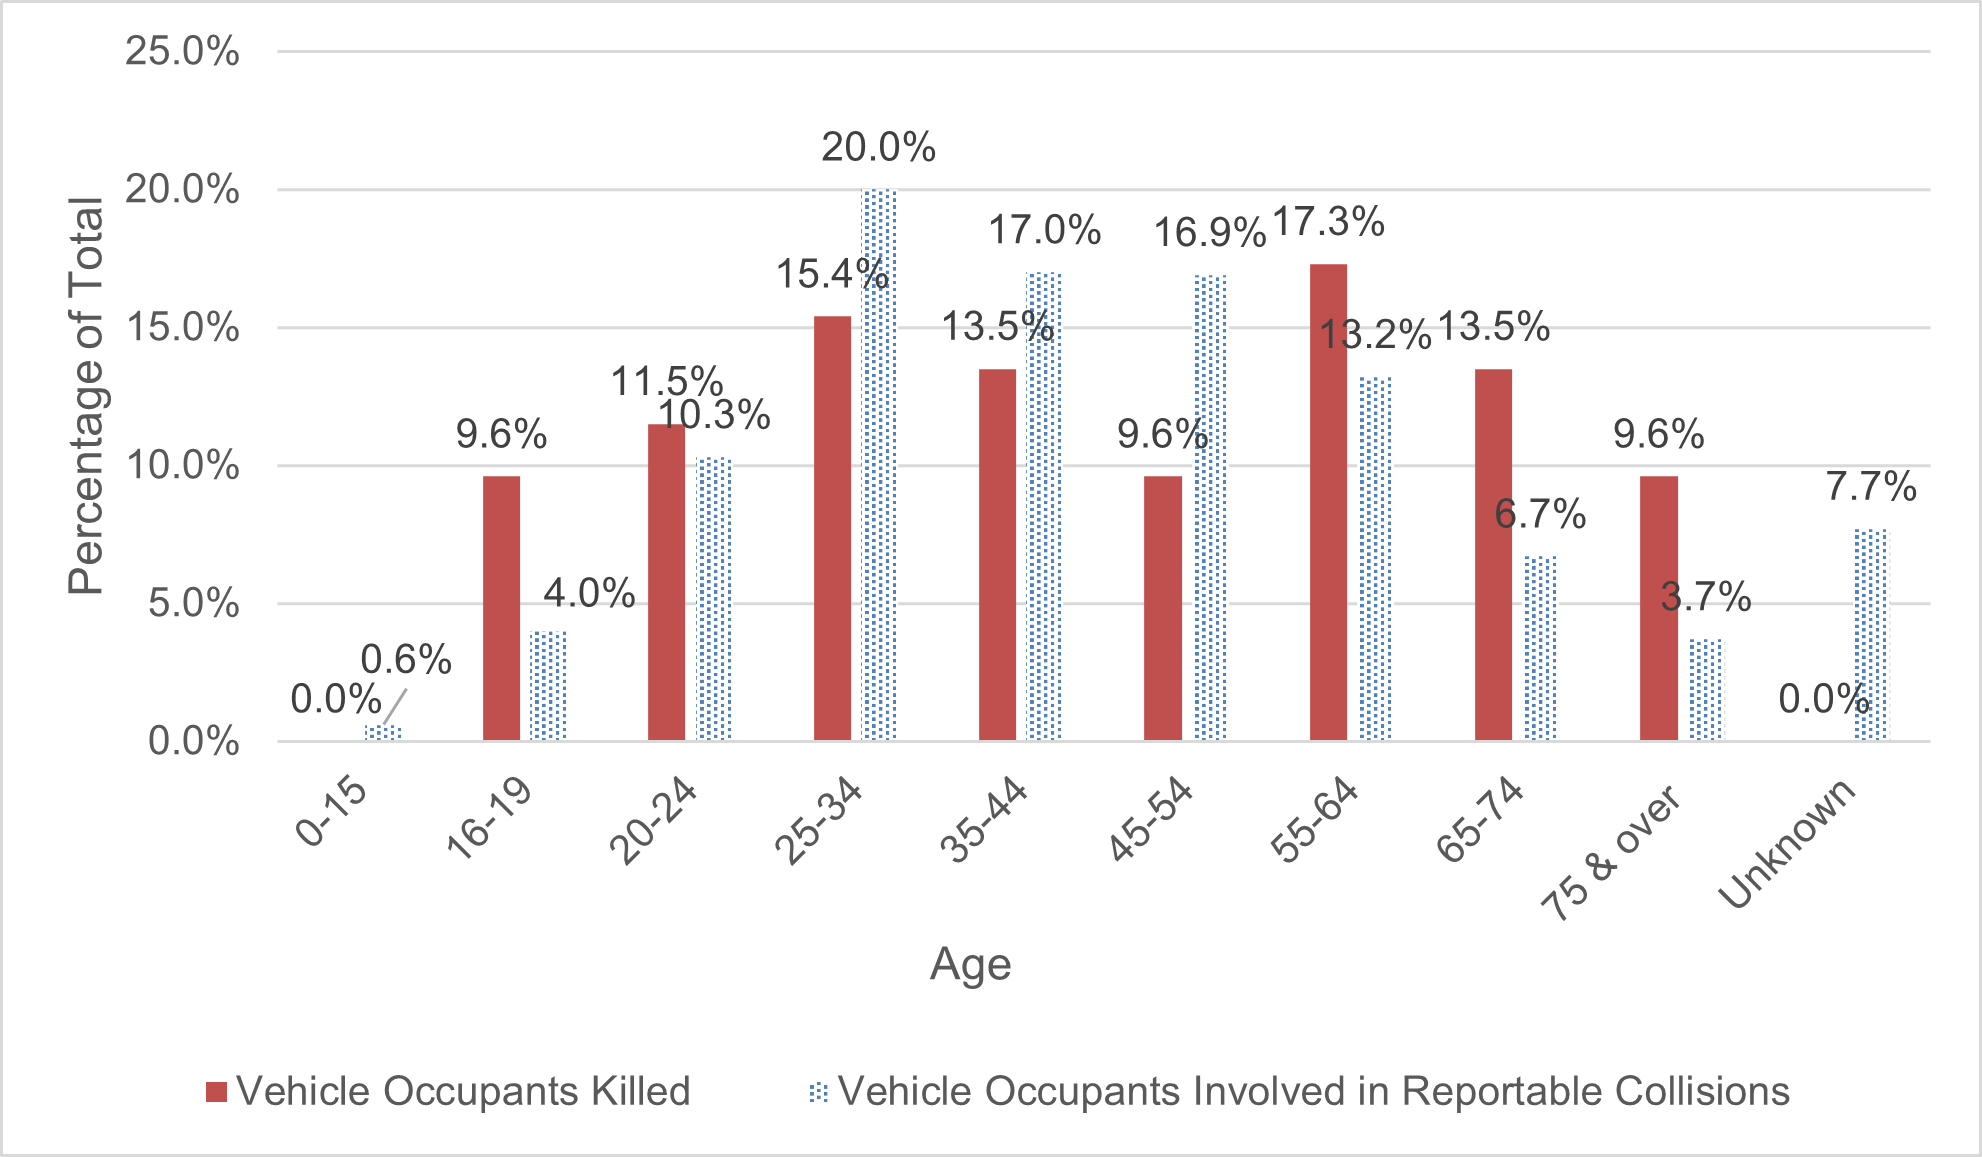
As shown in Figure 13 comparing the distributions of vehicle occupants killed to that of vehicle occupants involved in reportable collisions revealed an over-representation in the 16–24 year age range and the 55+ year age. This is similar with respect to the older age category to the findings when comparing motor vehicle occupants killed to the City of Ottawa population age group.
Figure 13: Age distribution of motor vehicle occupants killed and motor vehicle occupants involved in reportable collisions, 2017–2020
Vulnerable road users
Motorcycle riders and persons using active transportation modes such as walking, cycling, or riding an e-bike are more vulnerable than other road users because they lack the protective exterior of a vehicle and important in-vehicle safety features to mitigate injuries. Among the 92 road users killed, 40 were considered vulnerable road users. There were insufficient data points to assess each of these road user types separately due to small numbers; however, Figure 14 shows the distribution of vulnerable road users killed compared to the average Ottawa population by age group.
For every age group under 55, the percentage of vulnerable road users killed is lower than the corresponding percentage of population in each of the age groups. Like the data for all road users killed, more than expected vulnerable road users were killed in the age groups over 55. The 55–64 age group represents 35% of the vulnerable road users killed, which is almost three times as high as the percentage of the population in that age group.
Figure 14: Distribution of vulnerable road users killed and average Ottawa population by age group, 2017–2020
(Ottawa Population Estimates, 2017–2020. Ontario Ministry of Health and Long-Term Care, IntelliHEALTH ONTARIO, Extracted May 27, 2022.)
Younger age vulnerable road users were less likely to be killed in road crashes compared to the general population whereas the opposite was true for older age road users. Of the 22 pedestrians killed, 82% were aged 55 and older, which far exceeds the 29% of the population of the same age. Half of the 55 and older pedestrians killed fell within the 55–64 age range. Though numbers are lower for cyclists and e-bike riders, 43% of the seven killed, fell within the 55–64 age group. The 11 motorcyclists were more evenly distributed between the 25–64 age ranges.
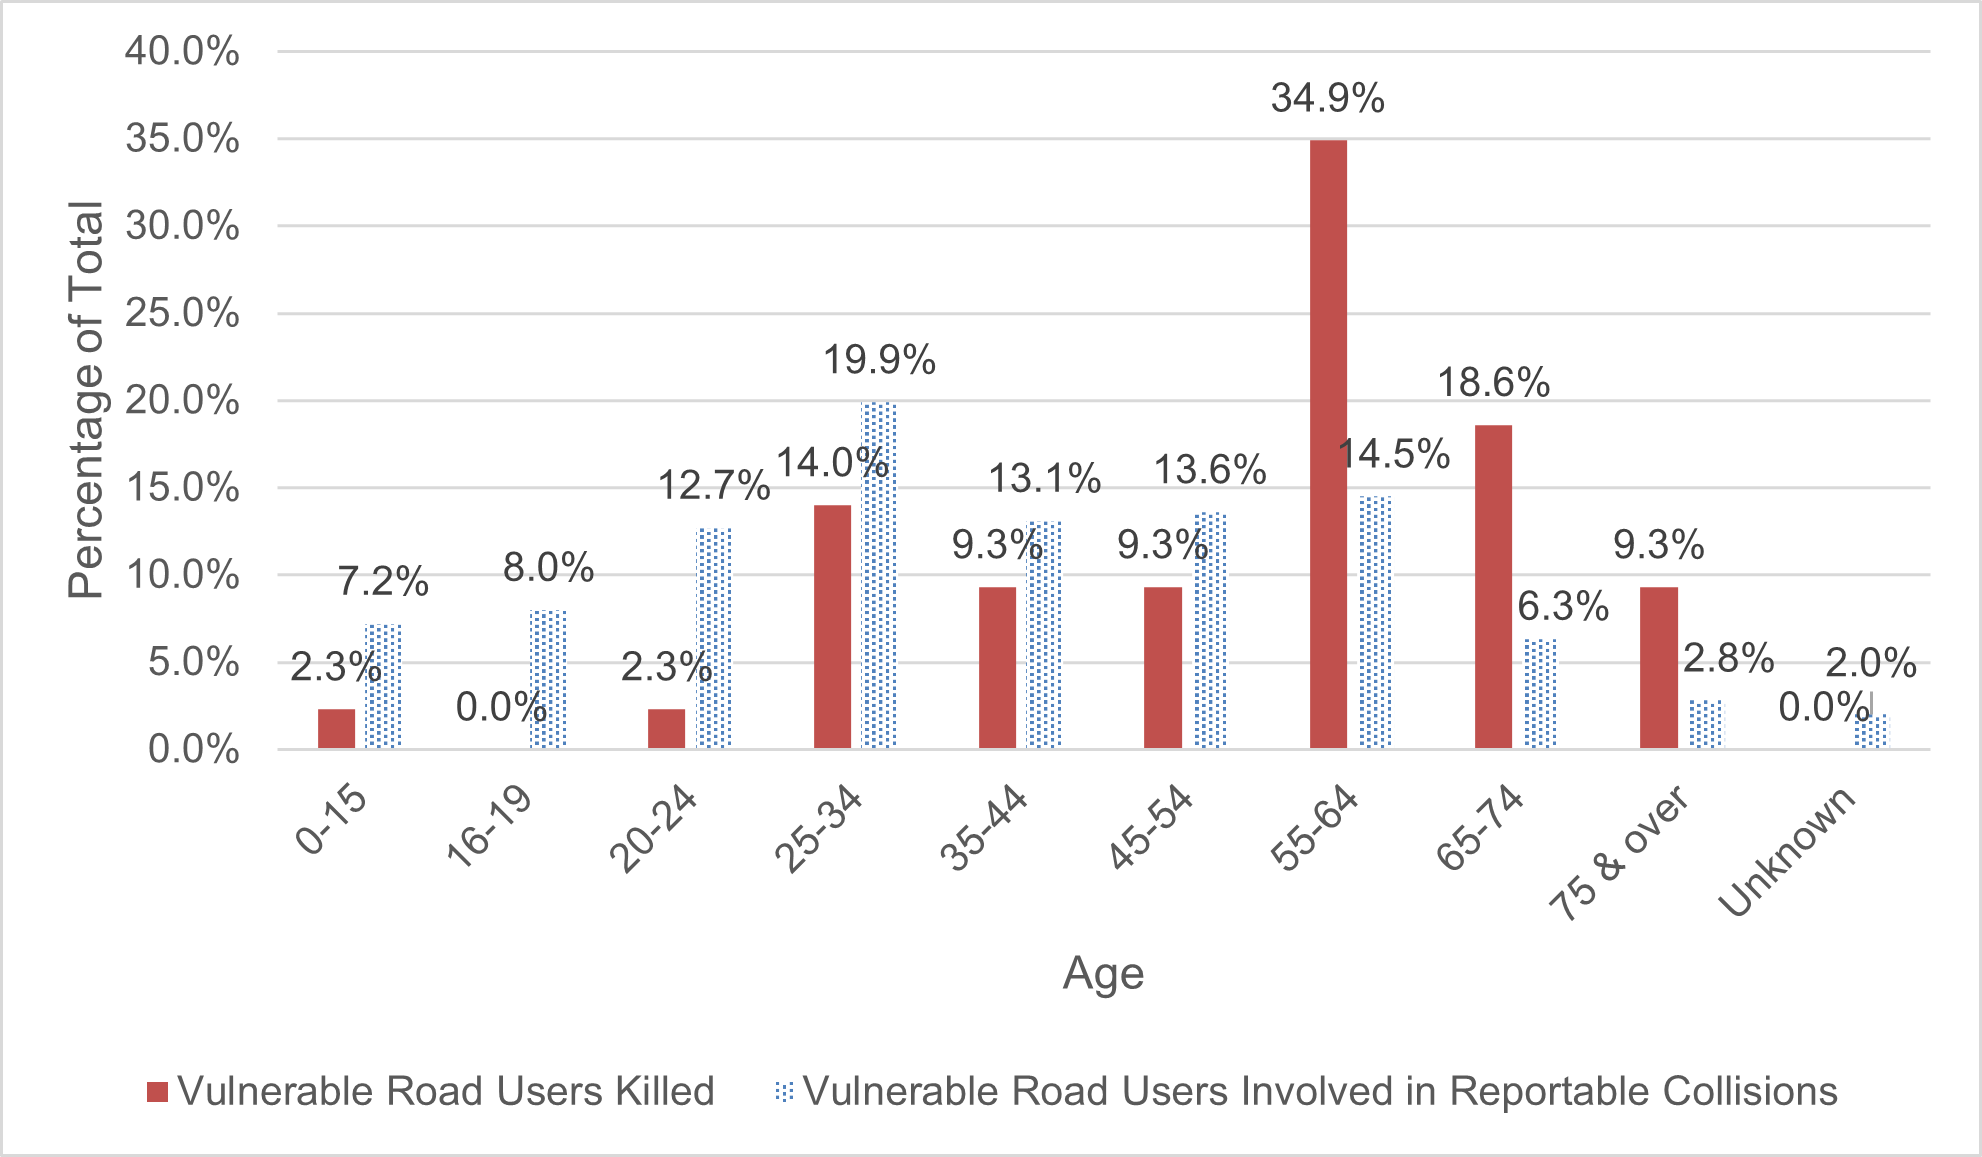
Comparing the distributions of vulnerable road users killed and those involved in reportable collisions showed an over-representation of 55 years and older involved in fatal collisions as shown in Figure 15. This is similar to the findings when comparing vulnerable road users killed to the City of Ottawa population age group.
Figure 15: Distribution of vulnerable road users killed and involved in reportable collisions by age group, 2017–2020
Sex
According to City of Ottawa statistics, males represented 49% of the Ottawa population and accounted for 57% of those involved in reportable collisions. Males are typically more often involved in collisions than their female counterparts, but this gap has been slowly closing in the past decade, particularly in relation to young drivers, and with respect to distracted driving and impaired driving (Robertson et al., 2014; Robertson et al., 2011; Schwartz & Rookey, 2008; Lyon et al., 2020).
In terms of road users killed in fatal collisions reviewed by the FCRC, males are also over-represented compared to the Ottawa population, most notably among drivers, cyclists and motorcyclists, as summarized in Table 7.
| Road user type | Female fatalities | Male fatalities | Total | % Male |
|---|---|---|---|---|
| Motor vehicle driver | 13 | 25 | 28 | 66 |
| Motor vehicle passenger | 7 | 7 | 14 | 50 |
| Pedestrian | 8 | 14 | 22 | 64 |
| Motorcyclist | 1 | 10 | 11 | 91 |
| Cyclist | 1 | 3 | 4 | 75 |
| E-bike rider | 0 | 3 | 3 | 100 |
| Total | 30 | 62 | 92 | 68% |
More than two-thirds (68%) of the 92 road users killed in fatal crashes were male which is larger in comparison to the Ottawa population and persons involved in reportable collisions. Although there were fewer passengers who were killed in crashes than drivers, it is interesting to note that this passenger category was the only one to match the percentage of males in the population.