Drivers in fatal collisions
This section summarizes findings related to vehicle drivers involved in fatal collisions. Drivers of vehicles not requiring a licence to operate it (i.e., bicycles, e-bikes, construction equipment) who were involved in collisions are excluded from this analysis. Many collisions involve more than one motor vehicle and therefore more than one driver.
Comparisons of drivers involved in fatal collisions to the licensed driver population (an estimated 650,000 in Ottawa) can reveal whether the number of drivers involved in the fatal collisions varies from the population based on several characteristics such as age, sex or type of licence held. The information about licenced drivers contained in this report was obtained from the Ontario Road Safety Annual Report 2018 and was the most recent data available at the time this report was drafted.
Between 2017 and 2020, a total of 128 drivers were involved in the 84 fatal collisions reviewed by the FCRC. More than one-third (38%) of the 128 drivers involved in these collisions, or 49, were killed as a result of the collision.
Age
Table 8 summarizes drivers involved in fatal collision by age group and year. Drivers aged 25–34 years represented the largest segment of those involved in fatal collisions, followed closely by those aged 35–64. To this end, younger and older age groups of drivers are estimated to have lower exposure on the road (i.e., they are estimated to drive fewer kilometres annually) which may be a factor in fewer fatalities in these cohorts.
| Age group | Number of drivers 2017 | Number of drivers 2018 | Number of drivers 2019 | Number of drivers 2020 | Number of drivers total |
|---|---|---|---|---|---|
| 16–19 | 4 | 1 | 0 | 0 | 5 (4%) |
| 20–24 | 3 | 5 | 2 | 2 | 12 (9%) |
| 25–34 | 12 | 5 | 5 | 2 | 24 (19%) |
| 35–44 | 3 | 4 | 5 | 8 | 20 (16%) |
| 45–54 | 6 | 5 | 6 | 6 | 23 (18%) |
| 55–64 | 5 | 6 | 8 | 3 | 22 (17%) |
| 65–74 | 4 | 4 | 2 | 3 | 13 (10%) |
| Unknown | 0 | 0 | 1 | 0 | 1 (1 %) |
| 75 plus | 2 | 3 | 2 | 1 | 8 (6%) |
| Total | 39 | 33 | 31 | 25 | 128 (100%) |
The age cohort with the lowest number of drivers involved in fatal collisions is 65–74 years of age. Often older age drivers tend to drive fewer kilometres or in lower risk conditions because they recognize some natural aging processes can negatively impact motor coordination or hazard detection or eyesight (Feng et al., 2020).
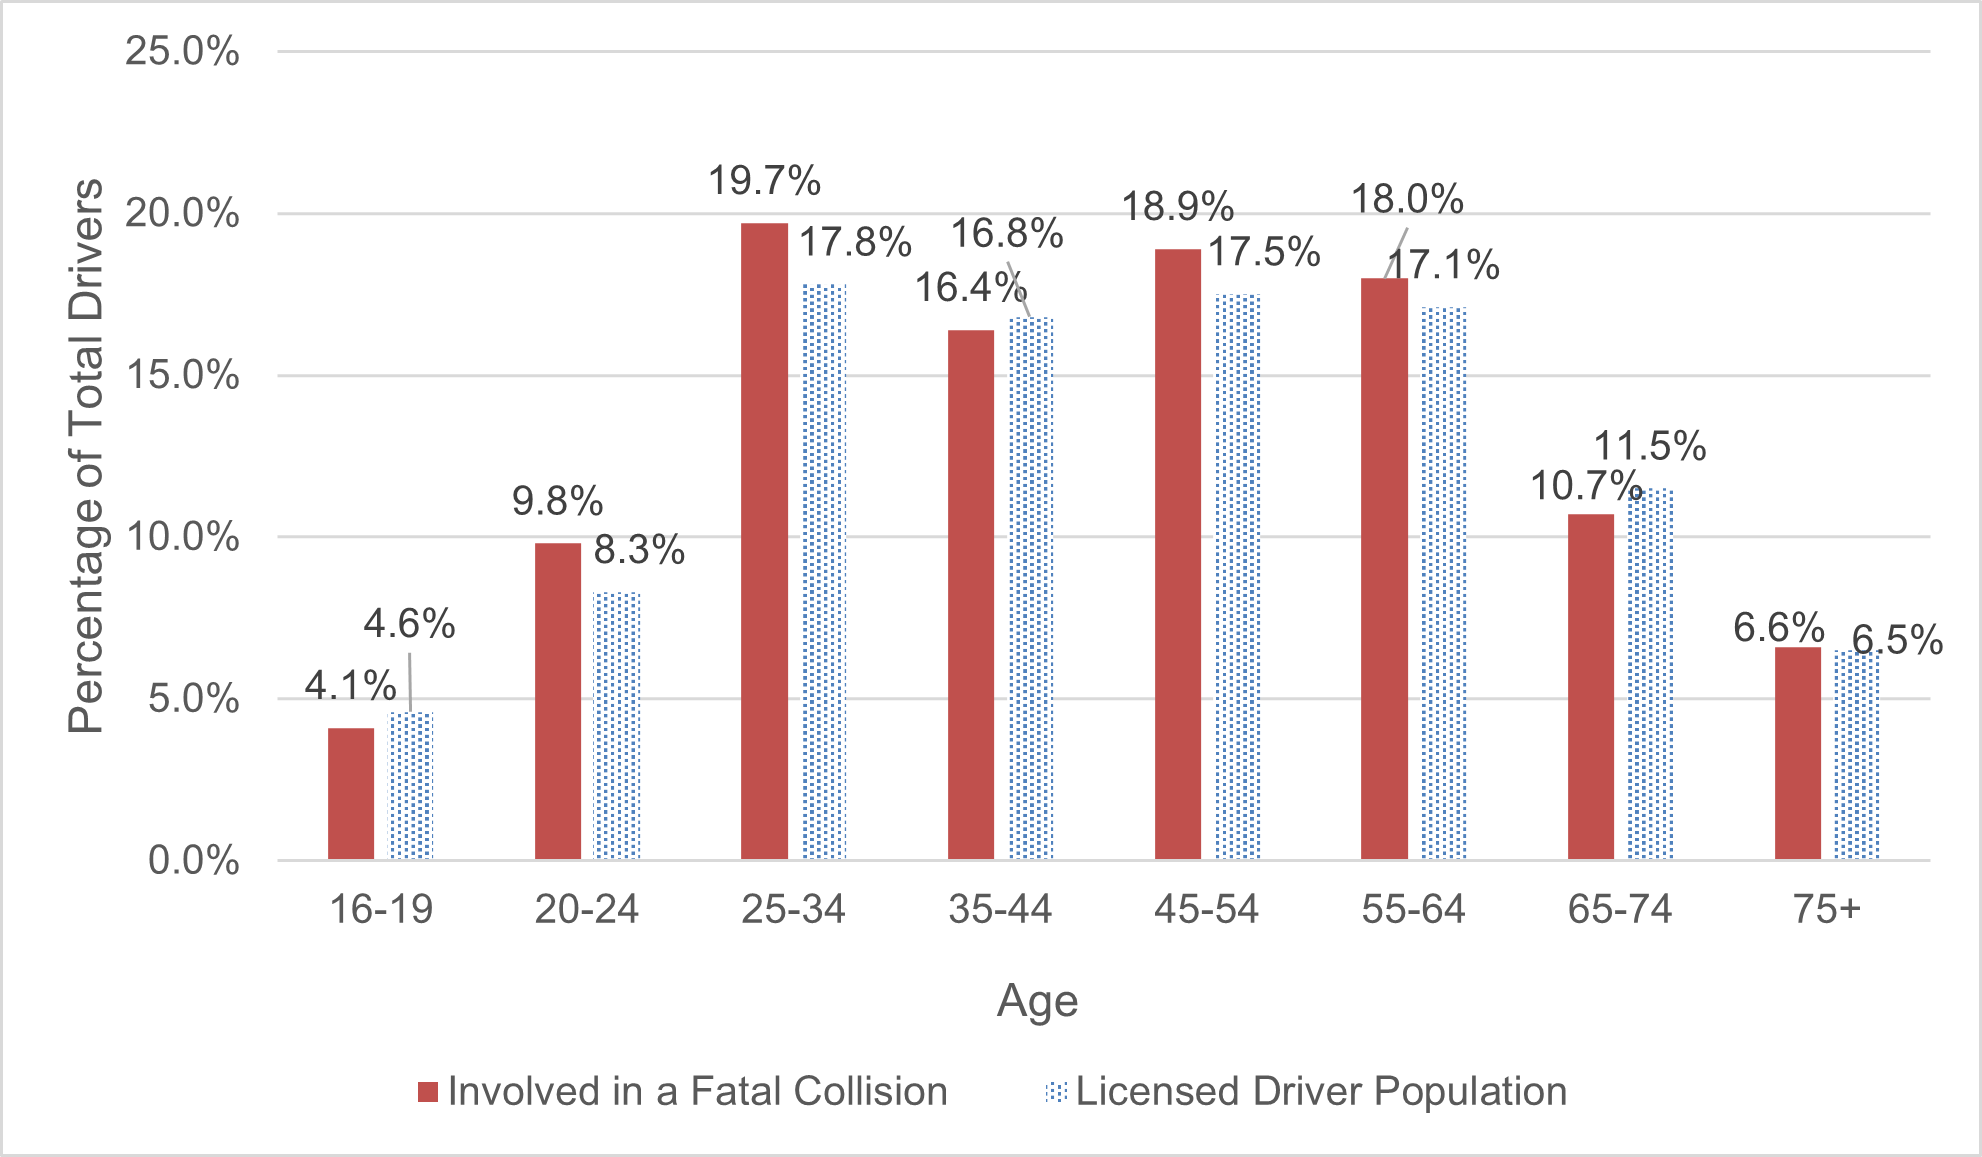
Figure 16 compares the percentage of the 128 drivers involved in fatal collisions by age group to licenced drivers in each age group. In general, the distribution of all drivers involved in the fatal collisions is comparable with the distribution of licenced drivers in terms of age. However, the percentage of drivers involved in fatal collisions aged 20–34 years and 45–64 years is larger when compared to licenced driver populations in these age groups. Motorcyclists involved in fatal collisions were also equally distributed across the 25–64 age categories.
Figure 16: Distribution of drivers involved in fatal collisions and licenced driver population by age group
Ottawa Population Estimates, 2017–2020. Ontario Ministry of Health and Long-Term Care, IntelliHEALTH ONTARIO, Extracted May 27, 2022
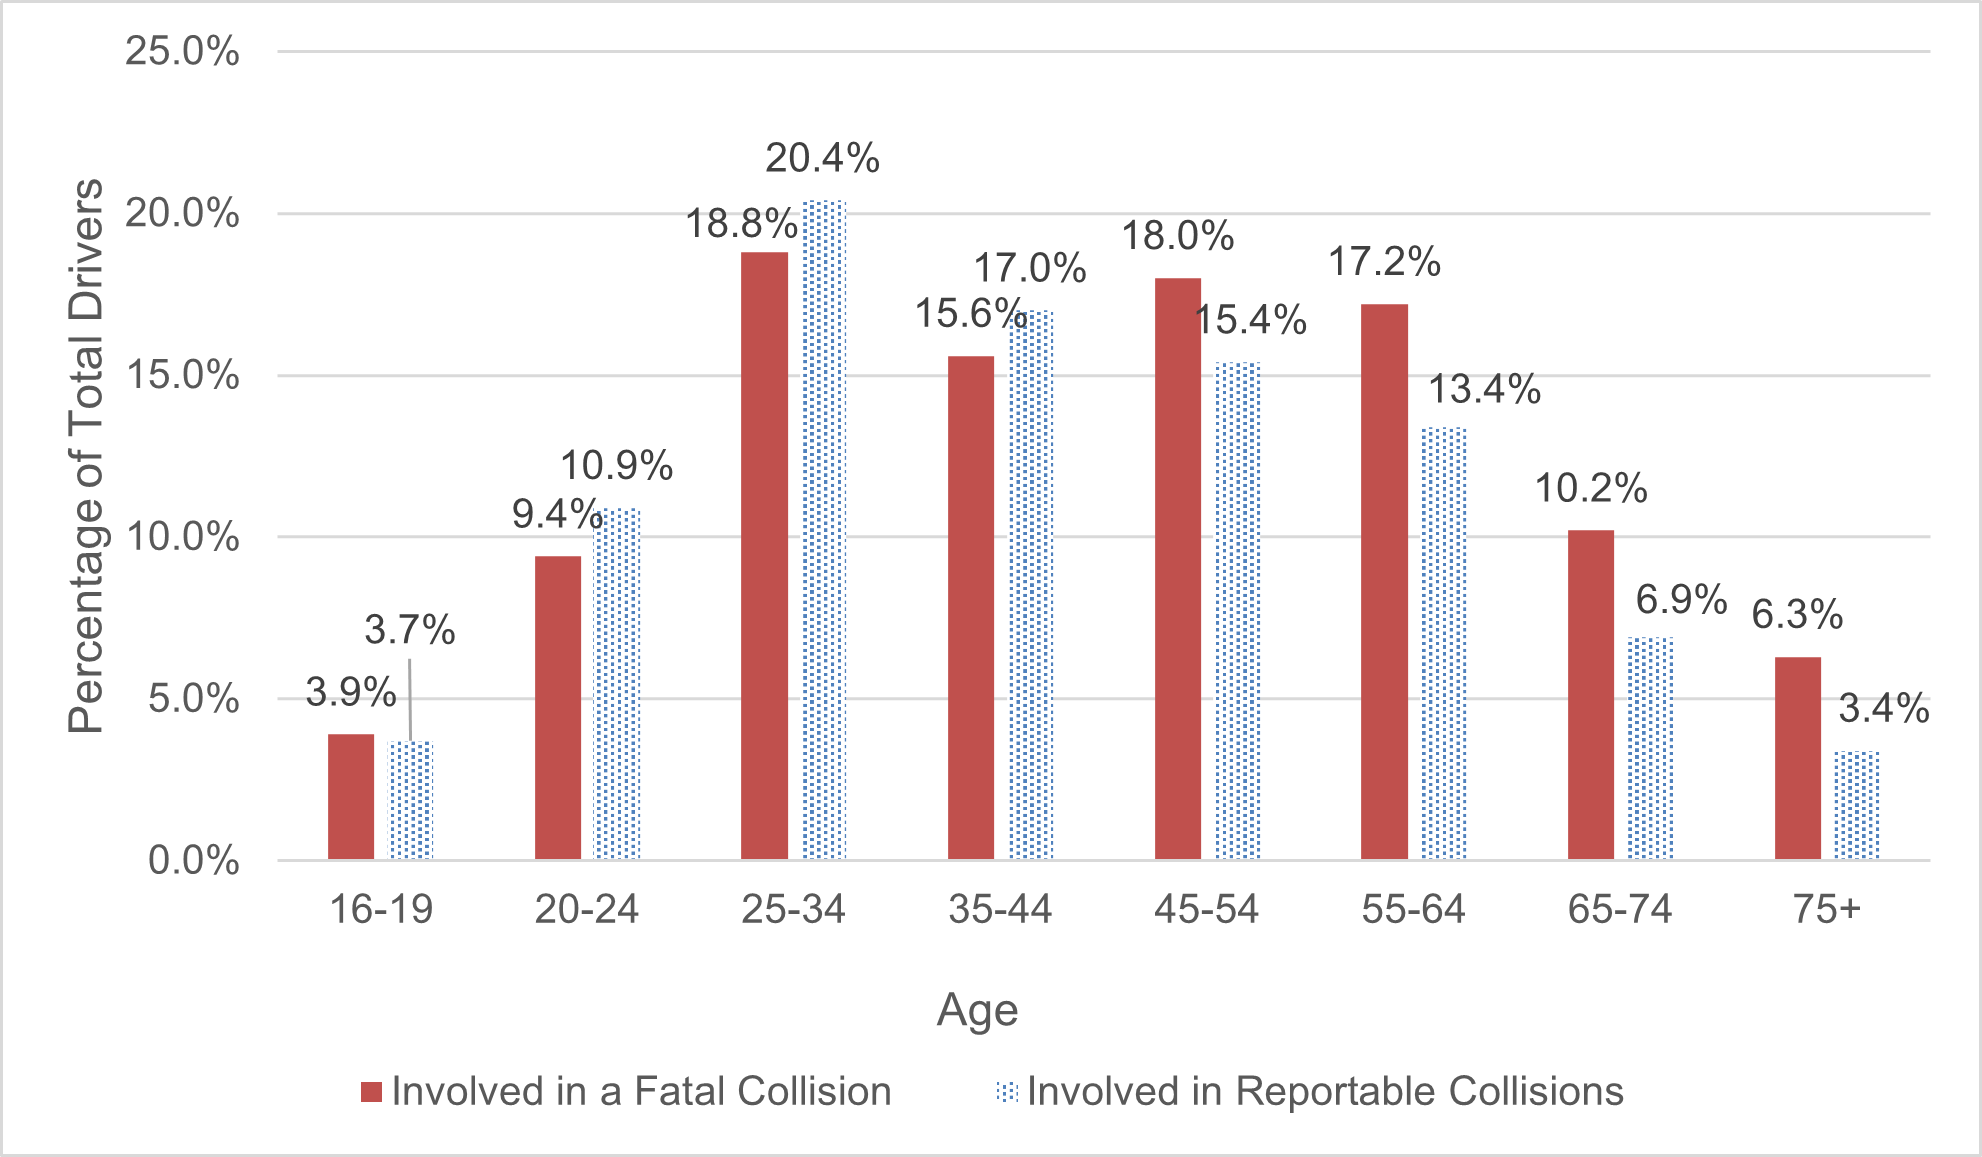
A comparison of the age of drivers involved in fatal collisions with those involved in reportable collisions is presented in Figure 17. It revealed that somewhat fewer younger aged drivers were involved in fatal as compared to reportable collisions. Conversely, older age cohorts were slightly over-represented in fatal collisions.
Figure 17: Distribution of drivers involved in fatal collisions and reportable collisions by age group
Sex
Almost three-quarters (70%) of the 128 drivers involved in the 84 fatal collisions were male. This percentage was higher in comparison to the 52% of males in the licenced driver population. The percentage of males was also slightly higher than the 57% of males involved in reportable collisions (or 62% of known drivers in collisions) in Ottawa from 2017–2020: Females accounted for 35% of drivers in fatal collisions.
The percentage of male drivers involved in fatal collisions by age is presented in comparison with the percentage of male drivers in the provincial licenced driver population in Figure 18. Males in fatal collisions are over-represented in every age cohort when compared to the licenced driver population. However, only males aged 35–44 and 65–74 are over-represented in reportable collisions. This may be due, in part, to higher levels of exposure.
Figure 18: Males in fatal collisions, reportable collisions and licenced drivers
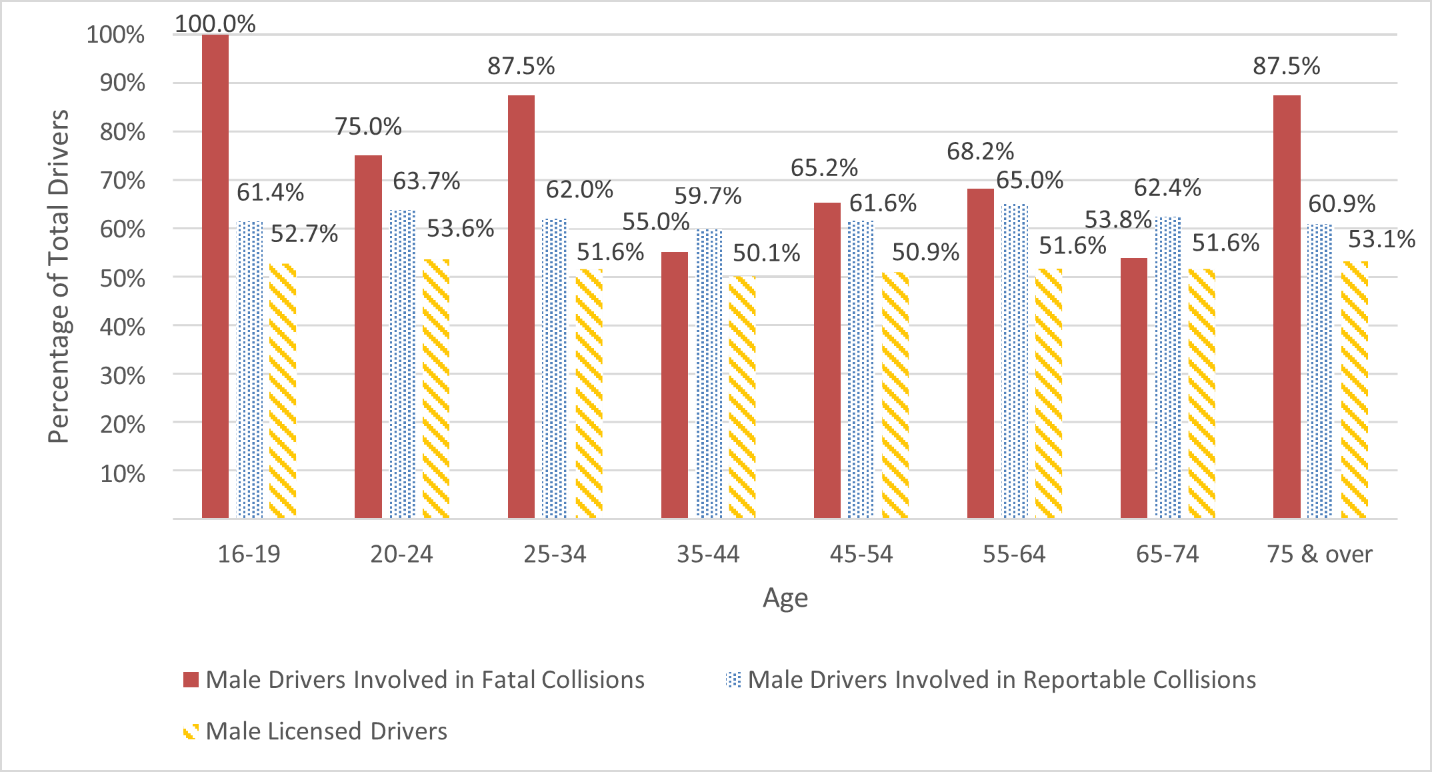
It is apparent that in both younger and older age categories, the difference between sexes is more significant. For those under the age of 35, 85% of drivers involved in fatal collisions were male, compared to the 62% of the drivers involved in reportable collisions and 52% of licenced drivers in that age group. Though male drivers still account for most drivers in the middle age categories, the average is closer to the percentage of licenced male drivers in those age categories.
Males also represented 91% of motorcyclists involved in fatal crashes which, while higher that other types of licenced drivers, more closely aligns with the percentage of male licenced motorcycle riders in the province at 86%. The percentage of male motorcyclists involved in all reportable collisions in Ottawa between 2017 and 2020 was also consistent with the percentage of the provincially licenced male motorcycle population.
Licence status and class
The type of licence held by each driver was reviewed by the FCRC. Almost all (95%) of drivers involved in fatal collisions held a valid licence for the type of vehicle they were driving at the time of the collision except:
- two drivers were unlicenced
- one driver had an unknown status
- three drivers held licences in other jurisdictions and information was not available
There are a number of classes of driver licences in the provincial licencing system which, when combined, can produce a total of 55 types of licences. Drivers in fatal collisions between 2017 and 2020 represented a small number of types of licences. The types of licences held by drivers in fatal collisions and drivers in the 2018 provincial driver population are presented in Table 9.
| Licence class | Percentage of total drivers involved in fatal collisions % |
Percentage of total licenced drivers (based on data obtained from the Ontario Road Safety Annual Report 2018) % |
|---|---|---|
| G | 70 | 82 |
| G1 or G2 only | 9 | 14 |
| A, B, C, D, E, F | 16 | 4 |
| None | 2 | N/A |
| Unknown | 4 | N/A |
| Total | 100 | 100 |
The class G licence is standard among drivers of cars and light trucks and is the most common licence type held in Ontario. In 2018, more than two-thirds (70%) of drivers involved in fatal collisions held this class compared to more than three-quarters (82%) of licenced drivers in the province.
The G licence is one of two licence classes within Ontario which are part of a graduated licencing system. It requires mandatory testing and practice prior to allowing the holder to advance to the next stage in the process. Both the G1 and G2 licences place certain restrictions and drivers must comply with them. 9% of drivers involved in the fatal collisions held G1 or G2 licences compared to 14% of the licenced driver population. In other words, younger age drivers who typically hold these licences are less likely to be involved in fatal crashes because of the proven safety benefits of graduated driver licencing systems (Vanlaar et al., 2009; Masten et al., 2015; McCartt & Teoh, 2014).
The A through F class licences allow holders to drive various types of larger vehicles ranging from medium size trucks to tractor trailers and buses. Each of these licences permit holders to drive vehicles covered under certain lower licence classes as well as vehicles covered under a class G licence. In 2018, approximately 16% of drivers involved in fatal collisions held A-F licences, however, just 4% of licenced drivers in Ontario held an A-F class licence.
The class M licence allows holders to drive a motorcycle. Like the G licence, there is a graduated licensing process which includes specific testing and practice time to move from M1 to M2 to full M licence with applicable restrictions at each of the stages. The M series of licences can be the only licence a driver holds but often drivers hold another type of licence as well. Less than 0.02% of licenced drivers in Ontario held an M licence without another type of licence in 2018.
Slightly more than one in ten (12%) of drivers involved in the fatal collisions held an M or M2 licence combined with one or more of the G or A through F licences. However, not all of them were driving a motorcycle at the time of the fatal collision. In the provincial licenced driver population, 6% of licenced drivers held an M, M1 or M2 licence. More than one-third (36%) of motorcyclists involved in fatal collisions held an M2 licence with the remaining motorcyclists holding a full M licence.
Previous convictions
The number of previous convictions for traffic-related offences among drivers in fatal collisions reviewed by the FCRC was considered. Offences under the Highway Traffic Act (e.g., speeding, red light running, distraction) or Criminal Code of Canada (e.g., drinking and driving, dangerous driving, fleeing the scene) were included and are summarized in Figure 19.
Figure 19: Previous convictions for drivers involved in fatal collisions 2017–2020
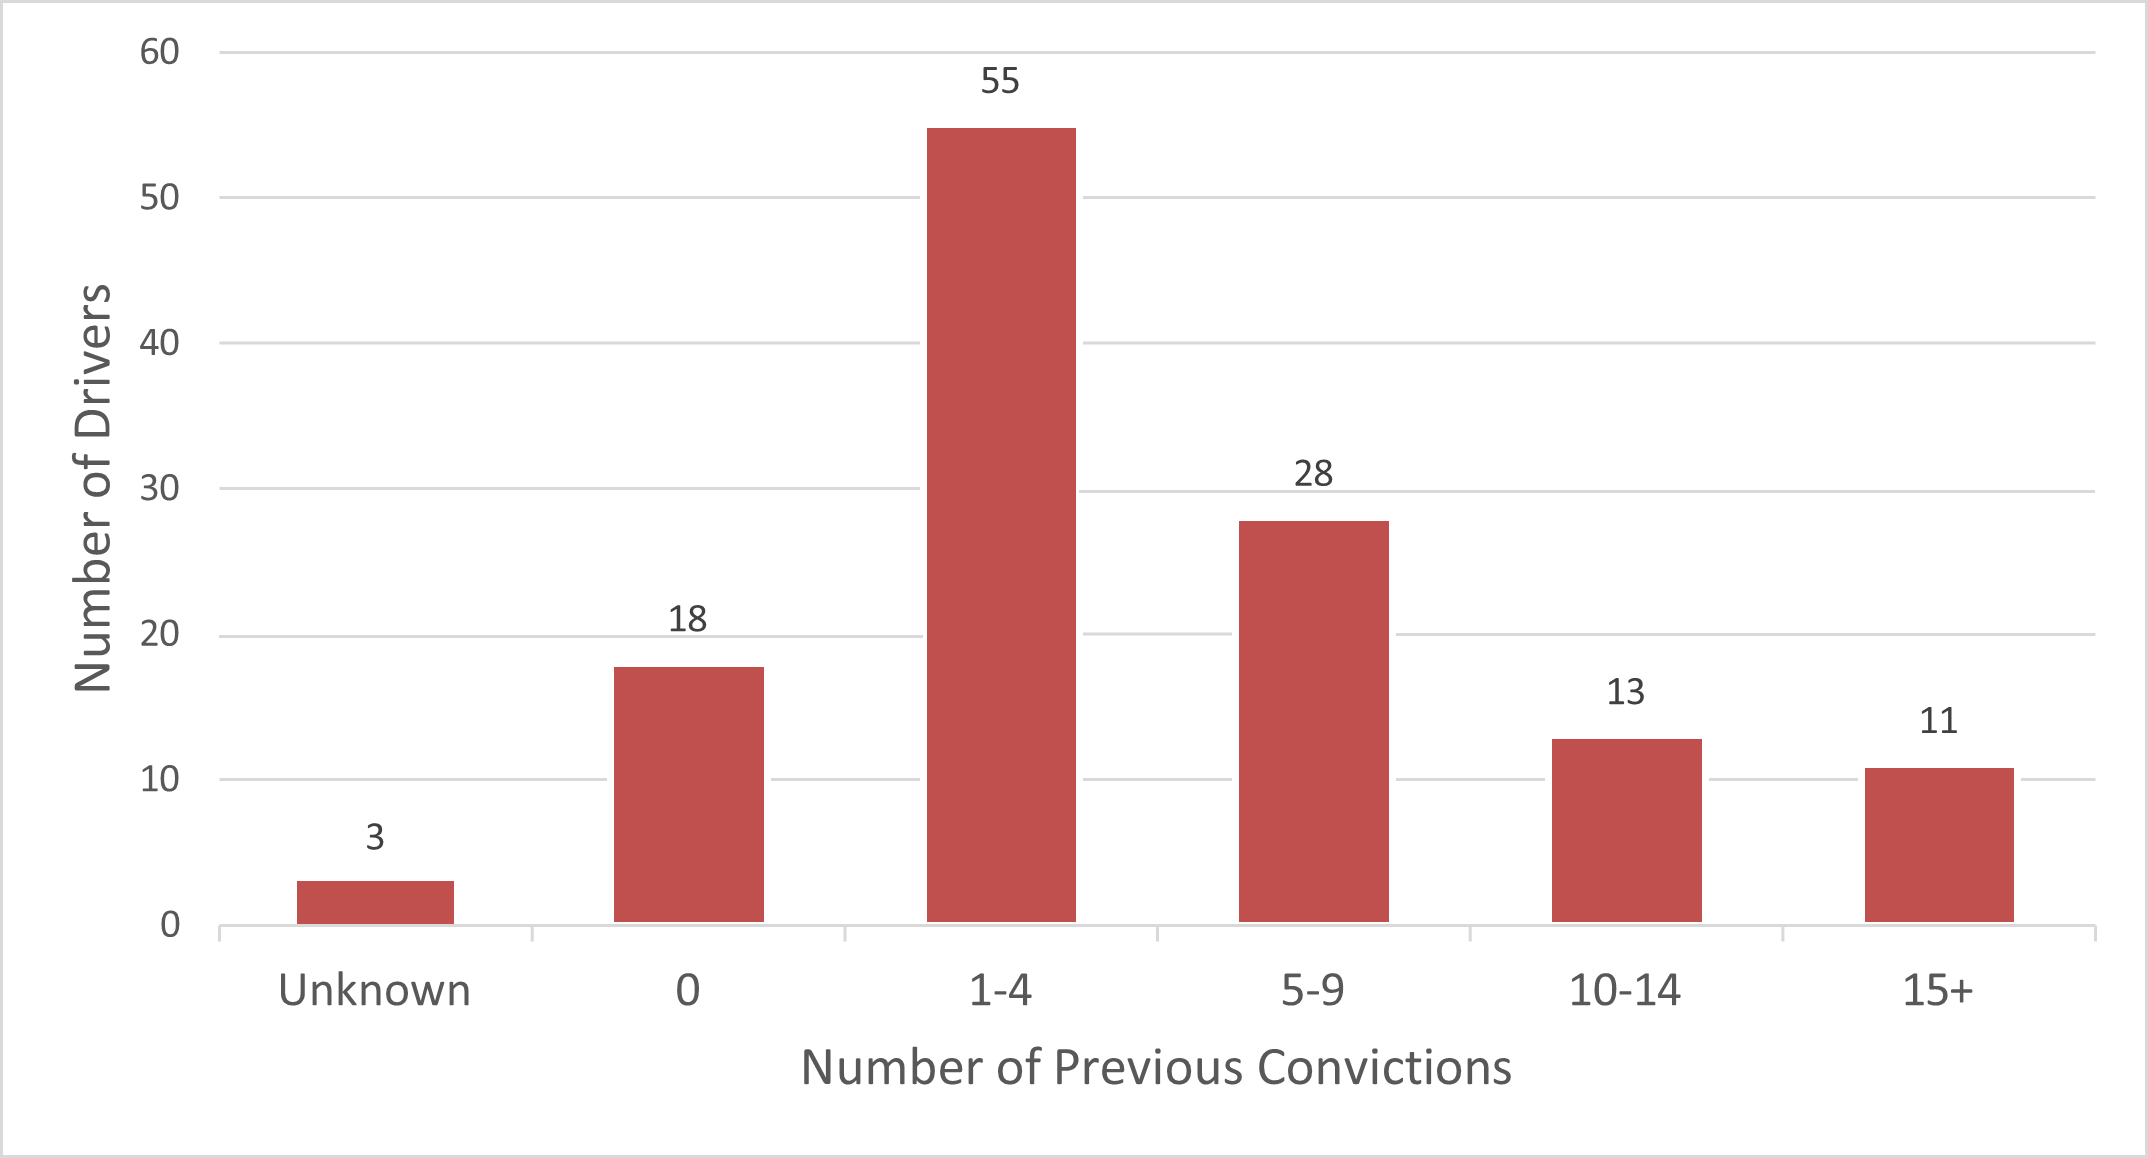
Among drivers involved in fatal collisions for whom records were available, the average number of previous convictions was 5.3, with a range of 0 to 29 previous convictions. Almost one in five (19%) drivers had more than 10 previous convictions. Data with respect to the prevalence of convictions for prior traffic offences is not readily available for the entire licenced driver population in Ontario, nor is it available for drivers involved in non-fatal reportable collisions. As such, it was not possible to draw comparisons with respect to this driver characteristic.
Speeding
When a fatal collision occurs, oftentimes the speed of vehicles involved in the collision can be determined by Fatal Investigators as part of collision reconstruction. In some collisions more than one driver was found to be speeding. Our data captures this due to the extensive review and analysis conducted. Speed was determined for 109 of the 128 drivers involved in collisions reviewed by the FCRC. Speeding was defined as a driver travelling in excess of the speed limit. Almost half (45%) of the 109 drivers for whom speed was determined in the investigation were engaged in speeding at the time of the collision. In other words, speed is prevalent in fatal collisions in Ottawa. Figure 20 summarizes the number of drivers travelling over the speed limit at the time of the fatal collision from 2017 to 2020, and it is important to note that fatal collisions on 400-series highways are excluded from this report.
Figure 20: Number of drivers travelling by km/h over the speed limit
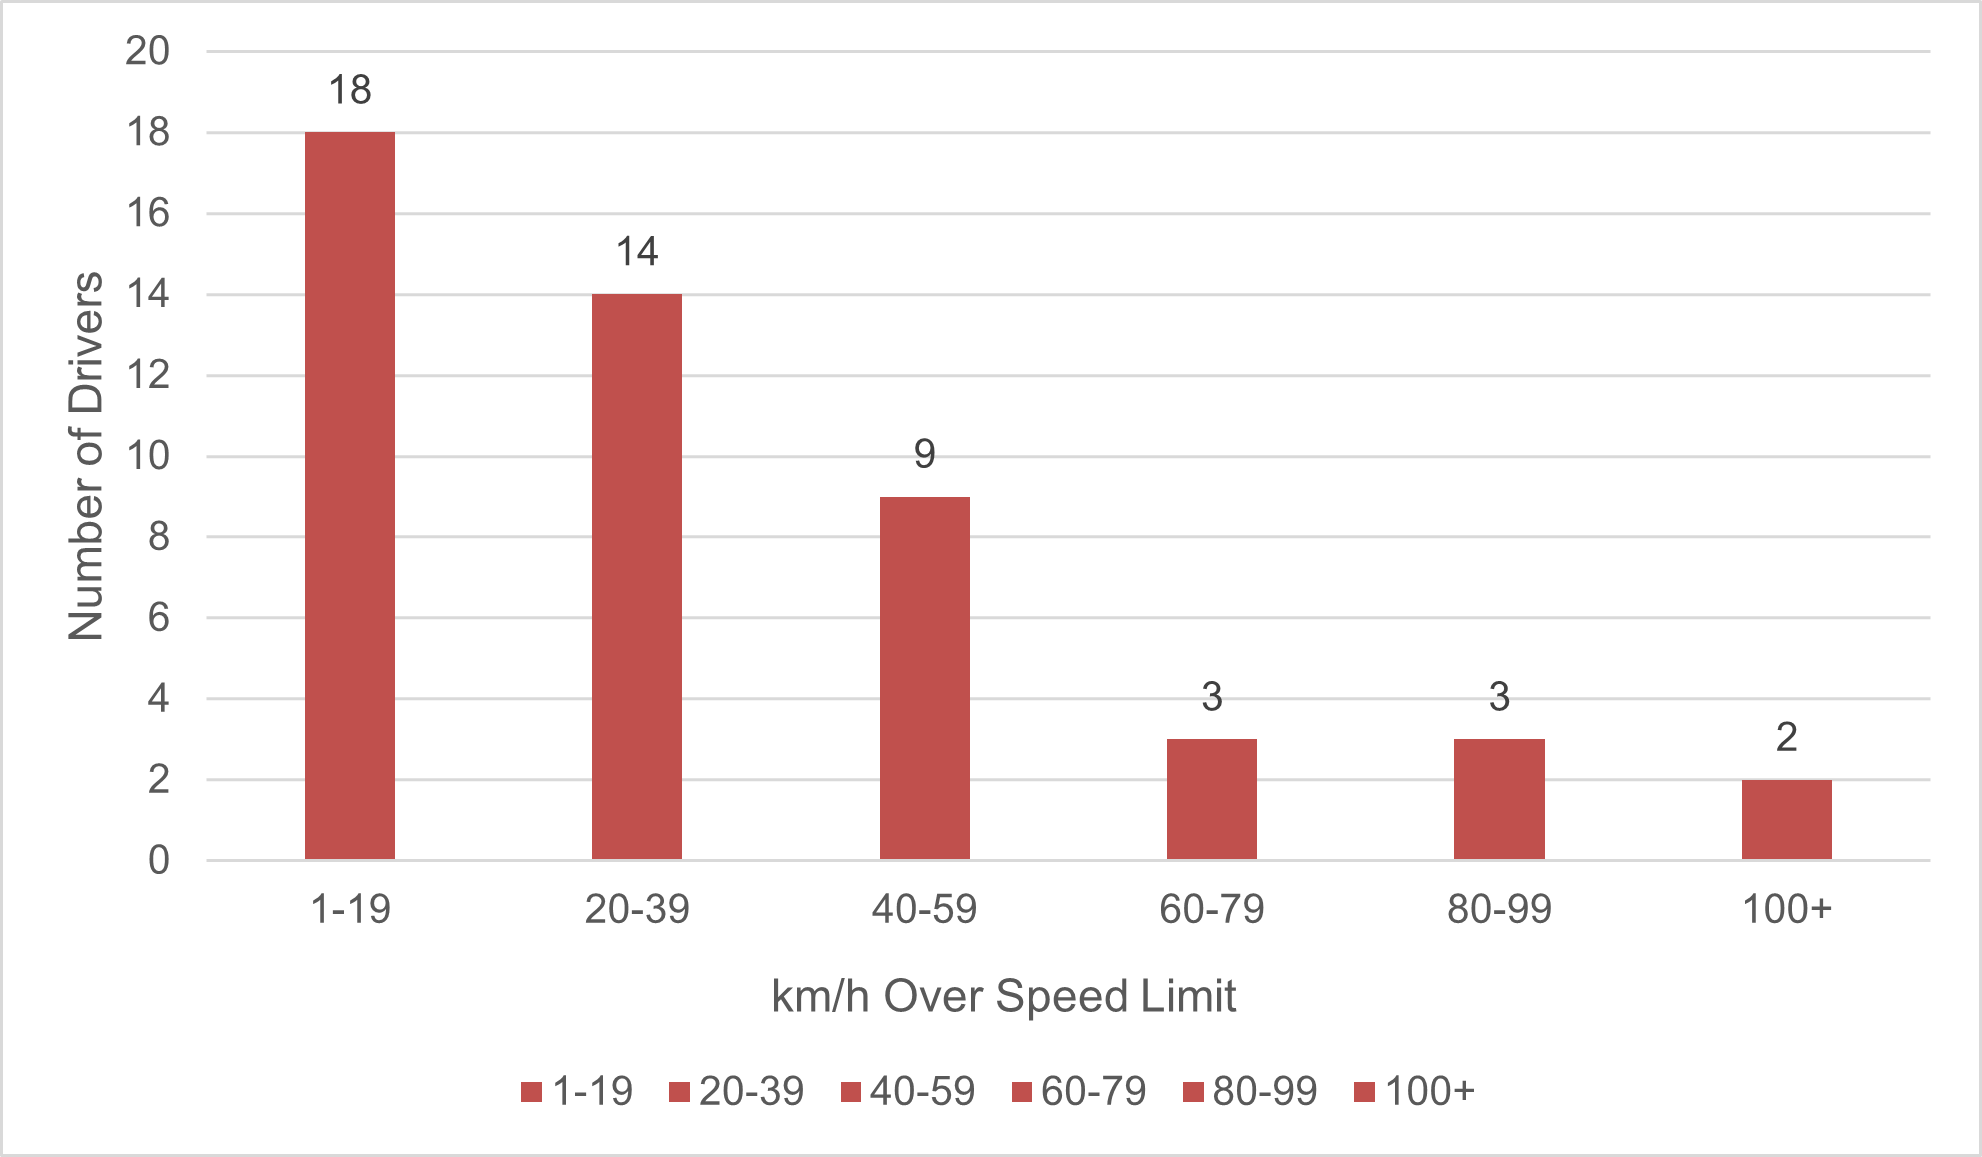
Among the 49 speeding drivers in fatal collisions, almost two-thirds (31) were travelling at least 20 km/h or more over the speed limit and were deemed to be engaged in excessive speeding. More concerning, five drivers were travelling at 80 km/h or more over the speed limit, and the highest speed by drivers in fatal collisions was 135 km/h over the speed limit.
Though not a direct comparison, national data indicates speed is generally a factor in 25% of fatal collisions across Canada and approximately 300 people are killed annually as a result of speeding (TIRF National Fatality Database, 2022). Reviewing MVCR data for fatal collisions in the City just over 20% note speeding as a factor, which aligns with the national data. To help place this data in context, speed is directly related to crash risk and small increases in speed translate into large increases in crash risk. For example, travelling just 10 km/h over the speed limit is estimated to double crash risk while a speed of 20 km/h increases crash risk sixfold (Kloeden et al., 2001).
The frequency of speeding among all Ottawa drivers is not available for comparison, and there are also limitations on speeding information collected through collision reports. MVCRs include a code related to driver speed at the time of collision, but this is typically under- reported in less severe collisions because collision investigations are less detailed compared to fatal collisions. Usually, speed is self-reported by drivers or witnesses if available. For this reason, there is limited opportunity to compare these numbers to the population of non-fatal reportable collisions to provide context.
Drug and/or alcohol use
Fatally injured road users are subject to the testing of post-mortem blood samples for alcohol and drug levels. This is not limited to drivers but would be considered for all fatally injured road users (pedestrians, cyclists, e-bike riders, motorcyclists) involved in collisions reviewed by the FCRC. Surviving drivers in impaired driving collisions are also assessed by police to determine whether drivers are impaired. This assessment may involve direct observations, results of behavioural tests, and breath and blood tests. Consideration is also given to driving behaviour as determined by the police investigation.
The FCRC reviewed police charges for impaired driving among surviving drivers, as well as post-mortem drug and alcohol toxicology in deceased road users combined with the traffic collision investigation results to determine if drugs or alcohol were possible factors in collisions. The review looked at both impairment and presence of drugs and alcohol. Table 10 summarizes the number of fatal collisions each year in which impairment by alcohol or drugs was a factor.
| Impairment in collision | 2017 | 2018 | 2019 | 2020 | Total |
|---|---|---|---|---|---|
| Yes | 9 | 5 | 5 | 9 | 28 (33%) |
| No | 14 | 16 | 18 | 8 | 56 (67%) |
| Total | 23 | 21 | 23 | 17 | 84(100%) |
One-third (33%) of fatal collisions reviewed by the FCRC involved one or more road users determined to have alcohol and/or drugs over the legal limit in their system at the time of the collision. Impairment by alcohol or drugs was not a factor in the remaining two-thirds (67%) of collisions. Due to the inclusion of vulnerable road users, in our analysis this is slightly higher than 2019 national data which showed approximately 26.2% of fatalities involved alcohol used by either a dying or a surviving driver (TIRF National Fatality Database 2022).
More than half (54%) of fatal collisions reviewed by the FCRC involved one or more road users determined to have the presence of alcohol or drugs in their system (though may have been below the legal limit) at the time of the collision. Table 11 summarizes the number of fatal collisions each year in which alcohol or drug use was present.
| Presence of alcohol/drugs in collision | 2017 | 2018 | 2019 | 2020 | Total |
|---|---|---|---|---|---|
| Yes | 15 | 8 | 9 | 13 | 45 (54%) |
| No | 8 | 13 | 14 | 4 | 39 (46%) |
| Total | 23 | 21 | 23 | 17 | 84 (100%) |
In terms of the most prevalent substances in these fatal collisions, the active ingredient in cannabis (Δ9 tetrahydrocannabinol; (THC) was a factor in almost one in five (19%) fatal collisions. Similarly, cocaine (and its breakdown products) was also a factor in 20% or 17 fatal collisions, and alcohol (ethanol) was a factor in 19% or 16 fatal collisions. Road users often had more than one of these substances present in their system at the time of collision and this is very consistent with national data. While national data about all road users drug and alcohol consumption is not known, in Canada in 2019, approximately half (53%) of drivers in fatal crashes tested positive for the presence of any type of drug. Among this group, almost half (49%) tested positive for cannabis, 42% tested positive for central nervous system depressants, and 35% tested positive for central nervous system stimulants (Robertson, 2022).