Collisions
Collisions on the road involving passenger vehicles, light and heavy-duty transport vehicles, motorcycles and other active transportation modes (e.g., cycling, e-bikes and walking) negatively impact communities every day. While roads are designed to be forgiving of driver errors, the reality is that crashes still occur every day, ranging from the most serious incidents resulting in death, to major and minor injuries crashes, and those involving property damage only. Research has shown driver error or condition is an important factor in a large majority of these collisions, and these collisions have significant direct and social costs for families, for employers, and for communities (NHTSA, 2015).
The good news is that many of these collisions are also preventable. Examination and analysis of collisions and the factors contributing to them can help guide the development of education and mitigation measures to eliminate fatal and serious injury crashes. An overview of the magnitude and seriousness of collisions on Ottawa roads is provided below for this purpose.
Total collisions
There were 47,660 reportable collisions and 95 fatal collisions on City of Ottawa roadways between 2017 and 2020. Eleven of these fatal collisions were determined to involve mental health and medical conditions which cannot be addressed through typical road safety mitigation measures. As such, while they are deemed preventable tragedies, they are beyond the scope of this report and excluded from this analysis.
The majority (80) of 84 fatal collisions involving actionable contributing factors included in the analysis for this report occurred on City of Ottawa roadways; four occurred on private property. A total of 92 persons were killed in these collisions. Fatal collisions on Ottawa roadways exclude fatalities occurring on the 400-series highways.
On average, there were slightly more than 13,000 reportable collisions on City of Ottawa roadways with 22 resulting in fatal injury each year between 2017 and 2019. In 2020, the number of reportable collisions declined by approximately 34% and fatal collisions were down by approximately 23%.
To place these data in context, the City of Ottawa also monitored traffic volumes at several key intersections to gauge the impact of various COVID restrictions put in place since March 2020. These volumes were compared to traffic volumes from previous years to measure the impact of these restrictions on travel behaviour. The data revealed significant fluctuations in traffic volumes in accordance with provincial pandemic restrictions limiting trips outside the home. Between March and December 2020, traffic volumes were generally lower than the same period over previous years. This is consistent with declines reported across other North American jurisdictions and may have contributed to a reduction in collisions. In addition, a national poll of drivers in September 2020 by the Traffic Injury Research Foundation revealed a significant increase in respondents who reported walking (12%) and cycling (152%) (Vanlaar et al. 2020). As such, the analysis with respect to the 2020 data year should be interpreted with this fact in mind.
Road user types
Collisions can involve a number of different types of road users. For the purposes of this report, the collisions were classified by road user type based on the road user who suffered the fatal injury in the collision. In this dataset, there were no collisions in which more than one type of road user suffered a fatal injury.
More than half of these fatal collisions (44) involved only motor vehicle occupants (i.e., drivers or passengers) and approximately one-quarter (22) involved pedestrians. Motorcyclists, cyclists and e-bike riders accounted for smaller numbers of collisions at 11, four and three respectively. Fatal collisions involving different types of road users are presented in Table 1.
| Road user type | Fatal collisions 2017 | Fatal collisions 2018 | Fatal collisions 2019 | Fatal collisions 2020 | Fatal collisions total |
|---|---|---|---|---|---|
| Motor vehicle occupant collisions | 17 | 13 | 5 | 9 | 44 (52%) |
| Pedestrian collisions | 4 | 6 | 9 | 3 | 22 (26%) |
| Cyclist collisions | 0 | 0 | 3 | 1 | 4 (5%) |
| Motorcyclist collisions | 2 | 2 | 5 | 2 | 11 (13%) |
| e-bike rider collisions | 0 | 0 | 1 | 2 | 3 (4%) |
| Total | 23 | 21 | 23 | 17 | 84 (100%) |
Crash severity
Fatal collisions involve the most severe injuries (i.e., death) and are generally much smaller in number compared to all reportable collisions. Of the total reportable collisions for all roadways within the City of Ottawa (including those under provincial and federal jurisdiction) between 2017 and 2020, on average 1% of collisions resulted in fatal and major injuries, while 99% resulted in minimal, minor and property damage only collisions.
For this reason, comparing the distribution of fatal collisions, classified by road users, to the distribution of reportable collisions, by road user, helps to put the severity of collisions for each type of road user in context. A larger percentage of fatal collisions than reportable collisions for each road user type means more severe outcomes are likely to occur in those collisions. Figure 1 summarizes fatal and reportable collisions occurring annually on City roadways by road user type from 2017 to 2020.
Figure 1: Distribution of fatal and reportable collisions by road user type, 2017–2020
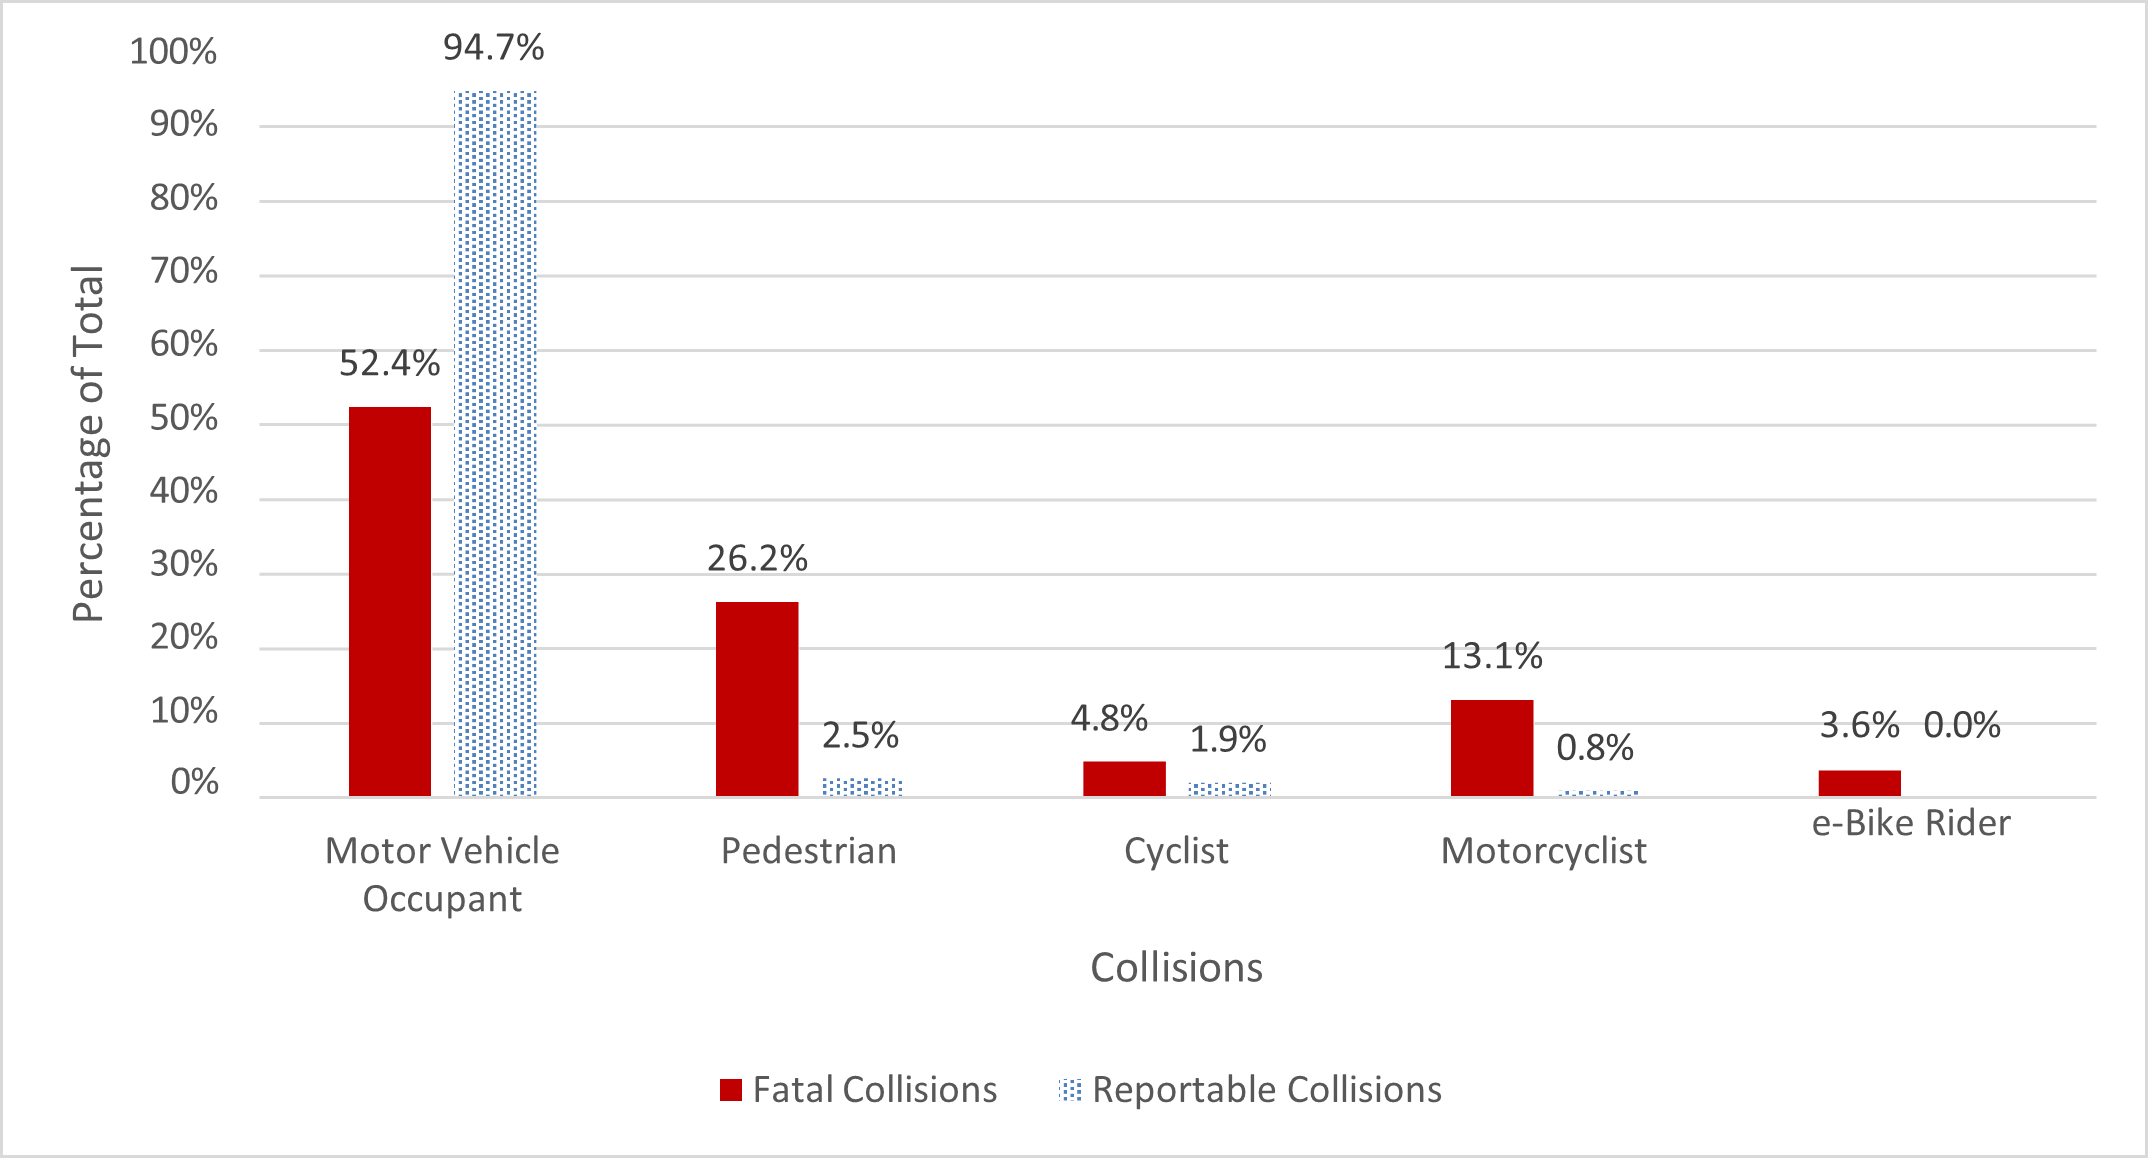
Annually, fatal collisions represented less than 1% (approximately 0.18%) of total reportable collisions between 2017 and 2020 on City roadways. An examination of the distribution of fatal collisions by road user type revealed motor vehicle occupants accounted for slightly more than half (52%) of fatal collisions as compared to 95% of reportable collisions. In other words, motor vehicle occupants are less likely to be killed in crashes and this is generally due to the fact vehicles provide the highest level of engineered protection.
Conversely, pedestrians and motorcyclist collisions accounted for a much larger percentage of fatal collisions than reportable collisions. For example, motorcycle collisions represented just 1% of all reportable collisions but 13% of all fatal collisions reviewed by the FCRC. The same is true for cyclists who are also over-represented in fatal collisions (4.8%) compared to all reportable collisions (1.9%), as well as e-bike riders who represented up to 4% of fatal collisions compared to 0.04% of reportable collisions. However, it is noted that the number of reportable collisions involving e-bike riders is likely under-reported because e-bikes are not identified as a specific vehicle class on the provincial MVCR, and instead they are coded as bicycles. At this time, City of Ottawa can only identify e-bike collisions if it is noted in the comment section of the MVCR. However, due to growing concern with respect to the possible misuse of e-bikes and their collision involvement, the FCRC agreed it was important to begin tracking e-bike collisions separately as a result of observations from the FCRC review of road fatalities.
Temporal factors in collisions
Collision location, seasonal weather conditions, and other temporal factors such as day of week and time of day provide important insight into high-crash and high-risk conditions which are useful to inform the implementation of preventive measures. This section explores several of these factors which is useful to guide the selection and use of various crash reduction strategies.
Geographic areas
Crashes recorded in the City of Ottawa are analyzed according to five geographic areas which have distinct land use and transportation characteristics. These areas are designated:
- central business district
- core residential
- suburban inside the Greenbelt
- suburban outside the Greenbelt
- rural
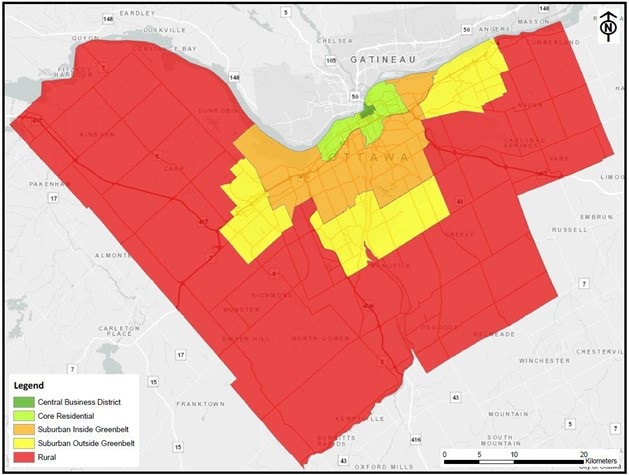
The central business district represents the urban core and is characterized by high density commercial or residential land uses, high levels of multi-modal travel and lower speeds resulting from greater traffic congestion and more constrained conditions. Moving outward from the downtown core, other areas are increasingly represented by lower density land use with rural areas having the lowest density. In addition, areas become increasing more car- centric with fewer alternative travel modes and greater travel speeds on roads. Figure 2 contains a map delineating the boundaries of each geographic area. Table 2 summarizes the number of fatal collisions occurring annually in each of them.
Figure 2: Geographic areas within the city of Ottawa
| Geographic area | Fatal collisions 2017 | Fatal collisions 2018 | Fatal collisions 2019 | Fatal collisions 2020 | Fatal collisions total |
|---|---|---|---|---|---|
| Central business district | 1 | 0 | 1 | 0 | 2 (2%) |
| Core residential | 1 | 2 | 3 | 2 | 8 (10%) |
| Suburban inside Greenbelt | 7 | 5 | 7 | 4 | 23 (27%) |
| Suburban outside Greenbelt | 2 | 5 | 9 | 3 | 20 (24%) |
| Rural | 11 | 9 | 3 | 8 | 31 (37%) |
| Total | 23 | 21 | 23 | 17 | 84 (100%) |
Year-over-year, the number of fatal collisions occurring in each area is quite variable. Since the number of fatal collisions is relatively small, it is important to consider these variations in terms of numbers instead of percentage changes to aid with the interpretation of these fluctuations.
A comparison of the distribution of fatal collisions to reportable collisions is useful to determine whether fatal crashes are equally distributed across all geographic areas based on the percentage of reportable collisions. While one might expect these proportions to be equal, in fact they are not. More than one-third (31) of fatal collisions occur in rural areas, followed by slightly more than one-quarter (27) in suburban areas inside the Greenbelt, whereas the largest proportion of reportable collisions occur in suburban areas inside the Greenbelt, followed closely by core residential areas and suburban areas outside of the Greenbelt. In other words, a larger percentage of fatal crashes occur in less dense geographic areas with higher travel speeds and fewer transportation options. Figure 3 presents a comparison of the percentage of total fatal collisions occurring within each area to the percentage of reportable collisions.
An examination of the collisions classified by road user type in each of these geographic areas is also useful to guide a discussion of prevention strategies and road improvements. In rural areas, a large majority (87%) of fatal collisions are classified as motor vehicle occupant collisions. Figure 4 shows a breakdown of collisions by road user (vulnerable road user collisions were grouped together as numbers were small when spread across the area types). As geographic areas become increasingly dense and closer to the central business district, the percentage of fatalities involving vulnerable road users increases from 60% in the suburban outside Greenbelt area, to 65% in the suburban inside Greenbelt area, to 75% in the core residential to 100% in the central business district.
Figure 3: Distribution of fatal and reportable collisions by geographic area, 2017- 2020
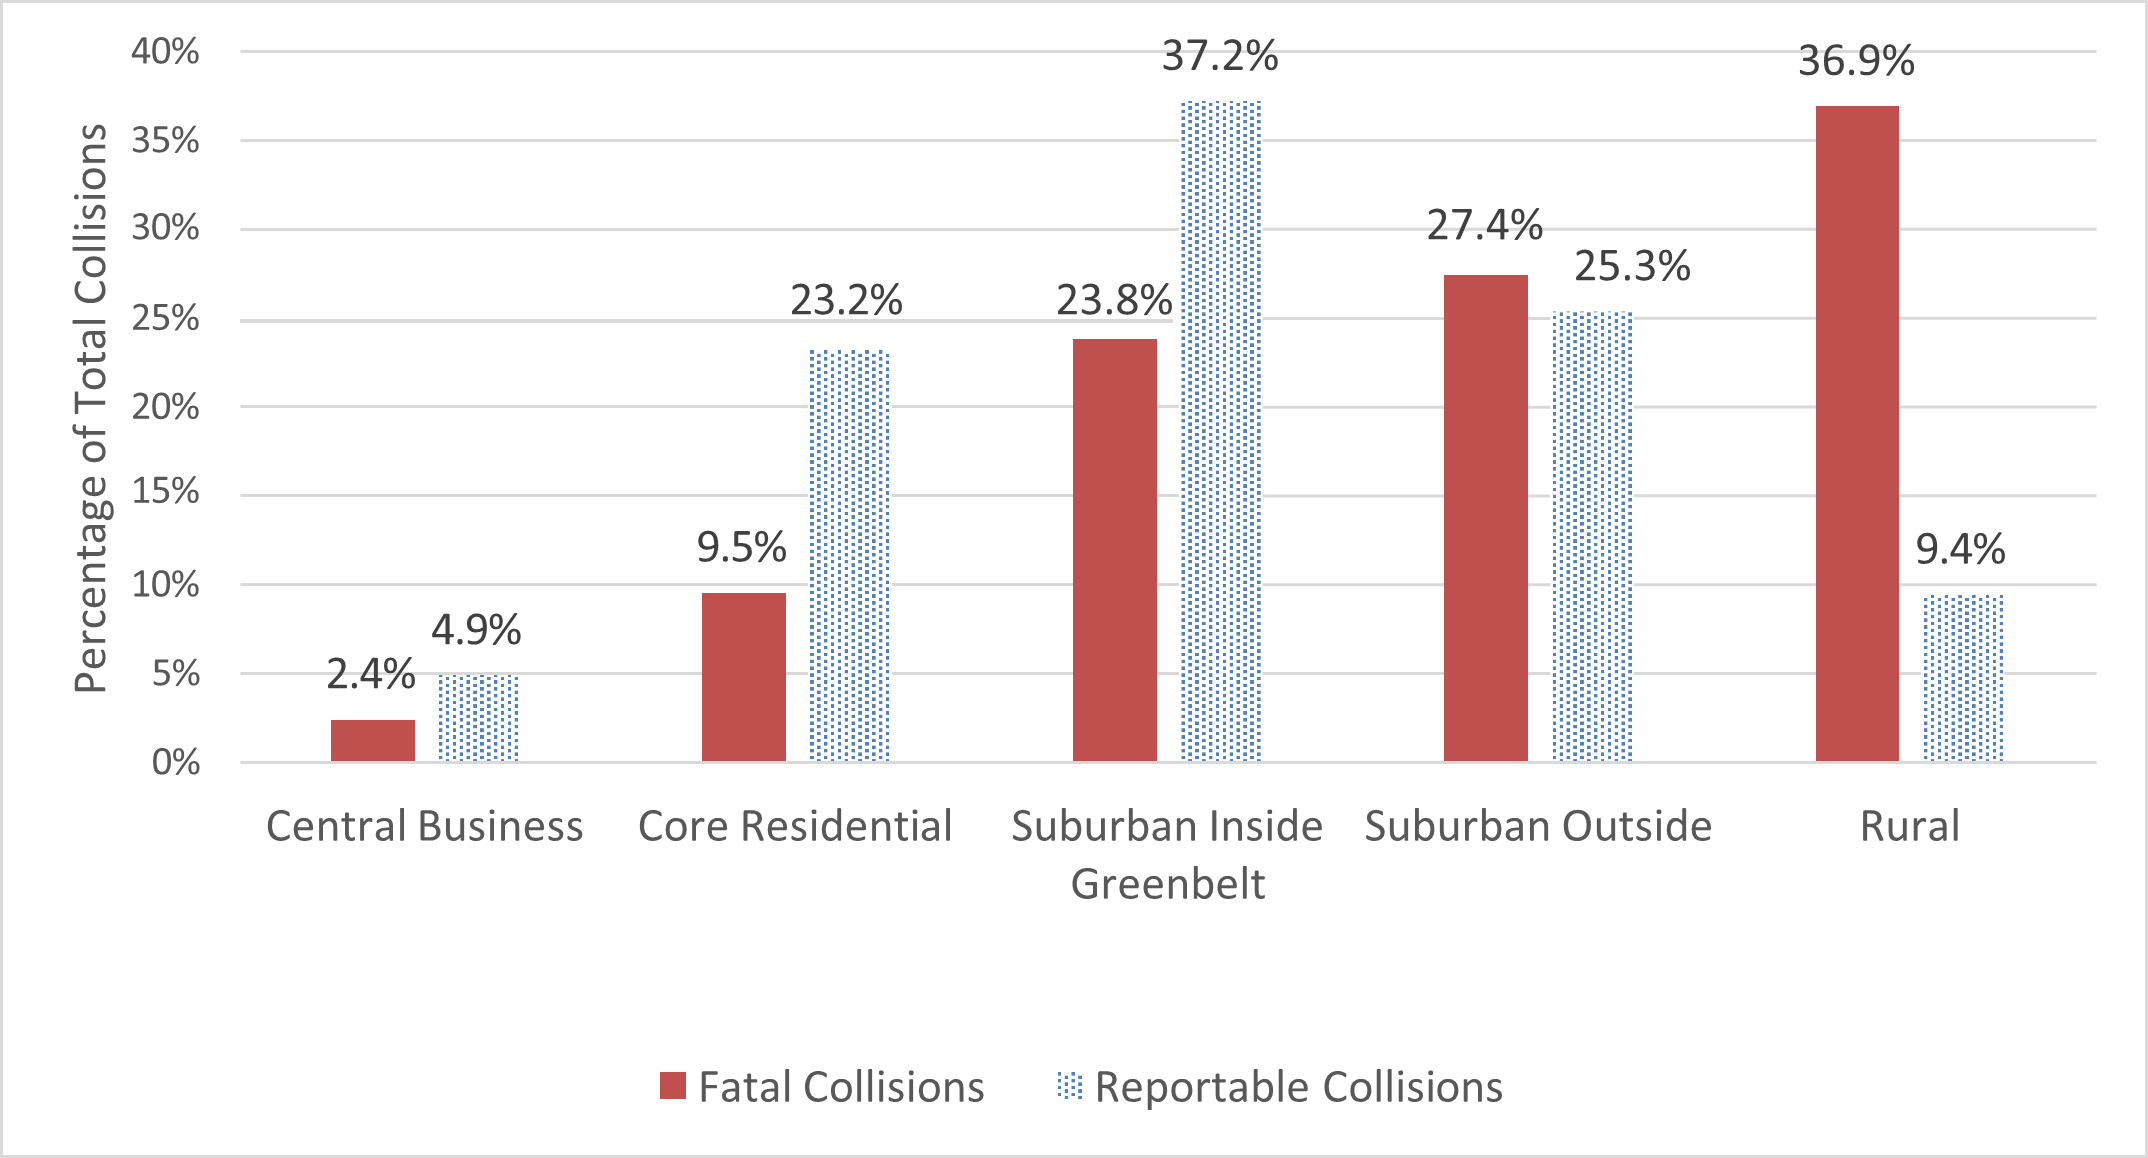
Figure 4: Fatal collisions by geographic area and road user, 2017–2020
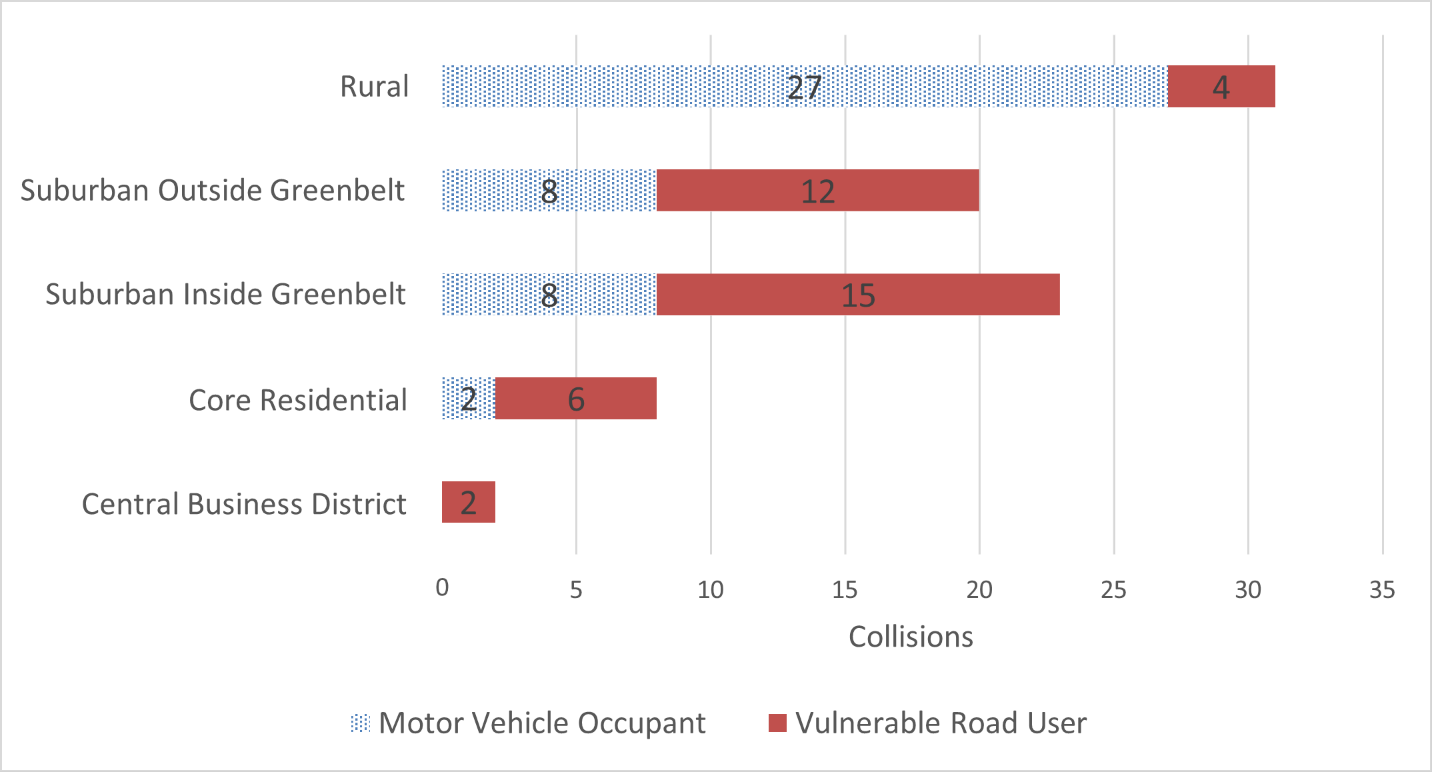
Notably, all the motorcycle collisions occurred in suburban and rural areas of the city with less congestion and higher travel speeds, while 91% of pedestrian collisions occurred in the core residential and suburban areas with higher levels of road congestion. A total of four cyclist collisions occurred in the following areas: one in the central business district, one in the core residential and two occurring in the suburban outside the Greenbelt. All the fatal e-bike rider collisions occurred in the suburban inside the Greenbelt area.
Seasonal distribution of collisions
The largest number of fatal collisions occurred in July and September, with larger numbers of fatal collisions reported in June, April, May and January. Conversely, the fewest number of fatal collisions were reported in the last quarter of each year from October to December. This distribution is very similar to national statistics with more fatal collisions occurring in Spring, Summer and early Fall and fewer collisions occurring in late Fall and winter months. It has been suggested that drivers are inclined to take more risks in good weather conditions with clear, dry roads whereas they drive more cautiously in poor weather and winter conditions when roads tend to be wet and/or slippery (Brown et al., 2021). The frequency of fatal collisions by the month of the year is shown in Table 3.
| Month of year | Fatal collisions 2017 | Fatal collisions 2018 | Fatal collisions 2019 | Fatal collisions 2020 | Fatal collisions total |
|---|---|---|---|---|---|
| January | 1 | 1 | 3 | 2 | 7 (8%) |
| February | 1 | 4 | 1 | 0 | 6 (7%) |
| March | 3 | 1 | 1 | 0 | 5 (6%) |
| April | 3 | 3 | 1 | 0 | 7 (8%) |
| May | 2 | 2 | 2 | 1 | 7 (8%) |
| June | 2 | 1 | 1 | 4 | 8 (10%) |
| July | 2 | 1 | 4 | 5 | 12 (14%) |
| August | 0 | 1 | 4 | 1 | 6 (7%) |
| September | 3 | 2 | 3 | 4 | 12 (14%) |
| October | 1 | 3 | 1 | 0 | 5 (6%) |
| November | 2 | 2 | 0 | 0 | 4 (5%) |
| December | 3 | 0 | 2 | 0 | 5 (6%) |
| Total | 23 | 21 | 23 | 17 | 84 (100%) |
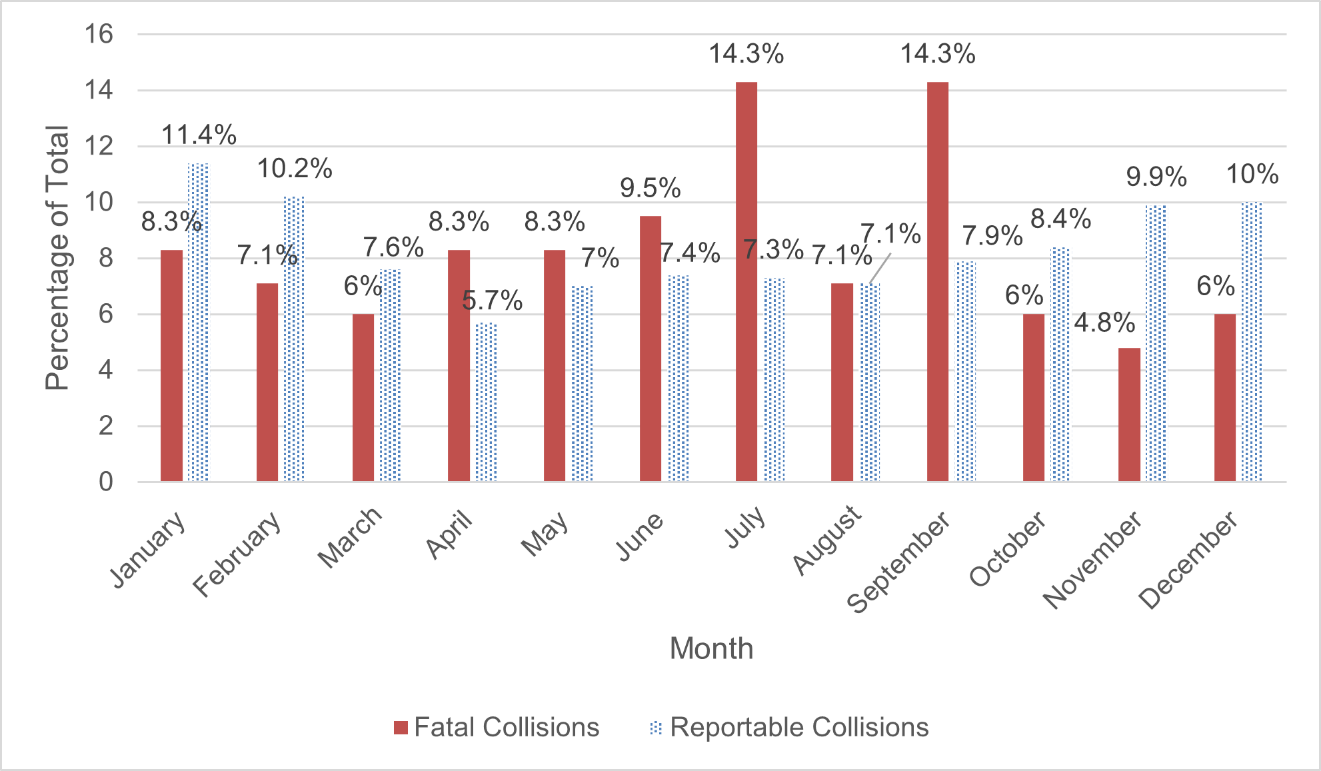
A comparison of the fatal to reportable collisions each month of the year revealed a larger share of fatal collisions (8% to 14%) reported each month from April through September compared to 6% to 8% of reportable collisions during the same months. However, the largest percentage of reportable collisions occurred during the colder months from November to February (10 to 11% monthly). This may be associated with poorer weather conditions and fewer daylight hours contributing to more minor collisions. Figure 5 presents the distribution of fatal and reportable collisions by month as a percentage of total collisions.
Figure 5: Distribution of fatal and reportable collisions by month, 2017–2020
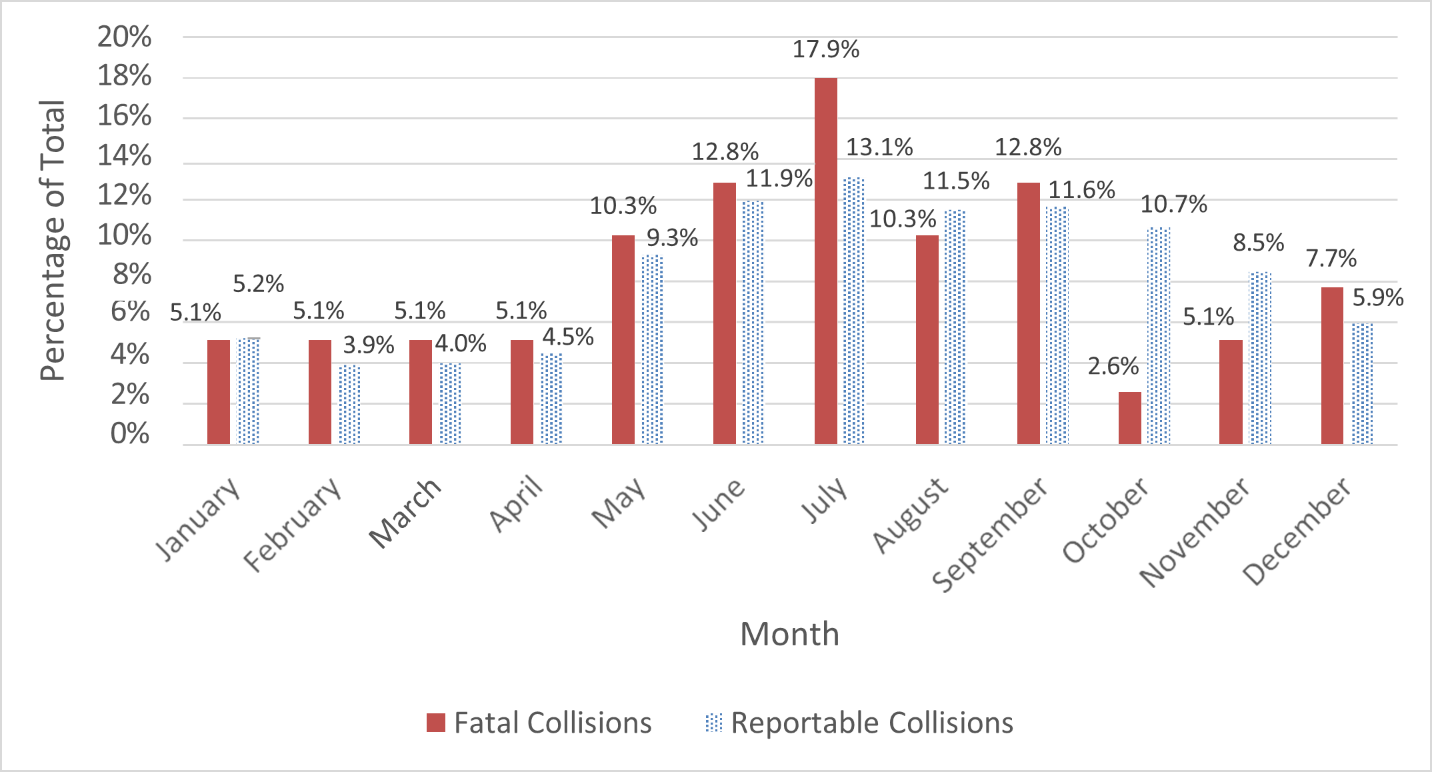
Motor vehicle occupant collisions make up the majority of the reportable collisions and follow similar distributions. However, vulnerable road user collisions are distributed somewhat differently throughout the year due to the seasonal nature of some modes such as cycling and motorcycle riding. Figure 6 shows the distribution of fatal and reportable collisions involving vulnerable road users by month. An examination of vulnerable road user collisions reveals both fatal and reportable collisions involving these road users are higher in the May-October months than at other times during the year. This coincides with the warmer months when active transportation and motorcycle activity are highest.
Figure 6: Distribution of vulnerable road user fatal and reportable collisions by month, 2017–2020
Day of week
Generally speaking, more fatal collisions occur on weekdays than weekends, however, the prevalence by day of week also varies depending on contributing factors. For example, distraction and speed-related fatal collisions more typically occur on weekdays whereas impaired driving fatal collisions are more prevalent on weekend nights and early morning hours (Brown et al., 2021; TIRF National Fatality Database 2022). The fatal collisions reviewed by FCRC are presented according to the day of week in Table 4.
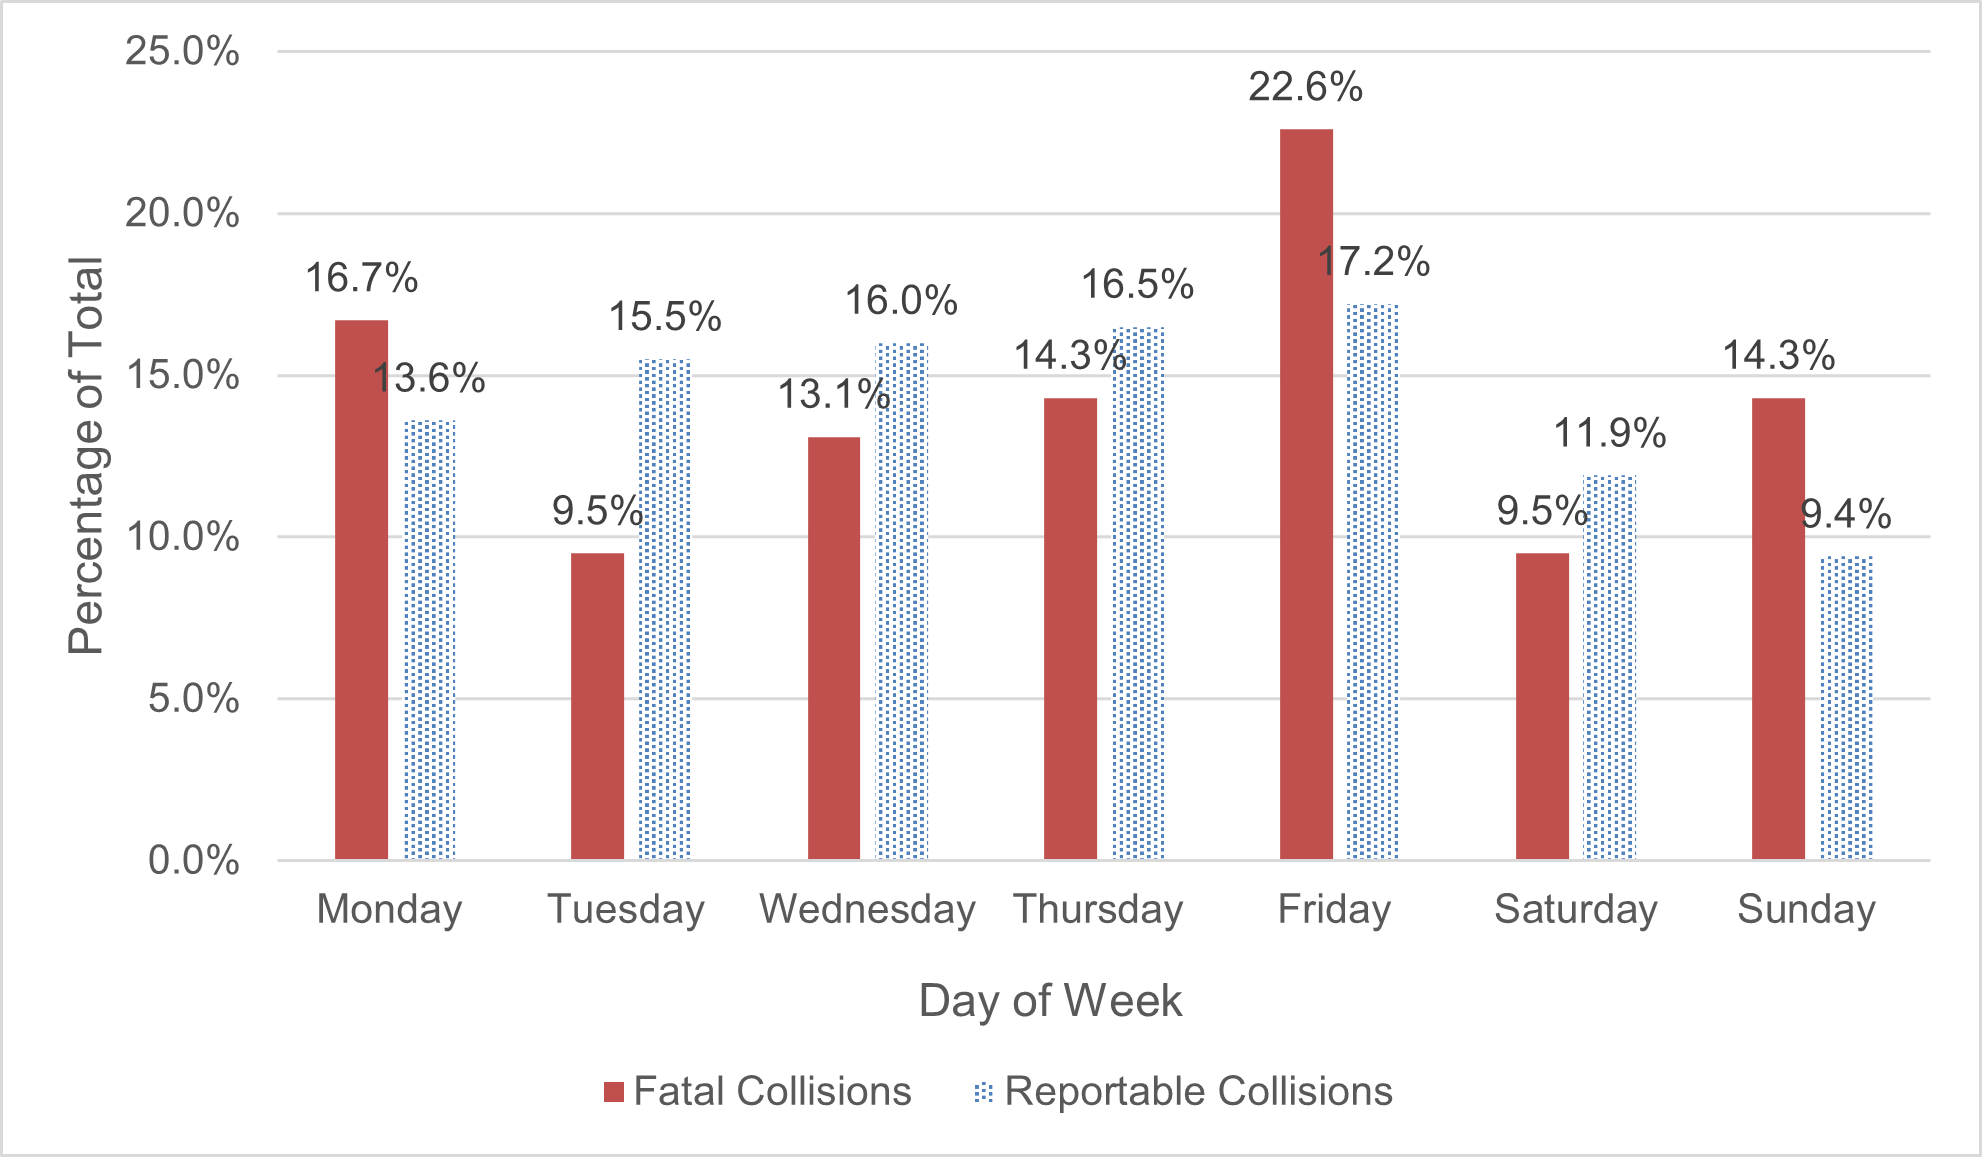
An examination of the percentage of fatal collisions compared to reportable collisions by day of week showed the largest number of fatal collisions occurred on Friday and Monday. Conversely, the largest percentage of reportable collisions were reported on Wednesday, Thursday and Friday. The comparison of the distribution of fatal collisions versus the distribution of reportable collisions is shown in Figure 7.
| Day of week | Fatal collisions 2017 | Fatal collisions 2018 | Fatal collisions 2019 | Fatal collisions 2020 | Fatal collisions total |
|---|---|---|---|---|---|
| Monday | 2 | 4 | 5 | 3 | 14 (17%) |
| Tuesday | 1 | 3 | 2 | 2 | 8 (10%) |
| Wednesday | 4 | 1 | 2 | 4 | 11 (13%) |
| Thursday | 5 | 2 | 5 | 0 | 12 (14%) |
| Friday | 5 | 7 | 5 | 2 | 19 (23%) |
| Saturday | 3 | 1 | 3 | 1 | 8 (10%) |
| Sunday | 3 | 3 | 1 | 5 | 12 (14%) |
| Total | 23 | 21 | 23 | 17 | 84 (100%) |
Figure 7: Distribution of fatal and reportable collisions by day of week, 2017–2020
Time of day
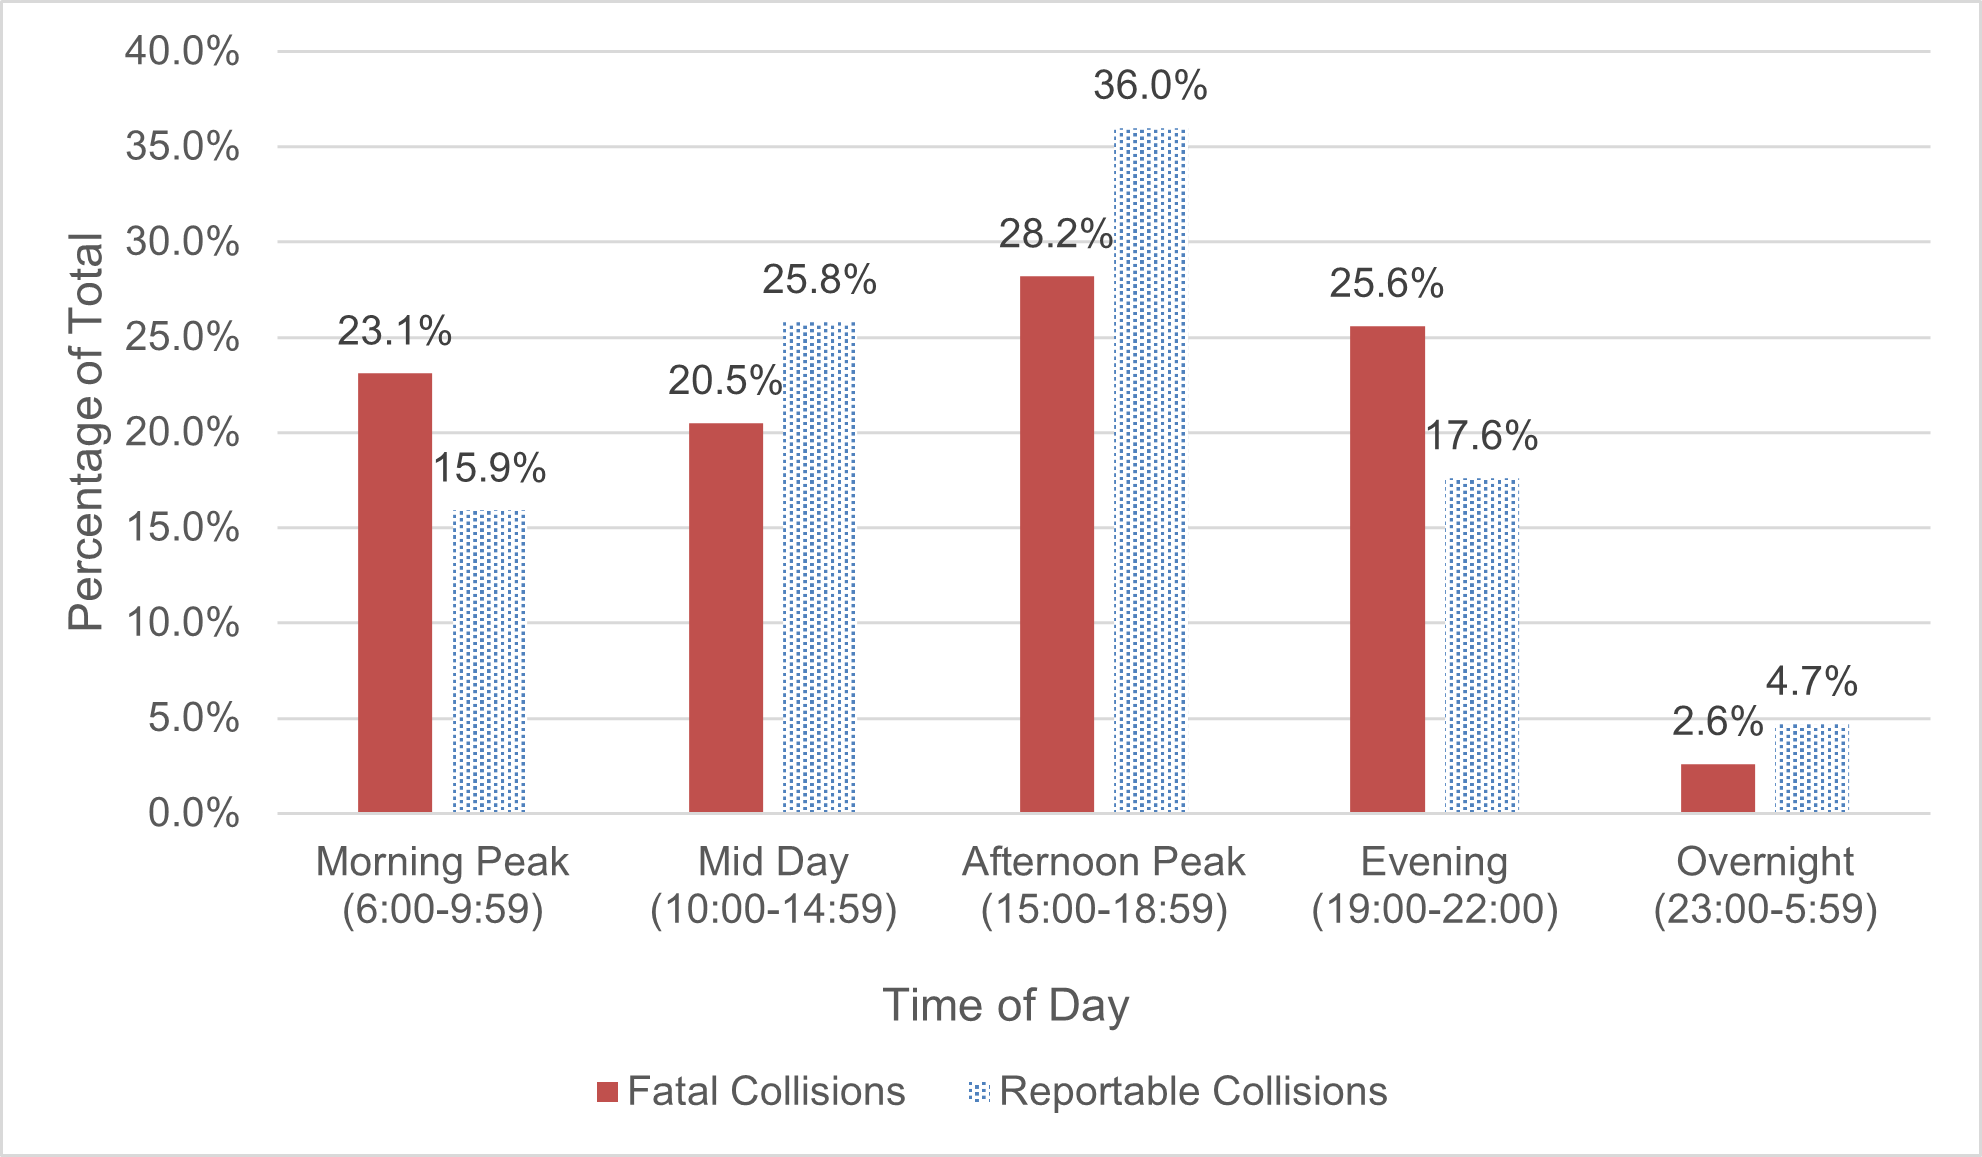
The number of fatal collisions was too small to report individual hours, as such, hours were grouped into time periods representing peak morning, mid-day and afternoon timeframes as well as evening and overnight periods. The largest number of fatal collisions were recorded during the afternoon peak period which coincides with rush hour periods and higher traffic volumes. This is also the time of day when people are naturally fatigued based on the circadian rhythm of the human body. Table 5 shows the annual number of fatal collisions that occurred during each of these periods.
| Time of day | Fatal collisions 2017 | Fatal collisions 2018 | Fatal collisions 2019 | Fatal collisions 2020 | Fatal collisions total |
|---|---|---|---|---|---|
| Morning peak (06:00-09:59) | 3 | 4 | 6 | 2 | 15 (18%) |
| Midday (10:00-14:59) | 6 | 5 | 2 | 5 | 18 (21%) |
| Afternoon peak (15:00-18:59) | 3 | 7 | 11 | 4 | 25 (30%) |
| Evening (19:00-22:59) | 8 | 2 | 3 | 3 | 16 (19%) |
| Overnight (23:00-05:59) | 3 | 3 | 1 | 3 | 10 (12%) |
| Total | 23 | 21 | 23 | 17 | 84 (100%) |
Overall, the distribution of fatal collisions is similar the distribution of reportable collisions. The only exceptions were more reportable collisions occurring during the midday peak and more fatal collisions occurring in evening and overnight periods. The distributions are compared in Figure 8.
An examination of the distribution of fatal and reportable collisions involving vulnerable road users by time of day presented a somewhat different result. In particular, although a larger percentage of fatal collisions occurred in the evening period, the second largest percentage coincided with the morning peak. 15% of reportable pedestrian collisions and 27% of the 22 fatal pedestrian collisions occurred during this timeframe. This may be due to a larger number of active transportation users on the road to commute or to avoid daytime heat, and at times the lighting conditions may also be poorer, notably in early Spring and late Fall seasons. Figure 9 shows the distribution of fatal and reportable collisions involving vulnerable road users by time of day.
Figure 8: Distribution of fatal and reportable collisions by time of day, 2017–2020
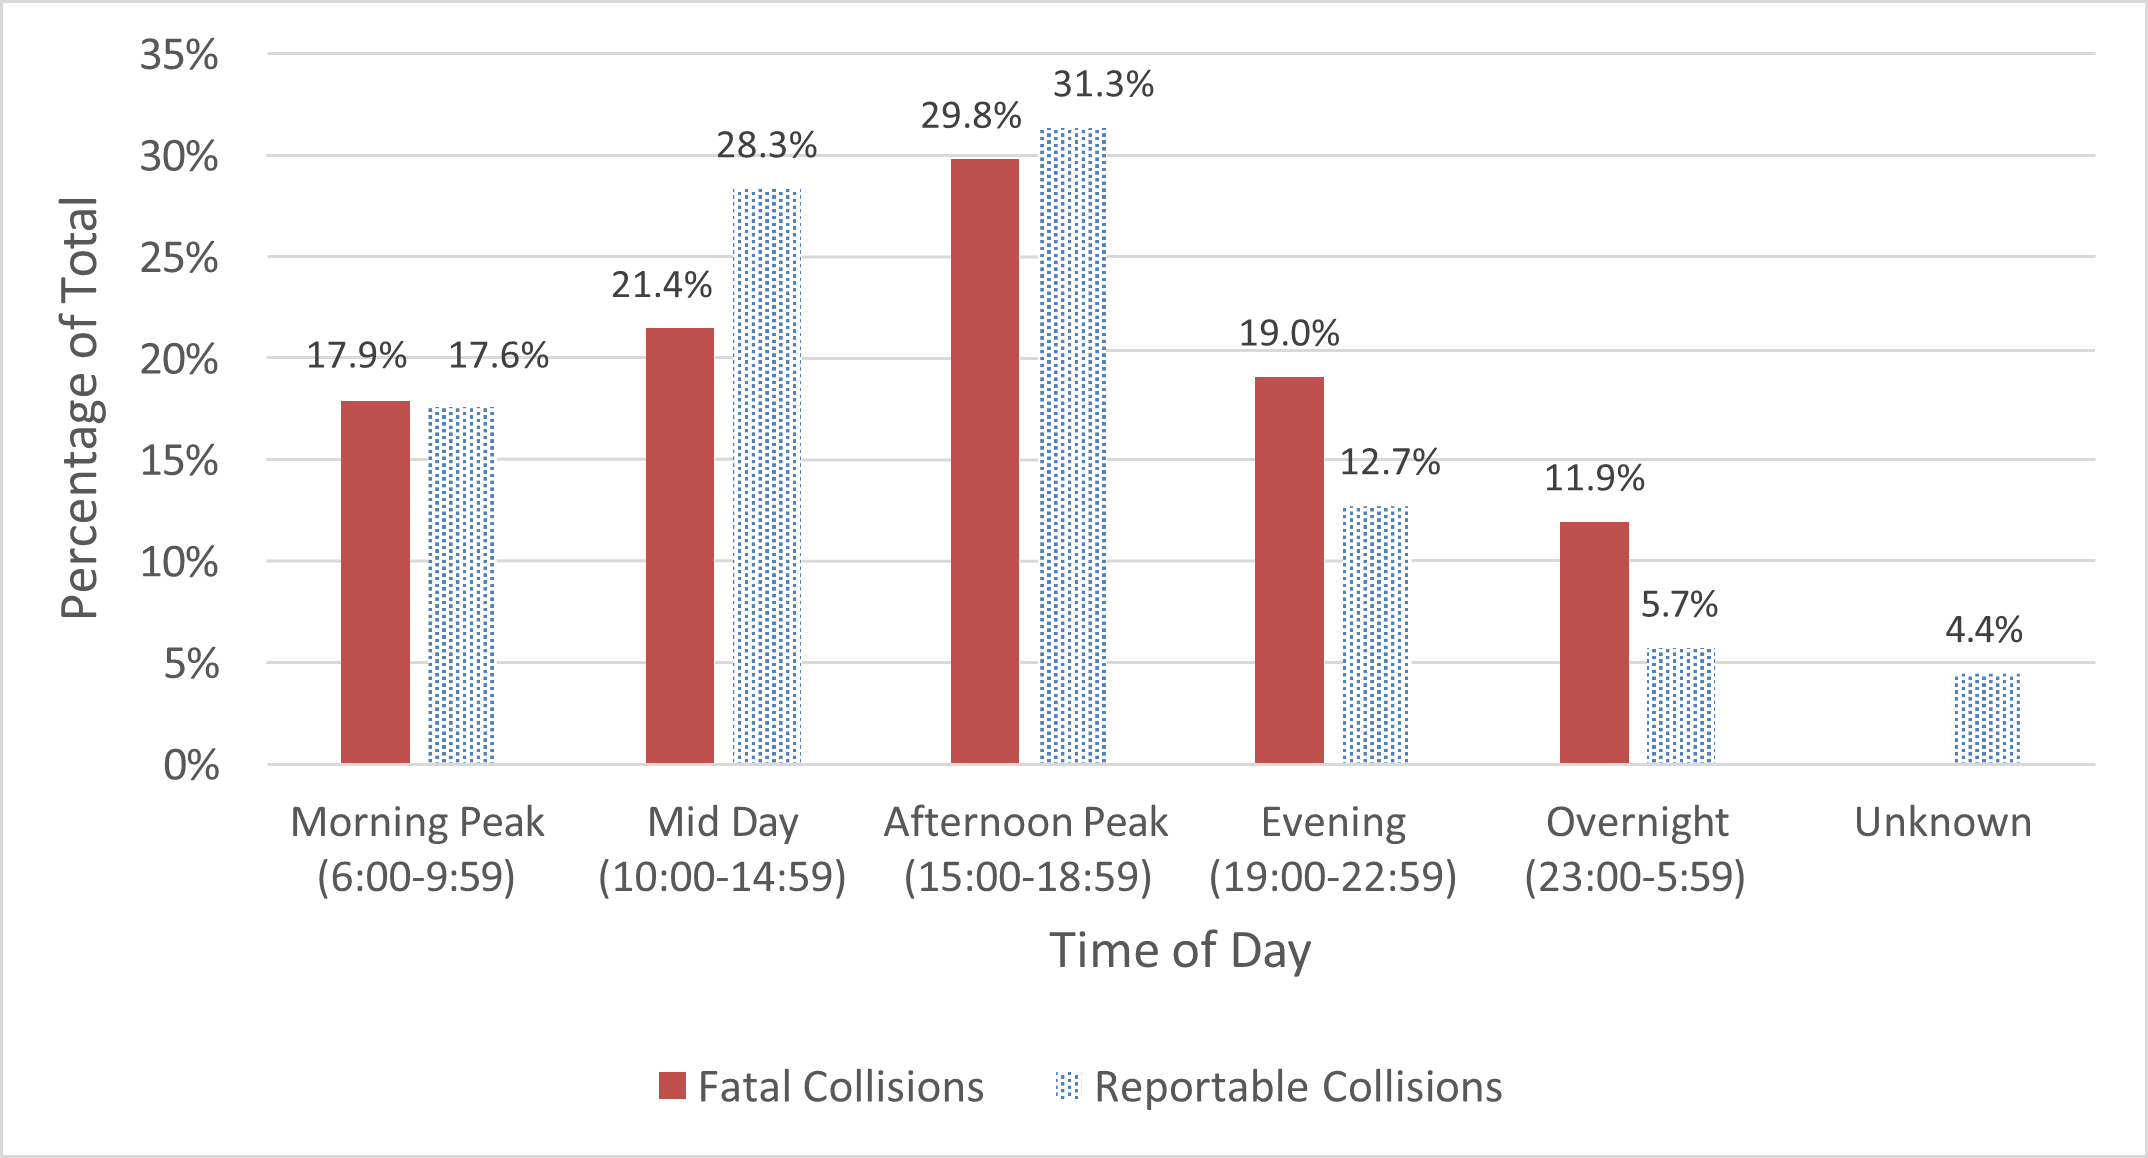
Figure 9: Distribution of vulnerable road users in fatal and reportable collisions by time of day
In addition, although vulnerable road user collisions are higher than expected during the evening period, fatal pedestrian collisions are under-represented with 9% compared to 19% of reportable pedestrian collisions during that time period. Fatal pedestrian collisions are over- represented during the overnight period, and national data suggest pedestrians in fatal collisions are often less visible with darker clothing, and impairment by alcohol or drugs is more often a factor (Vanlaar et al., 2016; CCMTA, 2013).
The small numbers of motorcyclist, cyclist and e-bike rider collisions are difficult to distribute across the five time periods and draw meaningful observations. However, it is noted that 43% of the seven fatal collisions involving cyclists and e-bike riders occurred during the afternoon peak with none occurring during the overnight period. Among the 11 fatal motorcyclist collisions, one or two occurred during each of the time periods with the exception of the evening period in which almost half (45%) of the collisions occurred.