Educational attainment
This factsheet looks at data on education released by Statistics Canada as part of the 2016 Census.
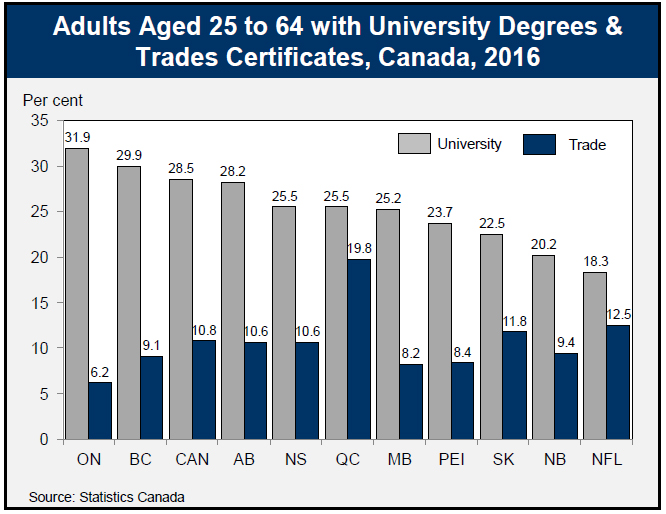
Ontario: Highest proportion of university-educated adults in Canada
In 2016, almost a third (31.9%) of Ontarians aged 25 to 64 had a university degree, the highest proportion among provinces and territories.
In contrast, only 6.2% of Ontarians aged 25-64 had a trades certificate as their highest level of educational attainment, which was the lowest in Canada.
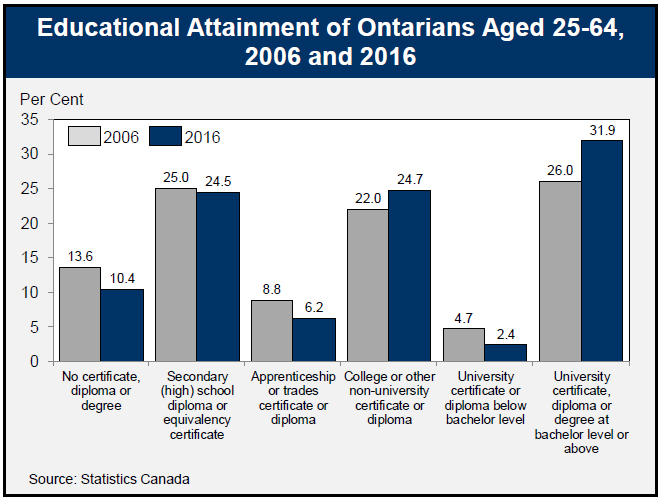
24.7% of people in the 25-64 age group had a college diploma, 24.5% had a high school diploma as their highest level of attainment, while 10.4% had not completed high school.
In 2016, nearly two-thirds of Ontarians aged 25 to 64 had completed some form of postsecondary education, and almost one-quarter of university graduates had a master’s degree or doctorate as their highest degree.
Most popular fields of study differ for men and women
The most common (24.4%) major field of study in 2016 among women aged 25 to 64 with postsecondary qualifications was business, management and public administration. In contrast, the most common field of study for men (35.4%) was architecture, engineering and related technologies.
Fewer young adults studying in trades
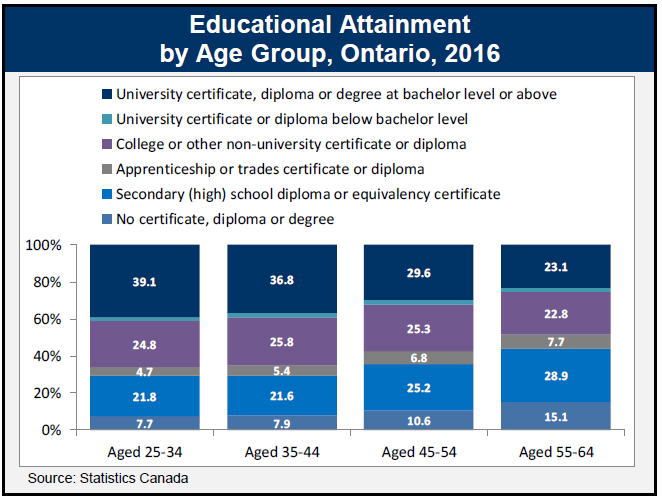
In 2016, only 7.7% of young adults aged 25 to 34 had not completed high school, compared to 15.1% of Ontarians aged 55 to 64.
Fewer young adults are studying in trades compared to their parents. About 4.7% of adults aged 25 to 34 had a trades certification in 2016, compared with 7.7% of 55 to 64 year old adults.
Proportions of college graduates were mostly similar between different age cohorts, with the exception of older adults who had a slightly smaller share.
In 2016, 39.1% of younger adults were university educated, compared to 23.1% of older adults.
Finally, 11.9% of Ontarians aged 25 to 34 had post-graduate credentials (above bachelor level), compared to 8.5% of adults aged 55 to 64.
Educational attainment in Ontario’s CMAs
In 2016, adults living in the province’s 16 census metropolitan areas (CMAs) accounted for 92% of all Ontarians with a university degree.
By contrast, only 76% of Ontarians who had not finished high school lived in one of the CMAs.
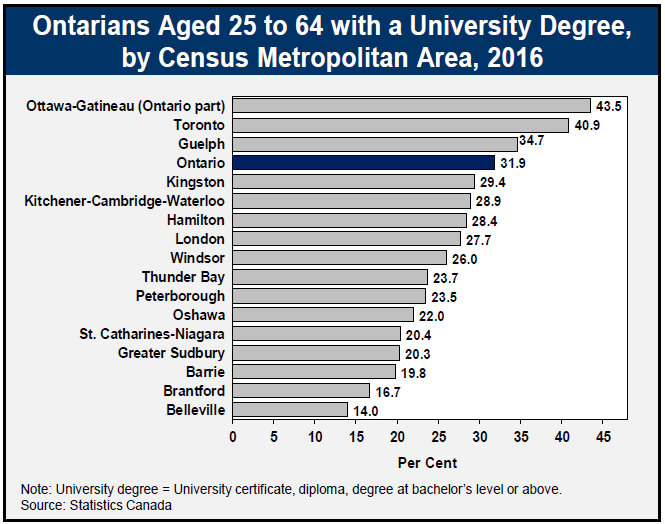
Proportion of adults with a university degree
In Ottawa-Gatineau (Ontario part), 43.5% of the population aged 25 to 64 had a university degree, the highest proportion among Ontario CMAs.
Toronto had the second highest proportion with 40.9%, followed by Guelph at 34.7%.
The CMAs with the lowest proportions of university degree holders were Belleville at 14.0%, Brantford at 16.7%, and Barrie at 19.8%.
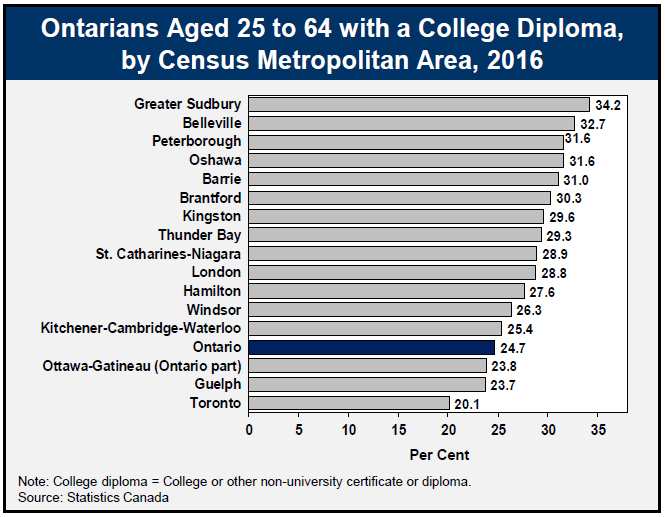
Proportion of adults with a college diploma
The Greater Sudbury CMA had the highest proportion of its adult (25-64) population with a college diploma at 34.2% in 2016, followed by Belleville at 32.7% and Peterborough at 31.6%.
Toronto had by far the lowest proportion among CMAs at 20.1%, followed by Guelph at 23.7%, and Ottawa-Gatineau (Ontario part) at 23.8%.
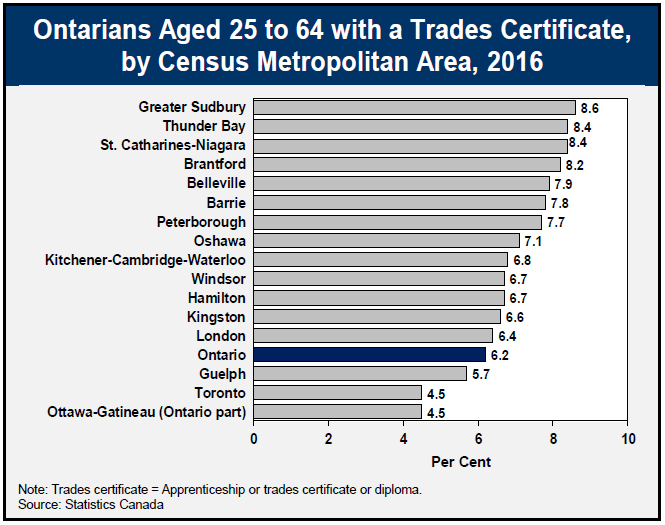
Proportion of adults with a trades certificate
8.6% of the adult population (25 to 64) of the Greater Sudbury CMA had a trades certificate in 2016, the largest proportion of all the CMAs in Ontario, followed by Thunder Bay and St. Catharines-Niagara, both at 8.4%.
Ottawa-Gatineau (Ontario part) and Toronto had by far the lowest share of population with trade certificates at 4.5% in 2016, followed by Guelph at 5.7%.
Proportion of adults without a high school diploma
Brantford and Belleville had by far the highest proportion of adults aged 25 to 64 without high school diploma in 2016, at 13.1% and 12.9% respectively, followed by Thunder Bay at 11.7%.
The Ontario CMAs with the lowest share of adults without high school diploma were Ottawa-Gatineau (Ontario part) at 6.4%, Kingston at 7.7%, and Guelph at 9.1%.
Accessible image descriptions
Adults aged 25 to 64 with university degrees & trades certificates, Canada, 2016
This bar chart shows the proportion of adults aged 25 to 64 with university degrees and trades certificates in Canada in 2016. Ontario had the highest share with university degrees at 31.9% and the lowest share with trades certificates at 6.2%. The Canadian average was 28.5% with university degrees and 10.8% with trades certificates. The lowest share of university degrees was in Newfoundland and Labrador at 18.3%. The highest share with trades certificates was in Quebec at 19.8%.
Educational attainment of Ontarians aged 25-64, 2006 and 2016
This bar chart shows educational attainment of Ontarians aged 25-64 in 2006 and 2016. Between 2006 and 2016, the share of those with no certificate, diploma or degree fell from 13.6% to 10.4%, the share of those with secondary school diploma or equivalency certificate fell from 25.0% to 24.5%, the share of those with an apprenticeship or trades certificate or diploma fell from 8.8% to 6.2%, the share of those with college or other non-university certificate or diploma rose from 22.0% to 24.7%, the share of those with a university certificate or diploma below bachelor level fell from 4.7% to 2.4%, and the share of those with a university certificate, diploma or degree at bachelor level or higher rose from 26.0% to 31.9%.
Educational attainment by age group, Ontario, 2016
This bar chart shows educational attainment by age group in Ontario in 2016. 7.7% of those aged 24-34 and 15.1% of those aged 55-64 had no certificate, diploma or, 21.8% of those aged 25-34 and 28.9% of those aged 55-64 had a secondary school diploma or equivalency certificate, 4.7% of those aged 25-34 and 7.7% of those aged 55-64 had an apprenticeship or trades certificate or diploma, 24.8% of those aged 25-34 and 22.8% of those aged 55-64 had a college or other non-university certificate, and 39.1% of those aged 25-34 and 23.1% of those aged 55-64 had a university certificate, diploma or degree at bachelor level or higher.
Ontarians aged 25 to 64 with a university degree, by census metropolitan area, 2016
This chart shows Ontarians aged 25-64 with a university degree by census metropolitan area in 2016. In Ottawa-Gatineau (Ontario part), 43.5% of the population aged 25 to 64 had a university degree, the highest proportion among Ontario CMAs. Toronto had the second highest proportion with 40.9%, followed by Guelph at 34.7%. The CMAs with the lowest proportions of university degree holders were Belleville at 14.0%, Brantford at 16.7% and Barrie at 19.8%.
Ontarians aged 25 to 64 with a college diploma, by census metropolitan area, 2016
This chart shows Ontarians aged 25-64 with a college diploma by census metropolitan area in 2016. The Greater Sudbury CMA had the highest proportion of its adult (25-64) population with a college diploma at 34.2% in 2016, followed by Belleville at 32.7% and Peterborough at 31.6%. Toronto had by far the lowest proportion among CMAs at 20.1%, followed by Guelph at 23.7%, and Ottawa-Gatineau (Ontario part) at 23.8%.
Ontarians aged 25 to 64 with a trades certificate, by census metropolitan area, 2016
This chart shows Ontarians aged 25-64 with a trades certificate by census metropolitan area in 2016. 8.6% of the adult population (25 to 64) of the Greater Sudbury CMA had a trades certificate in 2016, the largest proportion of all the CMAs in Ontario, followed by Thunder Bay and St. Catharines-Niagara, both at 8.4%. Ottawa-Gatineau (Ontario part) and Toronto had by far the lowest share of population with trade certificates at 4.5% in 2016, followed by Guelph at 5.7%.