Ethnic origin and visible minorities
This factsheet looks at data on ethnic origin and visible minorities released by Statistics Canada as part of the 2016 Census. In the Census, visible minorities are defined as persons who are non-Caucasian in race or non-white in colour and who do not report being Aboriginal.
Ontario’s population is highly diverse
Ethnic origin refers to the ethnic or cultural origins of the respondent’s ancestors. About 250 ethnic origins were reported by Ontarians in the 2016 Census.
The ethnic origin most often reported in Ontario was Canadian, either alone or in combination with others.
Canadian (3,109,770) was followed by English (2,808,810), Scottish (2,107,290), Irish (2,095,465), French (1,349,255), German (1,189,670), Italian (931,805), Chinese (849,340), East Indian (774,495) and Dutch (527,750).
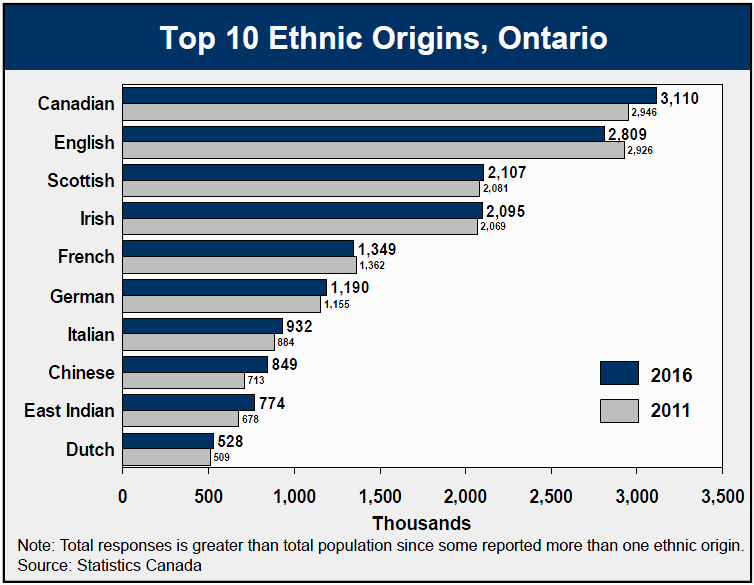
Among the top 10 ethnic origins, only English and French saw numerical declines between 2011 and 2016.
Almost three in ten Ontarians identify as visible minorities
In 2016, 3,885,585 Ontarians identified as members of the visible minority population.
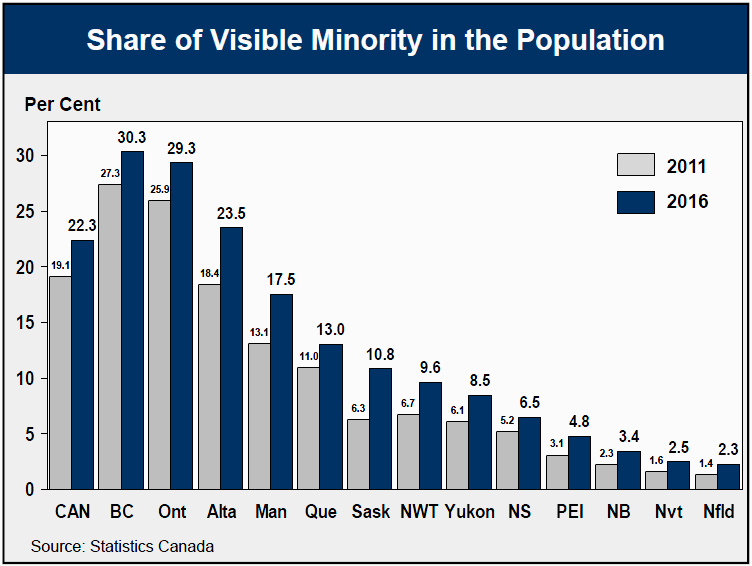
These individuals comprised 29.3% of Ontario’s total population and represented more than half of Canada’s total visible minorities (7.7 million).
The bulk of the visible minority population live in Census Metropolitan Areas, including 3.0 million in Toronto.
Between 2011 and 2016, Ontario’s visible minority population increased by 18.5%, while the population not belonging to a visible minority group declined by 0.2%. Ontario’s 374,395 people who self-identified as Aboriginal are not counted as part of the visible minority population.
Of the 3.9 million Ontarians who identified as visible minority, more than one-third (36.5%) were born in Canada, while 63.5% were born outside Canada.
South asian was the largest visible minority
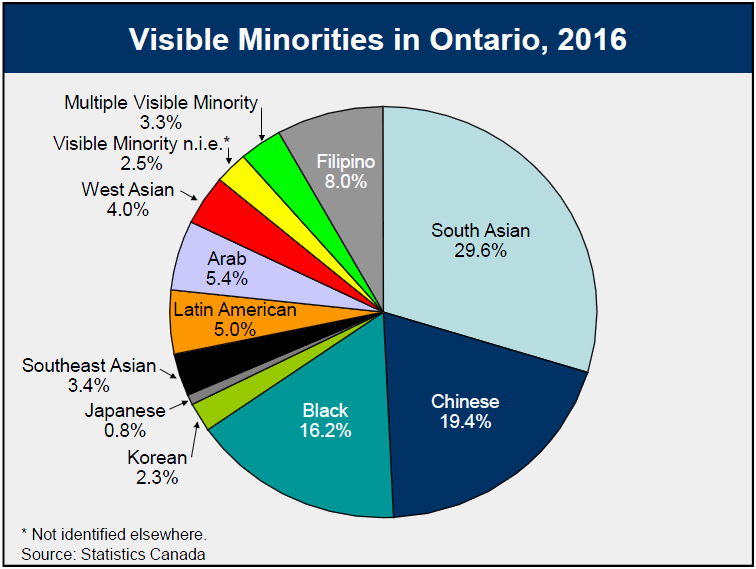
Combined, the four largest visible minority groups in 2016 –South Asian, Chinese, Black and Filipino– accounted for almost three-quarters (73.2%) of visible minorities.
South Asian was the single largest visible minority group, accounting for 29.6% of visible minorities and 8.7% of Ontario’s total population. Chinese was second (19.4%), followed by Black (16.2%), Filipino (8.0%), Arab (5.4%) Latin American (5.0%) and West Asian (4.0%).
Between 2011 and 2016, the fastest-growing groups were Arab (+39%), Multiple Visible Minority (+33%), and West Asian (+26%). The groups to add the most people were South Asian (+184,420) and Chinese (+125,410).
Visible minorities in Ontario’s CMAs
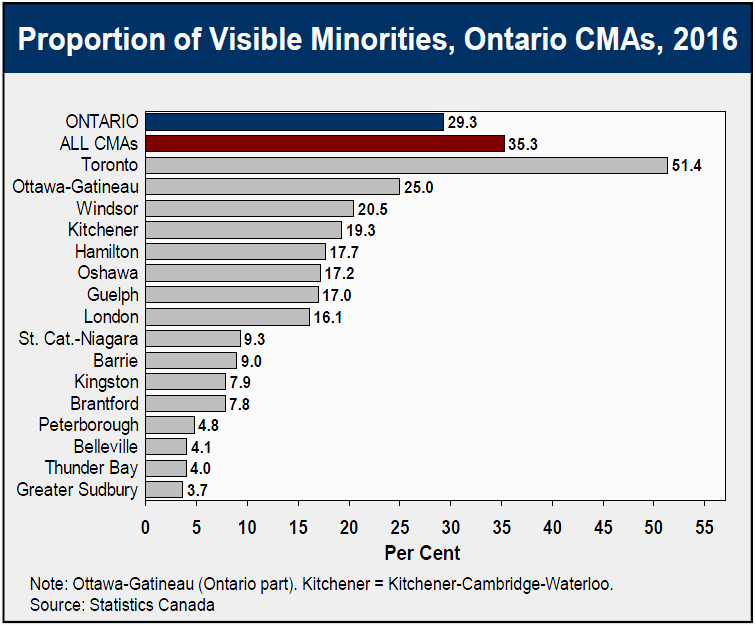
In 2016, nearly all (98.3%) of Ontario’s visible minorities lived in Census Metropolitan Areas (CMAs). They comprised 35.3% of the province’s total CMA population.
The Toronto CMA was home to 3,011,905 people identifying as visible minorities or 51.4% of its population, the first census above the 50% mark. This represented 77.5% of Ontario’s total visible minority population.
Ottawa-Gatineau (Ontario part) had the second highest proportion (25.0%) of visible minorities among all the 16 CMAs of the province.
Windsor ranked third (20.5%), followed by Kitchener-Cambridge-Waterloo (19.3%) and Hamilton (17.7%).
Greater Sudbury (3.7%), Thunder Bay (4.0%) and Belleville (4.1%) were the Ontario CMAs with the lowest proportions of visible minority population.
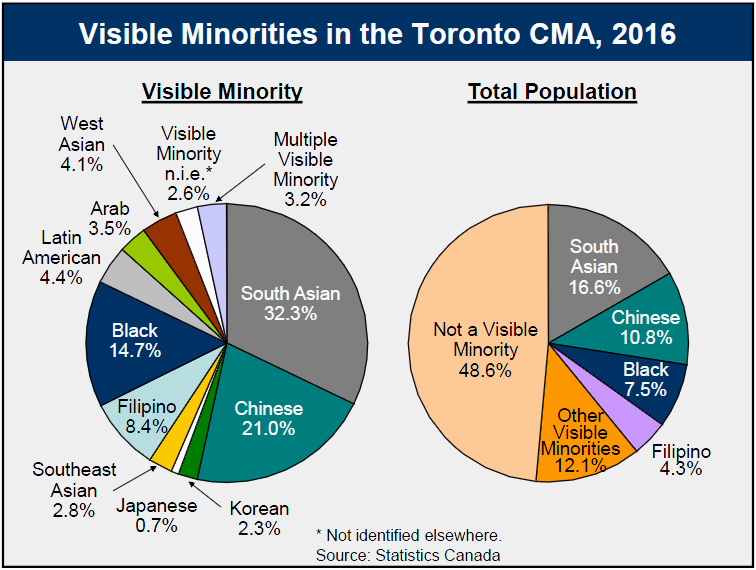
South Asians: Toronto CMA’s largest visible minority
South Asians represented 32.3% of all visible minorities in the Toronto CMA. They accounted for 84.6% of all South Asians in Ontario.
The Chinese made up 21.0% of Toronto’s visible minorities and 10.8% of its total population; Black people made up 14.7% of the CMA’s visible minorities and 7.5% of its population; while Filipinos made up 8.4% of the CMA’s visible minorities and 4.3% of it’s total population.
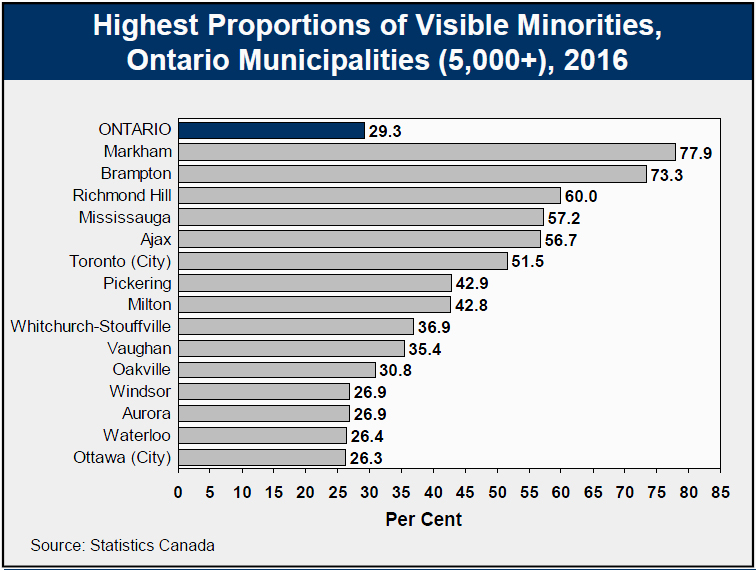
Markham and Brampton have the highest proportions of visible minorities among Ontario municipalities
Town of Markham had the highest proportion of visible minorities in Canada. Visible minorities accounted for over three quarters (77.9%) of its population, up from 72.3% in 2011. About 45.1% of Markham’s population was of Chinese origin and 17.8% South Asian.
In Brampton, visible minorities represented 73.3% of the population, the second highest in Ontario. South Asians comprised 44.3% of Brampton’s population.
In Richmond Hill, visible minorities represented 60.0% of the population, the third highest in Ontario. People of Chinese origin comprised 29.4% of Richmond Hill’s population.
In Mississauga, visible minorities represented 57.2% of the population, the fourth highest in Ontario. South Asians comprised 23.2% of Mississauga’s population.
In Ajax, visible minorities represented 56.7% of the population, the fifth highest in Ontario. South Asians, the largest visible minority, comprised 20.9% of Ajax’s population.
Accessible image descriptions
Top 10 ethnic origins, Ontario
This bar chart shows the top 10 ethnic origins in Ontario. The top origin was Canadian with over 3 million people, followed by English, Scottish and Irish (all 3 above 2 million), French at 1,349,000, followed by German, Italian, Chinese, East Indian, and Dutch.
Share of visible minority in the population
This bar chart shows the share of visible minority population by province. For Canada the share was 22.3%. The highest shares among provinces were in B.C. (30.3%), Ontario (29.3%) and Alberta (23.5%). The share in Quebec was 13.0%. The lowest was in New Brunswick at 3.4%.
Visible minorities in Ontario, 2016
This pie chart shows the distribution of visible minorities in Ontario in 2016: South Asian at 29.6%, Chinese at 19.4%, Black at 16.2%, Filipino at 8.0%, Arab at 5.4%, Latin American at 5.0%, West Asian at 4.0%, Southeast Asian at 3.4%, Korean at 2.3%, Japanese at 0.8%, multiple visible minority at 3.3% and visible minority not identified elsewhere at 2.5%.
Proportion of visible minorities, Ontario CMAs, 2016
This bar chart shows the proportion of visible minorities in Ontario CMAs in 2016. The total for Ontario as a whole was 29.3%, and for all CMAs 35.3%. Toronto at 51.4%, Ottawa-Gatineau at 25.0% and Windsor at 20.5% were highest. Thunder Bay at 4.0% and Greater Sudbury at 3.7% were lowest.
Visible minorities in the Toronto CMA, 2016
This pie chart shows visible minorities in the Toronto CMA in 2016. 48.6% were not a visible minority, 16.6% were South Asian, 10.8% were Chinese, 7.5% were Black, 4.3% were Filipino and 12.1% were other visible minorities.
Highest proportions of visible minorities, Ontario municipalities (5,000+), 2016
This bar chart shows the highest proportions of visible minorities among Ontario municipalities in 2016. The highest were in Markham (77.9%), Brampton (73.3%), Richmond Hill (60.0%), Mississauga (57.2%), Ajax (56.7%) and Toronto (51.5%).