Income
This fact sheet looks at income information released by Statistics Canada as part of the 2016 Census. Note that all dollar figures are expressed in 2015 constant dollars. Unless otherwise indicated, income is from all sources before taxes.
Household income growing slowly
The median household income was $74,287 in Ontario in 2015, up 3.8% from $71,534 in 2005. At the national level, median household income grew 10.8% over the period, from $63,457 to $70,336.
Only Alberta ($93,835) and Saskatchewan ($75,412) had higher median household incomes among provinces in 2015. The lowest were in New Brunswick ($59,347) and Quebec ($59,822).
Over the 2005 to 2015 period, Ontario was the province with the slowest-growing median household income, followed by Quebec (+8.9%). The fastest growth was observed in Saskatchewan (+36.5%) and Newfoundland and Labrador (+28.9%).

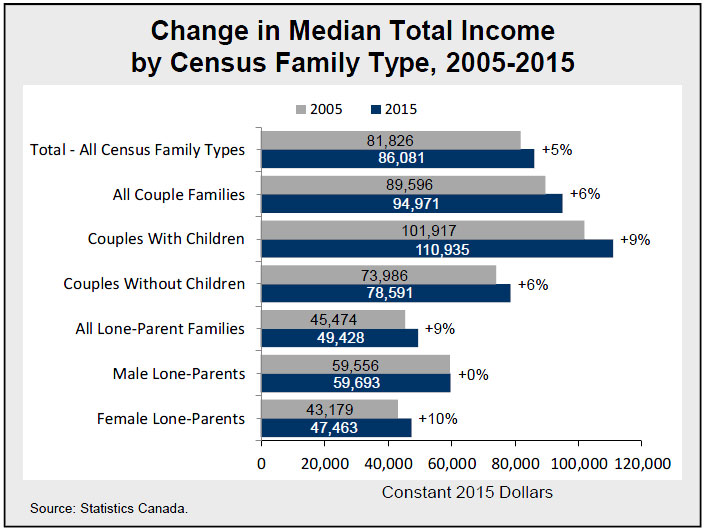
All census family types saw growth in income
Ontario Census families had a median income of $86,081 in 2015, up 5.2% from $81,826 in 2005.
The fastest growth in median income was observed for female lone-parents families (+9.9%) and couples with children (+8.8%). By contrast, male lone-parent families experienced minimal growth in median income (+0.2%) over the 2005-2015 period.
Couples without children saw growth in median income (+6.2%) close to the average for all Census families.
Taxes reduce income differences between family types
The median after-tax income of Ontario Census families was $75,369 in 2015, $10,712 lower than before taxes.
Couples with children had an after-tax median income of $95,235, compared to $69,018 for couples without children.
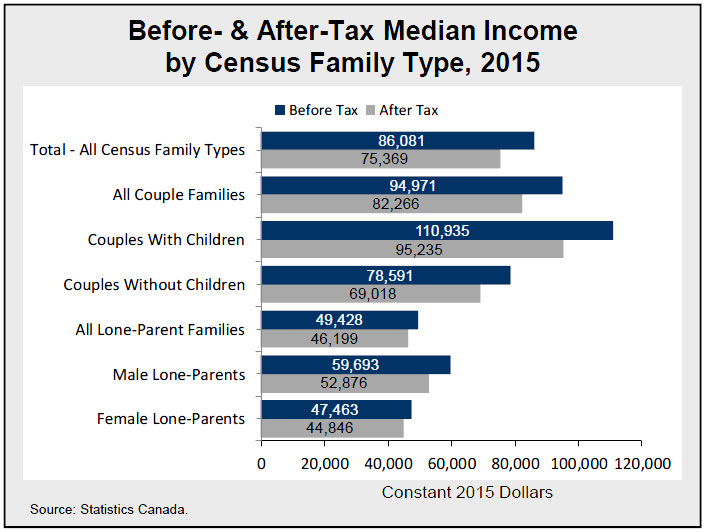
The median before-tax income of couples with children was 124% higher than that of lone-parent families. However, the gap was reduced to 106% after taxes.
Similarly, while male lone-parent families’ median before-tax income was 26% higher than that of female lone-parent families, the gap was reduced to 18% after taxes.
Income of young adults aged 25-34 fell
Among individual income recipients aged 15+ in Ontario, median income rose 3.8% between 2005 and 2015, from $32,305 to $33,539.
There were significant differences in income growth between age groups.
While those aged 15 to 24 had by far the lowest median income in 2015 ($10,574), they experienced the fastest growth since 2005 (+15%). This was in stark contrast with young adults aged 25 to 34, who saw their median income shrink (-2.2%) over the same period.
Seniors 65+ had the second-fastest-growing median income among age groups over the 10-year period (+8.4%), followed by individuals aged 35 to 44 (6.9%).
In 2015, the highest median income among age groups was recorded for individuals aged 45-54 at $47,654.

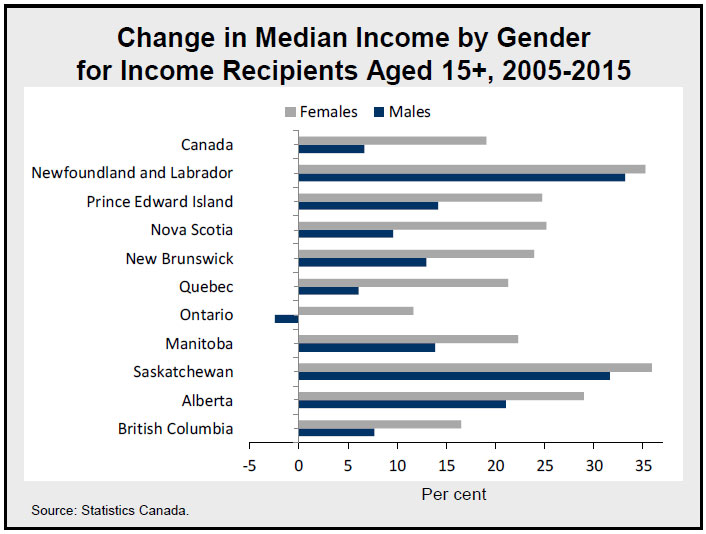
Ontario males saw a decline in median Income
Among individual income recipients aged 15+, females saw significantly faster income growth than males over the 2005 to 2015 period.
Nationally, individual females saw median income growth of 19.1% from 2005 to 2015, from $24,230 to $28,860. Ontario recorded the slowest growth among provinces (+11.7% to $28,676).
Ontario females had the fourth highest median income among provinces in 2015, down from second place in 2005 (behind Alberta). Saskatchewan females jumped from sixth to second place.
For individual males, median income rose 6.7% nationally over the period, from $38,207 to $40,782. Only in Ontario did males see a decline in median income (-2.4% to $39,889).
Ontario males had the sixth highest median income among provinces in 2015, down from second place in 2005 (behind Alberta). Males in Newfoundland and Labrador jumped from last to third place over the period.
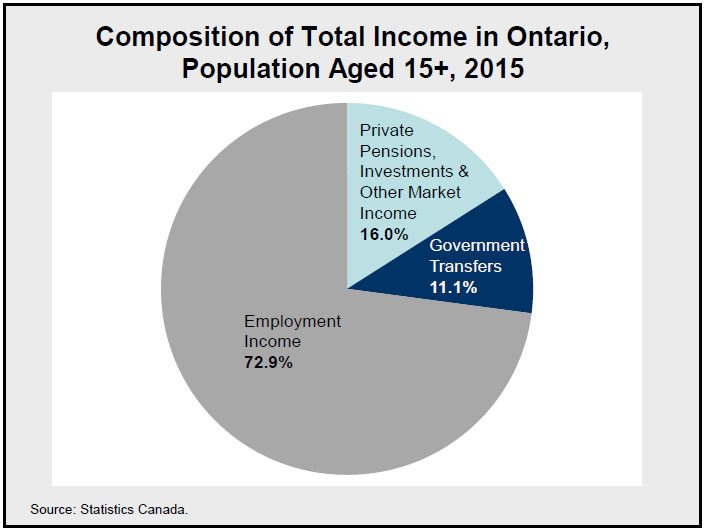
Three-quarters of income coming from employment
In 2015, 72.9% of the total income of Ontarians aged 15+ came from employment income.
Private pensions, investment income and other market income together accounted for 16.0% of total income.
Government transfers made up 11.1% of total income.
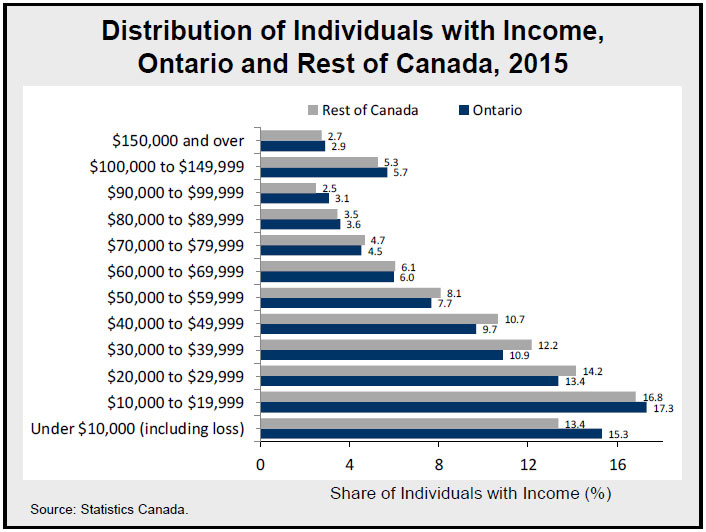
More individuals with high incomes in Ontario
In 2015, there was a higher proportion of individuals aged 15+ with both very low and very high incomes in Ontario than in the rest of Canada.
In Ontario, 15.3% of individuals aged 15+ (with income) had incomes under $10,000 (including loss), compared to 13.4% in the rest of Canada.
Conversely, 15.3% of Ontarians had income over $80,000, compared to 14.0% in the rest of Canada.
In both Ontario and the rest of Canada, the highest number of individuals by $10,000 bracket was in the group with incomes between $10,000 and $19,999.
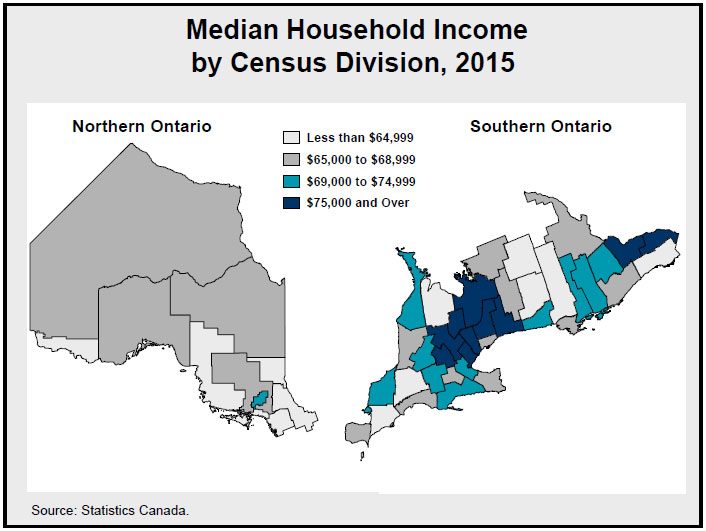
Highest incomes in suburban areas
In 2015, the highest median household incomes in Ontario were observed in the suburban GTA. Halton ($103,009), York ($95,776) and Durham ($89,834) came in on top. Other census divisions of Central Ontario and Ottawa also had high median household incomes.
The census divisions with the lowest median household income in 2015 were generally in rural and northern parts of the province, including Manitoulin ($50,227), Haliburton ($58,125) and Chatham-Kent ($58,185).
Within the North, Greater Sudbury had by far the highest median household income ($71,791), the 12th highest among Ontario census divisions.
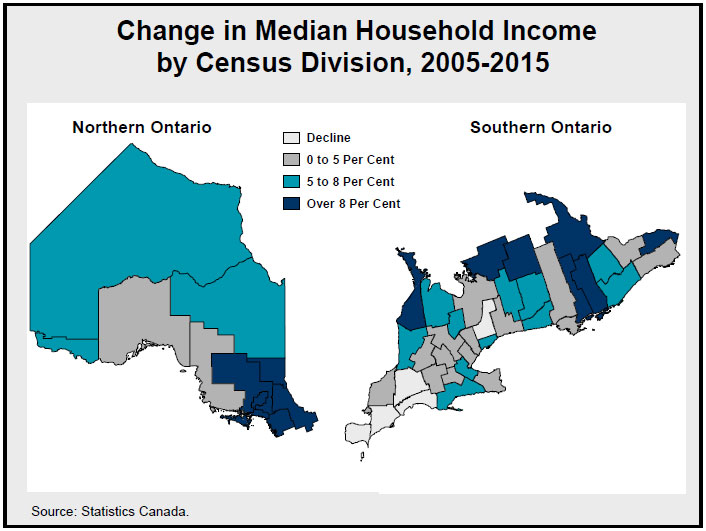
Income growth highest in the northeast
Over the 2005 to 2015 period, median household income growth was generally faster in the Northeast and Eastern Ontario, and slower in the Southwest and the suburban GTA.
Five census divisions of the Northeast were among the top 10 with fastest median household income growth in Ontario, with Timiskaming (+15.4%) and the district of Sudbury (+14.4%) in first and second place.
Five census divisions recorded a decline in median household income over the 2005-2015 period; four of which are in the Southwest: Essex (-5.7%), Chatham-Kent (-3.6%), Elgin (-2.8%) and Middlesex (-1.2%).
York also saw a decline in median household income over the period (-1.2%). Peel (+0.3%) and Durham (+0.7%), also located in the suburban GTA, saw some of the slowest increases in the province.
Median household income rose 5.3% in Toronto.
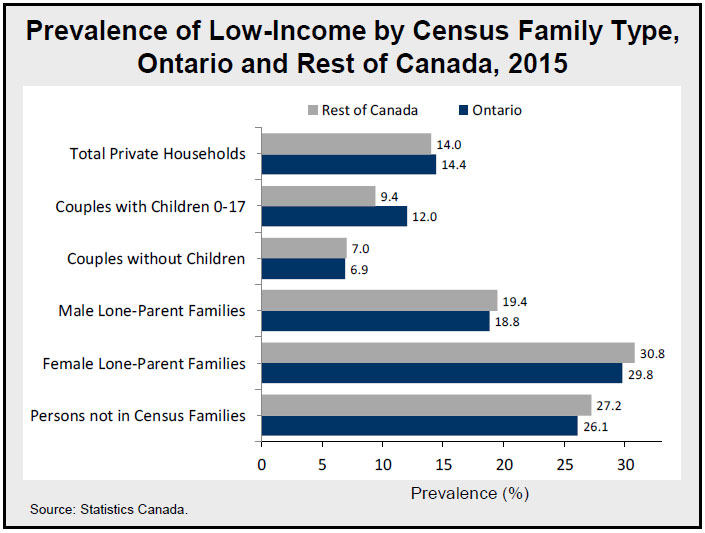
Prevalence of low-income increased in Ontario
Between 2005 and 2015, the prevalence of low-income (based on the after-tax Low-income measure) in Ontario increased from 12.9% to 14.4%. By contrast, in the rest of Canada, low-income prevalence decreased from 14.8% to 14.0%.
In 2015, Ontario had a significantly higher rate of low-income among couples with children aged 0-17 (12.0%) compared to the rest of Canada (9.4%). However, for most other Census family types, Ontario had lower low-income rates compared to the rest of the country.
In 2015, 18.8% of male lone-parent families and 29.8% of female lone-parent families were living in low-income in Ontario.
Couples without children had a low-income rate of 6.9%, while just over one-quarter (26.1%) of persons not in Census Families lived in low-income in 2015 in Ontario.
More Ontario children living in low-income
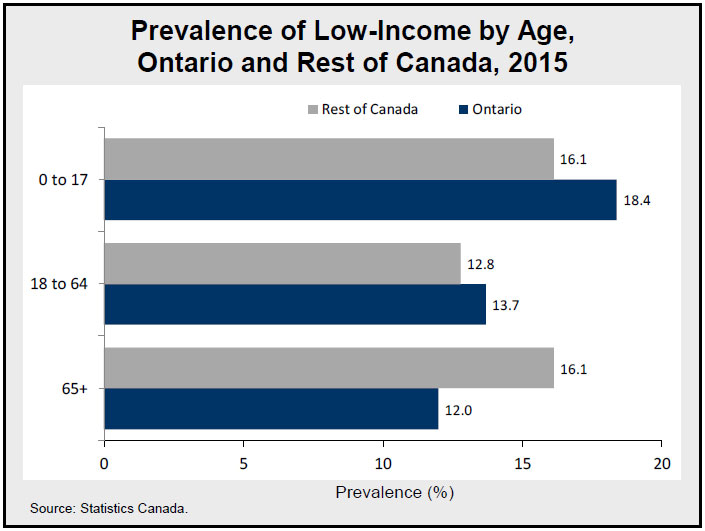
Over the 2005-2015 period, prevalence of low-income among children 0-17 rose from 16.7% to 18.4% in Ontario, while a decline was observed in the rest of Canada (from 17.5% to 16.1%).
Similarly, low-income rates among the core working-age group (18-64) rose in Ontario from 12.3% in 2005 to 13.7% in 2015, while falling in the rest of the country (from 14.1% to 12.8%).
Prevalence of low-income among seniors 65+ rose both in Ontario (from 9.1% to 12.0%) and in the rest of Canada (from 13.8% to 16.1%) over the same period.
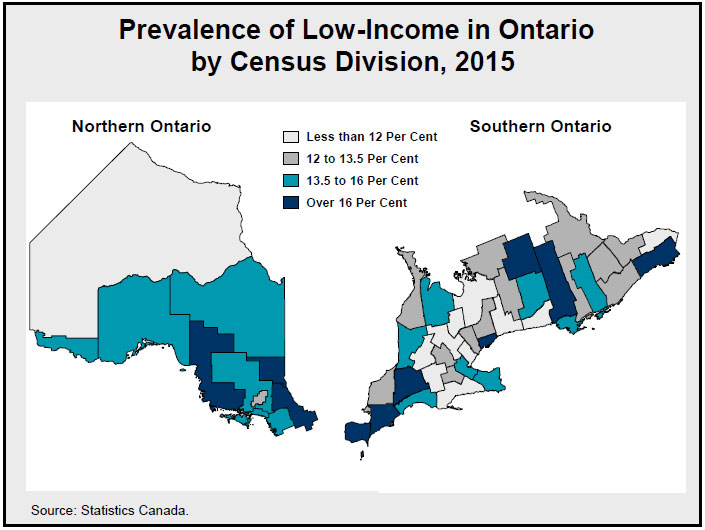
High prevalence of low-income in the southwest
In 2015, the lowest rates of low-income in Ontario were in census divisions surrounding Toronto, such as Halton (8.2%), Dufferin (8.7%) and Durham (9.7%).
The census division with by far the highest prevalence of low-income in 2015 was Toronto at 20.2%, followed by Stormont, Dundas and Glengarry at 17.9%.
The Southwest and the Northeast also had many census divisions among those with the highest prevalence of low-income in Ontario.
In general, census divisions in and around Central Ontario had the lowest rates of low-income in the province.
Accessible image descriptions
Median household income growth, 2005-2015
This table shows median household income growth in Canada and the provinces over 2005-2015. Nationally, median household income grew 10.8% over the period. Saskatchewan saw the fastest growth at 36.5%, while Ontario saw the slowest growth at 3.8%.
| Region | Median Income (2015 constant dollars) 2005 | Median Income (2015 constant dollars) 2015 | Percentage Change 2005 to 2015 |
|---|---|---|---|
| CANADA | 63,457 | 70,336 | 10.8 |
| Newfoundland and Labrador | 52,204 | 67,272 | 28.9 |
| Prince Edward Island | 55,061 | 61,163 | 11.1 |
| Nova Scotia | 55,117 | 60,764 | 10.2 |
| New Brunswick | 53,483 | 59,347 | 11.0 |
| Quebec | 54,921 | 59,822 | 8.9 |
| Ontario | 71,534 | 74,287 | 3.8 |
| Manitoba | 56,644 | 68,147 | 20.3 |
| Saskatchewan | 55,251 | 75,412 | 36.5 |
| Alberta | 75,684 | 93,835 | 24.0 |
| British Columbia | 62,372 | 69,995 | 12.2 |
Source: Statistics Canada.
Change in median total Income by census family type, 2005-2015
This bar chart shows the change in median total income by census family type over the 2005 -2015 period. For all Census family types combined, median income grew 5%. Female lone-parents saw the fastest growth at 10%, while male lone-parents saw the slowest growth at 0%.
Before- & after-tax median income by census family type, 2015
This bar chart shows before- and after-tax median income by Census family type in 2015 in Ontario. For all family types combined, before-tax median income was $86,081, with after-tax at $75,369. Couples with children had the highest median before-tax income at $110,935, with after-tax income at $95,235. Female lone-parents had the lowest median before-tax income at $47,463, with $44,846 after tax.
Change in median income by age group for income recipients aged 15+, 2005-2015
This bar chart shows the change in median income by age group for income recipients aged 15+ over the 2005-2015 period. For all ages, median income grew by 4%. The age group with the fastest income growth was the 15-24 group at 15%. Median income declined by 2% for the 25-34 age group.
Change in median income by gender for income recipients aged 15+, 2005-2015
This bar chart shows the change in median income by gender for income recipients aged 15+ over 2005-2015. For Canada as a whole, median income of females grew by 19.1%, while that of male grew 6.7%. For Ontario, median income of females rose 11.7%, while that of males declined by 2.4%.
Composition of total Income in Ontario, population aged 15+, 2015
This pie chart shows the composition of total income in Ontario for the population aged 15+ in 2015. Employment income accounted for 72.9% of total income, private pensions, investments and other market income accounted for 16.0%, and government transfers accounted for 11.1%.
Distribution of individuals with income, Ontario and rest of Canada, 2015
This bar chart shows the distribution of individuals with income in Ontario and the rest of Canada in 2015. The largest group was those with $10,000 to $19,999 in income in both Ontario (17.3%) and the rest of Canada (16.8%).
Median household income by census division, 2015
This map shows median household income by Ontario census division in 2015. The highest median household incomes were observed in the suburban GTA. The lowest median incomes were generally in rural and northern parts of the province.
Change in median household income by census division, 2005-2015
This map shows the change in median household income by Ontario census division over 2005-2015. Median household income growth was generally faster in the Northeast and Eastern Ontario, and slower in the Southwest and the suburban GTA.
Prevalence of low-Income by census family type, Ontario and rest of Canada, 2015
This bar chart shows the prevalence of low-income by Census family type in Ontario and the rest of Canada in 2015. For all private households, the prevalence of low-income was 14.0% in the rest of Canada and 14.4% in Ontario. Couples without children had the lowest prevalence of low-income in both the rest of Canada (7.0%) and Ontario (6.9%). Female lone-parent families had the highest prevalence of low-income in both the rest of Canada (30.8%) and Ontario (29.8%).
Prevalence of low-Income by age, Ontario and rest of Canada, 2015
This bar chart shows the prevalence of low-income by age in Ontario and the rest of Canada in 2015. For those aged 0-17, the prevalence was 16.1% in the rest of Canada and 18.4% in Ontario. For those aged 18-64, the prevalence was 12.8% in the rest of Canada and 13.7% in Ontario. For those aged 65+, the prevalence was 16.1% in the rest of Canada and 12.0% in Ontario.
Prevalence of low-Income in Ontario by census division, 2015
This map shows the prevalence of low-income by Ontario census division in 2015. The lowest prevalence was in census divisions surrounding Toronto. The highest prevalence was in Toronto.