Mother tongue and language
This fact sheet looks at mother tongue and language information released by Statistics Canada as part of the 2016 Census.
Share of population with an official language as mother tongue declined
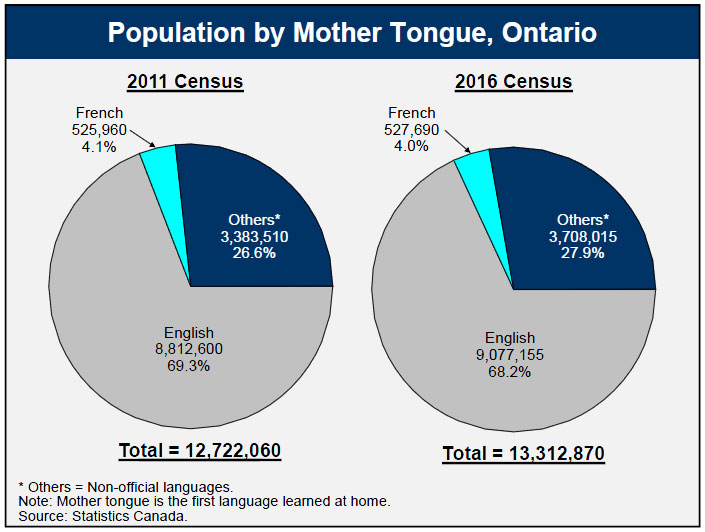
In 2016, 9.1 million Ontarians reported English as their mother tongue, an increase of 3% from 2011. However, the share declined to 68.2% from 69.3% in 2011.
There were 527,690 people reporting French as their mother tongue in Ontario in 2016, almost unchanged from 2011. They represented 4.0% of population in 2016, a modest change from 4.1% in 2011.
In 2016, 3.7 million Ontarians were Allophones (people with a mother tongue other than English or French), up from 3.4 million in 2011. The share of this group increased to 27.9% from 26.6% in 2011.
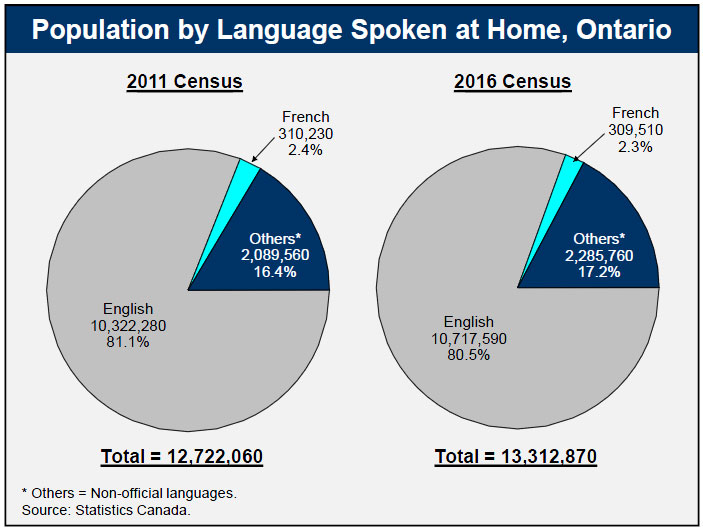
The 2016 Census showed that English remained the language spoken most often at home. Also, the percentage of Ontarians speaking English most often at home (80.5%) was substantially higher than the share of the population with English as mother tongue (68.2%).
Some non-official mother Tongues grew significantly
Around 200 languages were reported by Ontarians as mother tongue in the 2016 Census. The top 25 of these accounted for 98.3% of Ontario’s total population.
Among mother tongues spoken by over 40,000 Ontarians in 2016 (25 of them), the fastest growing since 2011 were Arabic (31.0%), Hindi (26.5%), Persian (24.7%), Bengali (23.7%), Urdu (21.5%), Chinese (18.0), and Tagalog (17.6%).
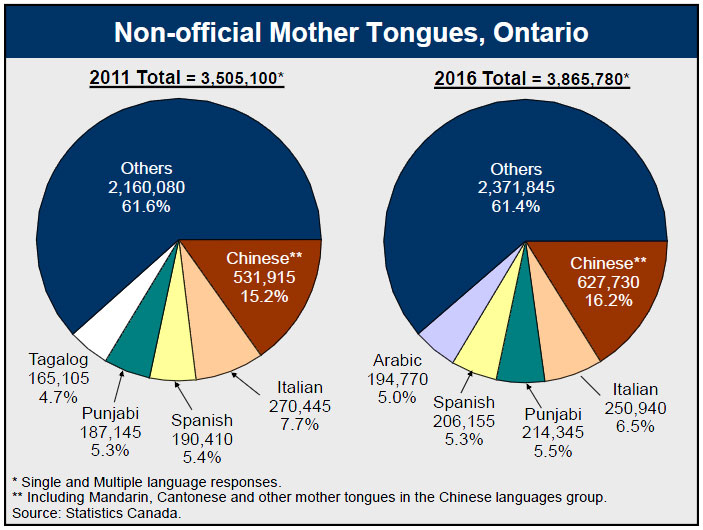
In 2016, Chinese languages remained the most numerous non-official mother tongue group in Ontario. Almost 628,000 people reported one of the Chinese languages as their mother tongue, representing 4.7% of Ontario’s population, an increase from 4.1% in 2011. Of all different Chinese languages Mandarin and Cantonese accounted for 46.6% and 46.1%, correspondingly.
Italian remained the fourth largest mother tongue in Ontario, but its numbers declined 7.2% since 2011. Punjabi rose to the fifth place, pushing Spanish to the sixth place. Arabic rose to the seventh. Tagalog, Urdu and Portuguese were in the eighth, ninth and tenth place, respectively.
Toronto CMA: largest proportion of allophones
More than four in 10 people had a mother tongue other than English or French in the Toronto Census Metropolitan Area (CMA) in 2016.
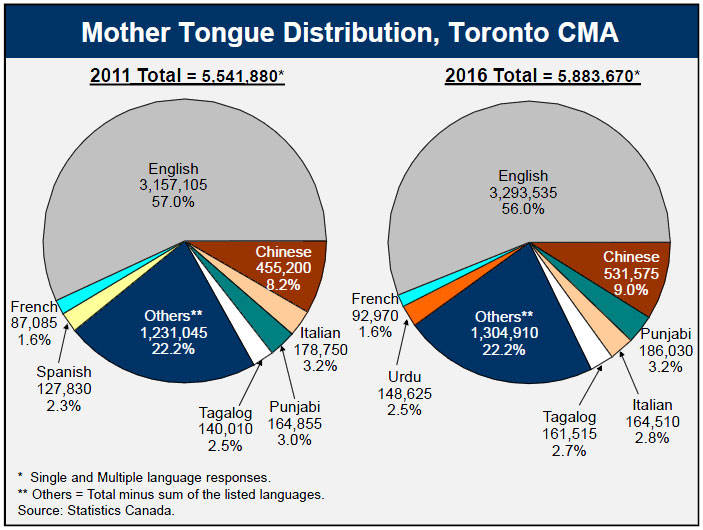
The Chinese language group remained the dominant non-official language group in the Toronto CMA, having been reported by 531,575 people, or 19.4% of the CMA's population whose mother tongue was neither English nor French.
Punjabi rose to the second place with 186,030 people, pushing Italian (164,510) to the third place, followed by Tagalog (161,515) and Urdu (148,625).
Other Ontario census metropolitan areas
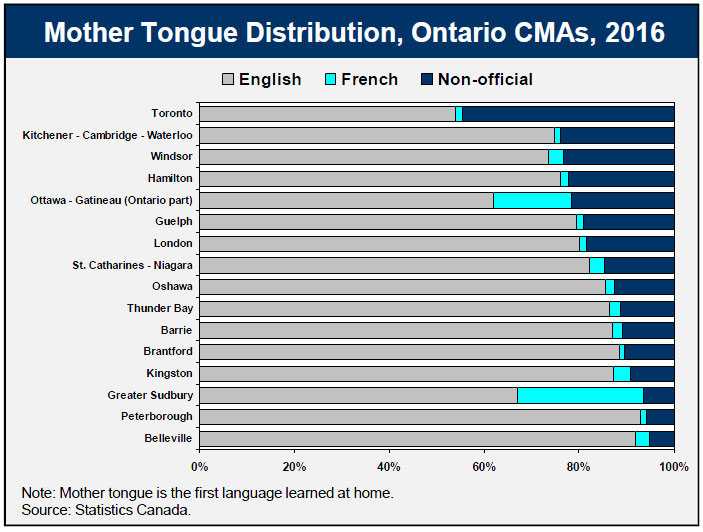
Peterborough, Belleville, and Brantford CMAs had the highest shares of Anglophones in their population, at 93.0%, 92.1% and 88.4%, respectively.
The CMAs with the highest shares of Francophones were Greater Sudbury (26.6%), Ottawa-Gatineau (Ont. part) (16.3%), Kingston (3.5%), and Windsor and St. Catharines - Niagara (both at 3.3%).
Toronto had the highest share of non-official languages as mother tongue (44.7%), followed by Kitchener - Cambridge - Waterloo (24.0%), Windsor (23.2%), and Hamilton (22.3%).
Ontario municipalities (population 5,000+)
Among Ontario’s municipalities of at least 5,000 people in 2016, Markham had the highest share of non-official languages as mother tongue (62.3%), followed by Richmond Hill (61.0%), Vaughan (52%), Mississauga (50.2%), Brampton (48.4%), and Toronto (45.7%).
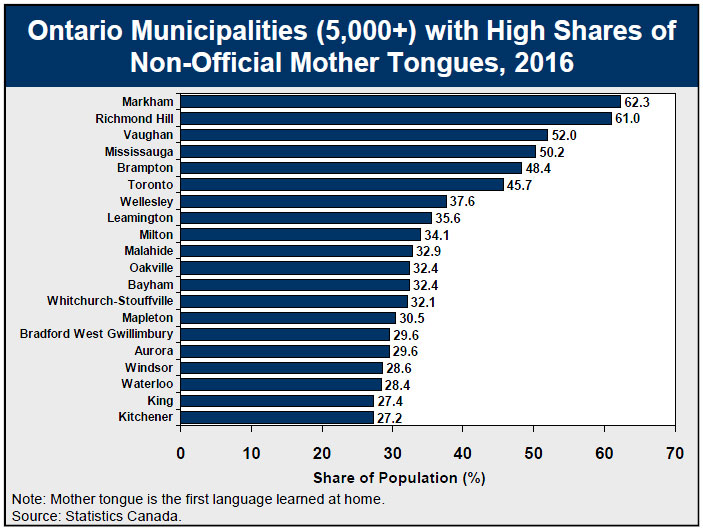
Compared to 2011, the share of non-official languages of these municipalities also increased, except Toronto where the share of non-official languages declined slightly.
The highest shares of Anglophones were found in the municipalities of Stone Mills (96.4%), St. Clair (95.8%), Georgian Bluffs and Brockton (both at 95.6%), and Greater Napanee (95.5%).
The highest shares of Francophones were in the municipalities of Hearst (87.6%), Hawkesbury (79.1%), Alfred & Plantagenet (76.6%), The Nation (67.5), and Kapuskasing (66.7%).
Accessible image descriptions
Population by mother tongue, Ontario
These pie charts show the distribution of Ontario’s population by mother tongue in 2011 and 2016. In 2011, 69.3% of Ontarians had English as mother tongue, 4.1% had French and 26.6% had another language. In 2016, 68.2% of Ontarians had English as mother tongue, 4.0% had French, and 27.9% had another language.
Population by language spoken at home, Ontario
These pie charts show the distribution of Ontario’s population by language spoken at home in 2011 and 2016. In 2011, 81.1% of Ontarians spoke English at home, 2.4% spoke French and 16.4% spoke another language at home. In 2016, 80.5% of Ontarians spoke English at home, 2.3% spoke French and 17.2% spoke another language at home.
Non-official mother tongues, Ontario
These pie charts show the distribution on Ontario’s population with non-official mother tongues in 2011 and 2016. In 2011, 15.2% of Ontarians with non-official mother tongues had one of the Chinese languages as mother tongue, 7.7% had Italian, 5.4% had Spanish, 5.3% had Punjabi, 4.7% had Tagalog, and 61.6% had other languages. In 2016, 16.2% of Ontarians with non-official mother tongues had one of the Chinese languages as mother tongue, 6.5% had Italian, 5.5% had Punjabi, 5.3% had Spanish, 5.0% had Arabic, and 61.4% had another language.
Mother tongue distribution, Toronto CMA
These pie charts show the distribution of the Toronto CMA’s population by mother tongue in 2011 and 2016. In 2011, 57.0% had English as mother tongue, 8.2% had one of the Chinese languages, 3.2% had Italian, 3.0% had Punjabi, 2.5% had Tagalog, 2.3% had Spanish, 1.6% had French, and 22.2% had another language. In 2016, 56.0% had English as mother tongue, 9.0% had one of the Chinese languages, 3.2% had Punjabi, 2.8% had Italian, 2.7% had Tagalog, 2.5% had Urdu, 1.6% had French, and 22.2% had another language.
Mother tongue distribution, Ontario CMAs, 2016
This line chart shows the distribution of Ontario CMAs’ population by mother tongue in 2016. The CMAs with the highest proportion of English mother tongue were Belleville and Peterborough. The CMAs with the highest proportion of French mother tongue were Greater Sudbury and the Ontario part of Ottawa-Gatineau. The CMAs with the highest proportion of non-official mother tongues were Toronto and Kitchener-Cambridge-Waterloo.
Ontario municipalities (5,000+) with high shares of non-official mother tongues, 2016
This bar chart shows Ontario municipalities of over 5,000 residents with high shares of non-official mother tongues in 2016. The five highest proportions were in Markham (62.3%), Richmond Hill (61.0%), Vaughan (52.0%), Mississauga (50.2%), and Brampton (48.4%).