Commuting to work
This factsheet looks at data on commuting to work released by Statistics Canada as part of the 2016 Census.
More Ontarians with no fixed workplace
The 2016 Census revealed that the share of Ontarians with a usual place of work reached 81.0%, down from 85.5% in 1996. There was a corresponding increase in people with no fixed workplace, from 6.9% in 1996 to 11.1% in 2016.
The share of people working from home remained stable, at 7.3%.
Public transit use rising among commuters
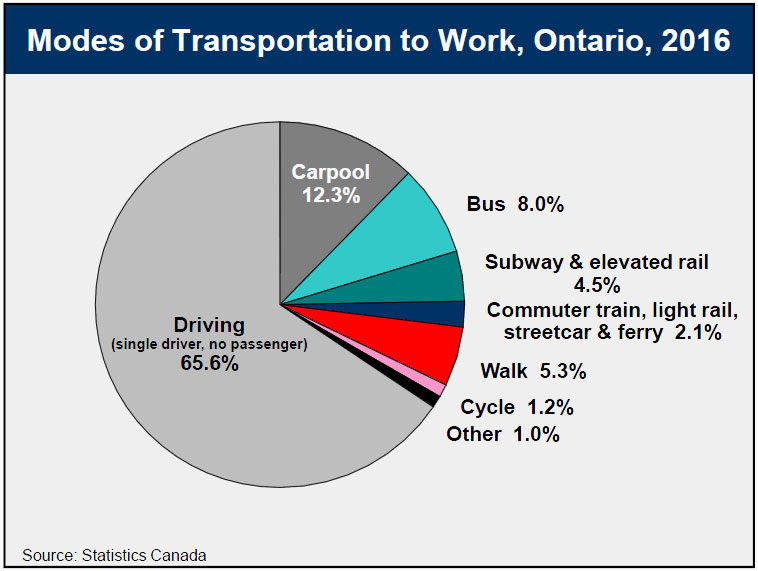
In 2016, 77.9% of Ontario commuters used private vehicles (car, truck or van) to go to work, down from 79.9% in 1996. Within this group, 84.2% drove alone and 15.8% carpooled.
14.6% of commuters used public transit for the longest part of their trip, up from 12.2% in 1996. Of transit users, 54.7% commuted by bus, 30.9% by subway or elevated rail, and 14.4% by commuter train, light rail, streetcar or ferry.
About 5.3% of Ontario commuters walked to work down from 6.1% in 1996. Finally, 1.2% cycled, up slightly from 1.0% 20 years earlier.
High use of non-auto transportation in large cities
Among Canadian Census Metropolitan Areas (CMAs), Toronto commuters were most likely (31.0%) to walk, cycle or use public transit to get to work, followed by those in Montreal (29.5%) and Vancouver (29.4%).
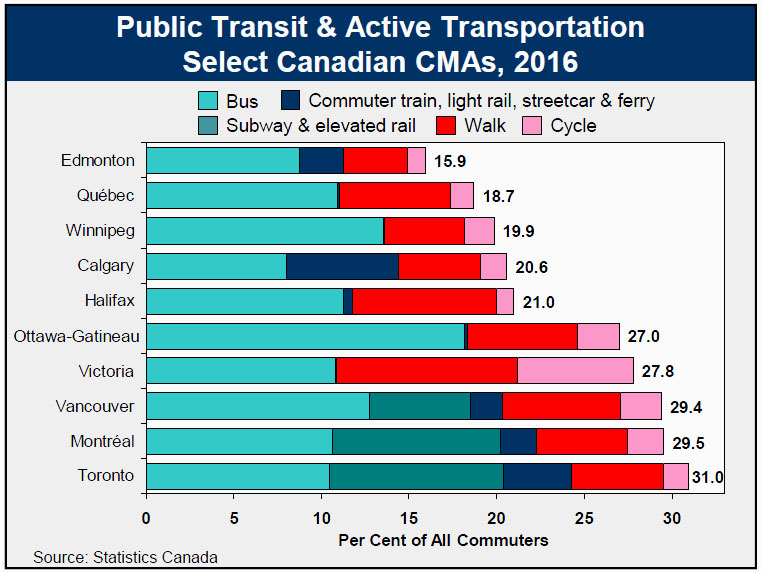
Nationally, Toronto had the highest share of its commuters using subway and elevated rail to get to work, at 9.9%. Ottawa-Gatineau had the highest share of bus commuters in the country at 18.1%. Victoria had the highest share of commuters walking (10.3%) and cycling (6.6%) to work.
In Ontario, the highest proportion of carpoolers was in Barrie (14.5%), and the lowest was in Windsor (10.8%).
More people walk to work in smaller Ontario CMAs
Toronto (68.0%) and the Ontario part of the Ottawa-Gatineau CMA (69.8%) had the lowest shares of people using a car, truck or van to get to work in Ontario. The proportion of drivers was highest in Windsor (91.5%) and Brantford (91.4%).
In smaller CMAs, the share of people walking to work was often larger than the share of transit users.
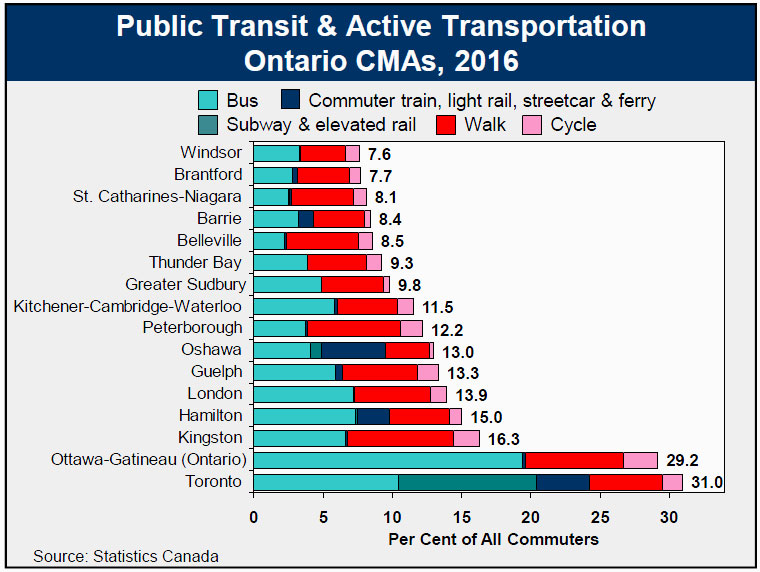
Kingston had the highest share of walking commuters (7.6%) and Ottawa-Gatineau the highest share of cyclists (2.5%).
Ontarians have the longest commutes in Canada
In 2016, Canadians commuters spent an average of 26.2 minutes travelling to work, practically the same amount of time on average as in the United States (26.6 minutes).
Ontarians had a slightly longer average commute of 28.8 minutes, the longest among provinces, and an increase from 27.6 minutes in 2011 (first time this data was collected). The shortest average commute was in Prince Edward Island (18.0 minutes).
The increase in average commute time in Ontario since 2011 is attributable to longer travel time for those using public transit.
One in ten commuters travel for over an hour
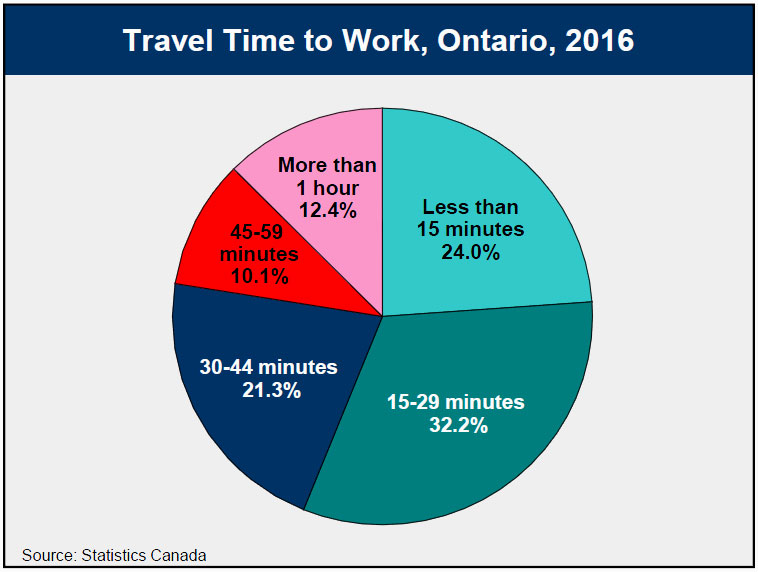
About one quarter of Ontarians had a commute of less than 15 minutes (24.0%), and close to a third (32.2%) travelled between 15 and 29 minutes to get to work. Another 21.3% travelled for 30 to 44 minutes.
Longer commutes of over 45 minutes were the lot of less than one Ontarian out of 5. About 10.1% travelled between 45 and 59 minutes to work, while 12.4% commuted for over one hour.
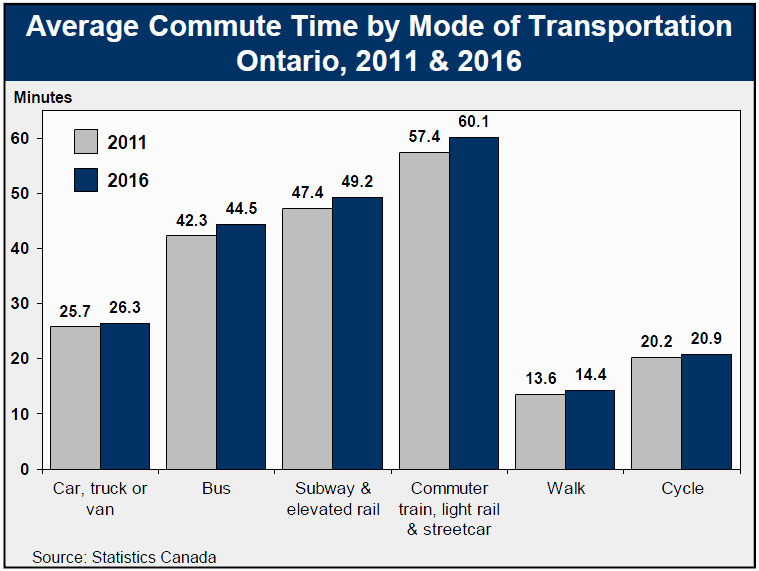
Public transit commutes taking more time
Public transit travel times include the time required to walk to the bus stop, subway or train station, as well as waiting times.
In 2016, Ontarians using train, light rail and streetcar to get to work had the longest average commutes at 60.1 minutes, up from 57.4 minutes in 2011, the most significant duration increase by mode of transportation.
Subway and elevated rail commuters also saw their travel time rise from 47.4 minutes in 2011 to 49.2 minutes in 2016, along with bus commuters (from 42.3 to 44.5 minutes).
By contrast, those traveling by private vehicle, walking and cycling saw smaller increases in commute times over the 2011-2016 period. Average commute times rose from 25.7 to 26.3 minutes for those using a car, truck or van, from 13.6 to 14.4 minutes for those walking, and from 20.2 to 20.9 minutes for those cycling to work.
Toronto: Longest travel times to work in Canada
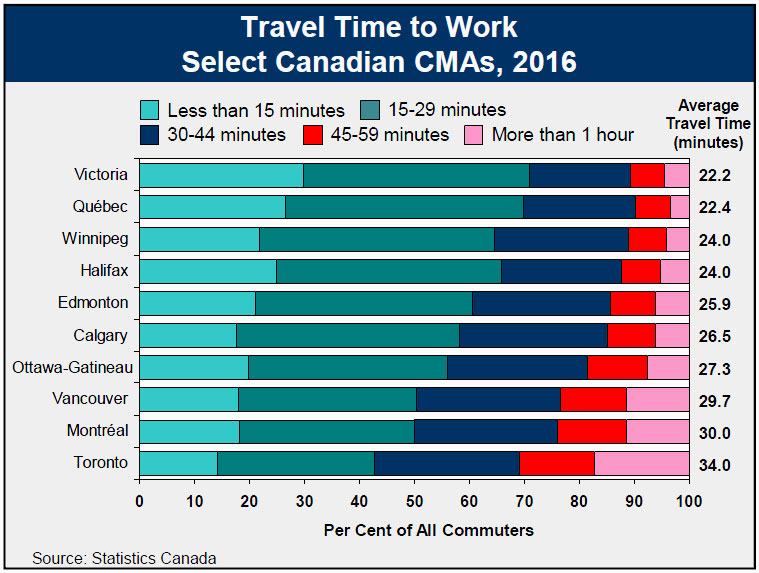
Among Canadian CMAs, the longest average travel times to work were in Toronto at 34.0 minutes. Comparatively for large American metropolitan areas, average travel time to work in New York was 34.7 minutes, while the average commute in Washington was 32.8 minutes.
Montreal (30.0 minutes) and Vancouver (29.7) were also Canadian CMAs with long commutes.
Commuters in Saguenay (17.7 minutes) and Thunder Bay (17.5) had the shortest average travel times.
Thunder Bay: Fastest commutes
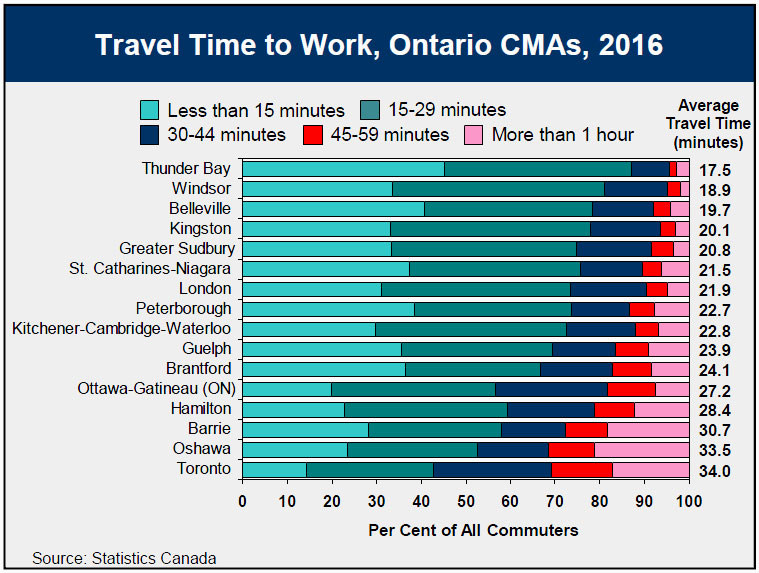
Within Ontario, commuters in the CMAs of Toronto (34.0 minutes), Oshawa (33.5) and Barrie (30.7) had the longest average commutes.
The shortest average commutes were in Thunder Bay (17.5 minutes), Windsor (18.9) and Belleville (19.7).
Average travel times do not reflect the experience of all commuters. For some, travel times are much longer.
In Canada, 18.2% of commuters took 45 minutes or more to get to work. Commuters in the Greater Toronto Area were much more likely to be in this group.
In 2016, 31.5% of commuters in Oshawa, 30.8% of those in Toronto and 27.7% of those in Barrie spent 45 minutes or more travelling to work.
While 87.0% of commuters in the Thunder Bay CMA travelled 29 minutes or less to work, this was the experience of only 42.8% of Toronto commuters.
Many Oshawa commuters work in toronto
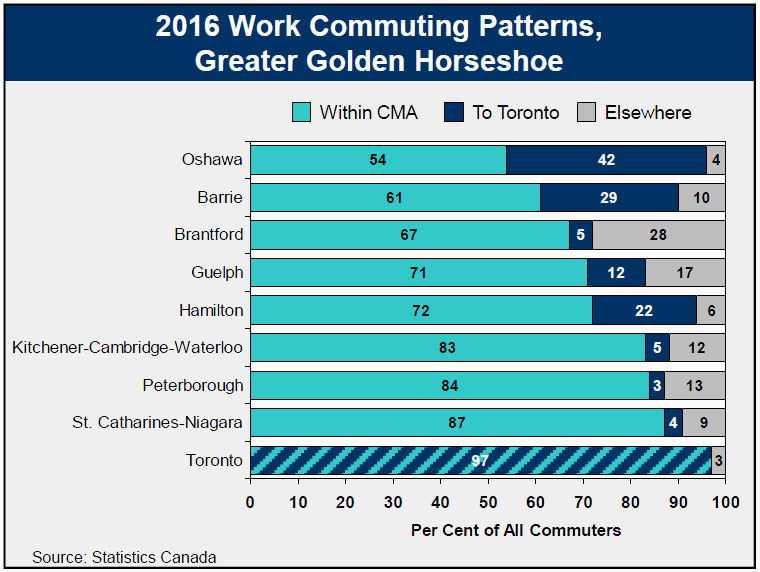
Among the eight CMAs of the Greater Golden Horseshoe (GGH), with the exception of Toronto (3%), St. Catharines-Niagara had the lowest proportion of commuters going to a workplace outside of its CMA boundaries, at 13%, followed by Peterborough (16%) and Kitchener-Cambridge-Waterloo (17%).
By contrast, 46% of Oshawa’s commuters went to work outside the CMA. The Barrie (39%) and Brantford (33%) CMAs also had significant shares of residents commuting outside their boundaries.
Of the eight CMAs of the GGH, Oshawa had the highest share of residents commuting to the Toronto CMA for work, at 42%. Resident of the Barrie (29%) and Hamilton (22%) CMAs also had high propensities of commuting to the Toronto CMA for work.
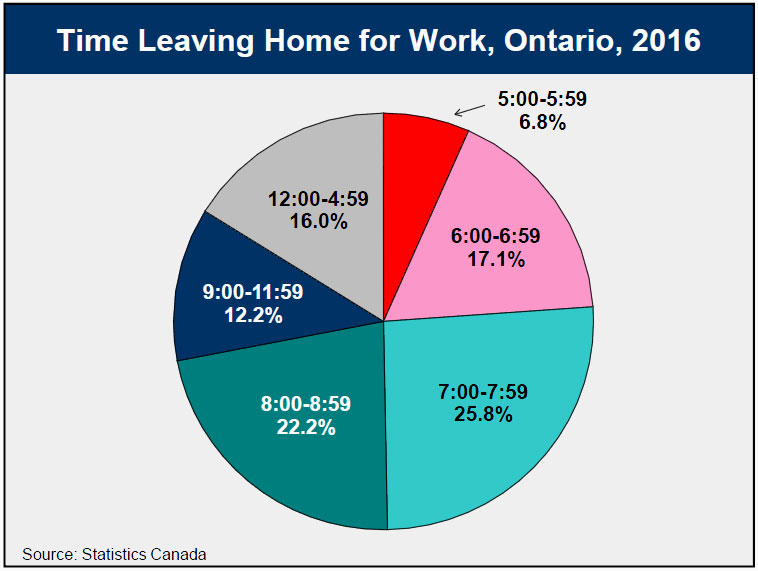
Most commuters leave home before 8 am
About a quarter of Ontario commuters leave before 7 am. 6.8% leave home for work between 5:00 and 5:59 am, and 17.1% leave between 6:00 and 6:59 am.
Roughly half of Ontarians leave for work between 7:00 and 8:59am, while 28.1% leave during the rest of the day or at night (between 9:00am and 4:59 am).
Commuters with long travel times leave home early
Ontario commuters leaving home between 5:00 and 5:59 am had the longest travel times, averaging 36.9 minutes, followed by people leaving between 6:00 and 6:59 am at 32.7 minutes.
People leaving home in late morning (between 9:00 and 11:59 am) had the shortest commute times, averaging 23.8 minutes.
Accessible image descriptions
Modes of transportation to work, Ontario, 2016
This pie chart shows modes of transportation to work in Ontario in 2016, which included driving (single driver, no passenger) at 65.6%, carpool at 12.3%, bus at 8.0%, subway and elevated rail at 4.5%, commuter train, light rail, streetcar and ferry at 2.1%, walk at 5.3%, cycle at 1.2% and other at 1.0%.
Public transit & active transportation, select Canadian CMAs, 2016
This bar chart shows public transit and active transportation in selected Canadian CMAs in 2016. In total, Toronto had the highest share of residents using public transit and active transportation to go to work at 31.0%, followed by Montreal at 29.5%, and Vancouver at 29.4%.
Public transit & active transportation, Ontario CMAs, 2016
This bar chart shows public transit and active transportation in Ontario CMAs in 2016. In total, Toronto had the highest share of residents using public transit and active transportation to go to work at 31.0%, followed by Ottawa-Gatineau at 29.2% and Kingston at 16.3%. The lowest shares were in Windsor at 7.6%, Brantford at 7.7% and St. Catharines-Niagara at 8.1%.
Travel time to work, Ontario, 2016
This pie chart shows travel time to work in Ontario in 2016. 24.0% of workers took less than 15 minutes to get to work, 32.2% took between 15 and 29 minutes, 21.3% took between 30 and 44 minutes, 10.1% took between 45 and 59 minutes, and 12.4% took more than an hour.
Average commute time by mode of transportation, Ontario, 2011 & 2016
This bar chart shows average commute time by mode of transportation in Ontario in 2011 and 2016.The average commute time by car, truck or van, was 25.7 minutes in 2011 and 26.3 minutes in 2016. The average commute time by bus was 42.3 minutes in 2011 and 44.5 minutes in 2016. The average commute time by subway or elevated rail was 47.4 minutes in 2011 and 49.2 minutes in 2016. The average commute time by commuter train, light rail and streetcar was 57.4 minutes in 2011 and 60.1 minutes in 2016. The average walking commute time was 13.6 minutes in 2011 and 14.4 minutes in 2016. The average cycling commute time was 20.2 minutes in 2011 and 20.9 minutes in 2016.
Travel time to work, select Canadian CMAs, 2016
This bar chart shows travel time to work for selected Canadian CMAs in 2016. The CMA with the longest travel time was Toronto at 34.0 minutes, followed by Montreal at 30.0 minutes, and Vancouver at 29.7 minutes.
Travel time to work, Ontario CMAs, 2016
This bar chart shows travel time to work for Ontario CMAs in 2016. The longest travel time was in Toronto at 34.0 minutes followed by Oshawa at 33.5 minutes and Barrie at 30.7 minutes. The shortest travel times were in Thunder Bay at 17.5 minutes, Windsor at 18.9 minutes, and Belleville at 19.7 minutes.
2016 Work commuting patterns, greater golden horseshoe
This bar chart shows 2016 work commuting patterns in the Greater Golden Horseshoe. Toronto (97%) and St. Catharines-Niagara (87%) had the highest share of commuters who worked within their CMA’s boundaries. Oshawa (42%) and Barrie (29%) had the highest share of commuters working in the Toronto CMA.
Time leaving home for work, Ontario, 2016
This pie chart shows the time at which commuters leave home to go to work in Ontario in 2016. 6.8% left between 5:00am and 5:59am, 17.1% left between 6:00am and 6:59am, 25.8% left between 7:00am and 7:59am, 22.2% left between 8:00am and 8:59am, 12.2% left between 9:00am and 11:59am, and 16.0 % left between noon and 4:59am.