This page has been archived
The content on this page is no longer up to date. It will remain on ontario.ca for a limited time before it moves to the Archives of Ontario.
Ecological land classification – ecoregions
Ecological land classification–ecoregions
In the 1950s, Angus Hills developed the first comprehensive, hierarchical, ecological land classification system for describing ecosystems utilizing climate and geological landforms. In 2009 the Science and Information Branch of the MNRF revised Ontario’s ELC and published “The Ecosystems of Ontario, Part 1: Ecozones and Ecoregions”. As with Rowe’s, the source layer does not include all great lakes water, so the total area is less than the provincial total.
Total area by land class and ecoregion (hectares)
| Land class | Hudson Bay Lowlands | Ontario Shield | Mixedwood Plains | Total |
|---|---|---|---|---|
| Water | 1,668,965 | 8,729,663 | 351,171 | 10,749,799 |
| Wetland | 7,504,440 | 1,778,729 | 193,064 | 9,476,232 |
| Field/Agriculture | 491,107 | 4,903,819 | 5,394,926 | |
| Other | 365,652 | 1,051,607 | 701,383 | 2,118,642 |
| Treed Wetland | 9,607,984 | 4,476,998 | 886,091 | 14,971,074 |
| Forest | 5,658,825 | 49,194,926 | 1,226,252 | 56,080,003 |
| Total Area | 24,805,866 | 65,723,030 | 8,261,780 | 98,790,676 |
Total area by land class and ecodistrict (hectares)
| Ecodistrict | Crown | Parks and protected areas | Other | Total |
|---|---|---|---|---|
| 0E | 2,326,414 | 1,471,214 | 4,047 | 3,801,675 |
| 1E | 5,793,800 | 872,400 | 31,416 | 6,697,615 |
| 2E | 14,135,445 | 105,974 | 65,158 | 14,306,576 |
| 2W | 15,069,585 | 1,024,468 | 203,566 | 16,297,619 |
| 3E | 11,376,309 | 1,064,512 | 1,238,477 | 13,679,298 |
| 3S | 5,204,606 | 1,372,952 | 46,089 | 6,623,647 |
| 3W | 6,991,847 | 1,519,714 | 372,020 | 8,883,581 |
| 4E | 3,139,211 | 670,272 | 264,668 | 4,074,150 |
| 4S | 4,766,683 | 927,520 | 273,200 | 5,967,403 |
| 4W | 1,255,657 | 514,687 | 257,797 | 2,028,141 |
| 5E | 3,719,056 | 775,712 | 3,343,889 | 7,838,657 |
| 5S | 99,177 | 20,832 | 210,526 | 330,535 |
| 6E | 103,461 | 61,324 | 5,833,079 | 5,997,865 |
| 7E | 76,201 | 12,502 | 2,175,212 | 2,263,915 |
| Total Area | 74,057,451 | 10,414,083 | 14,319,142 | 98,790,676 |
Map of ecoregions and ecozones
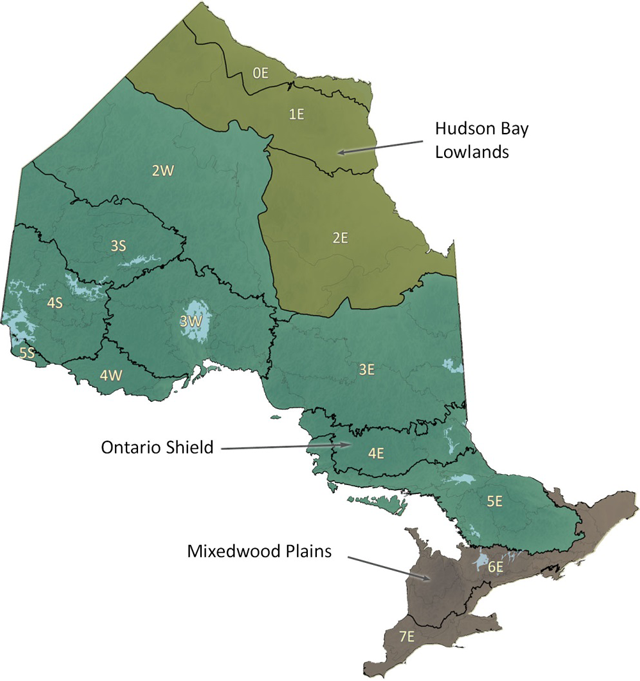
Enlarge map of ecoregions and ecozones
Area by ecoregion

Updated: November 27, 2023
Published: October 23, 2017