Build compact and efficient communities
The Growth Plan supports the creation of more compact, mixed-use and transit-supportive communities. It also establishes targets for densities and intensification to enable municipalities to plan for and direct the forecast population and employment growth in the most efficient way possible.
The four indicators in this theme will measure progress toward implementing the quantitative targets and related policies of the Growth Plan.
Achieving intensification
The Core Indicator
The percentage of new residential units constructed in the built-up area of the upper- and single-tier municipalities in the region.
Why It Matters
The Growth Plan supports making better use of land and infrastructure in the region by directing growth to urban areas that have already been developed where the capacity can best accommodate the forecast population. The Growth Plan requires that, by 2015 and for each year thereafter, a minimum of 40 per cent of all residential development occurring annually within each upper- and single-tier municipality be within its built-up area. Alternative targets have been approved for five outer-ring municipalities to reflect local circumstances, as follows: Brant County (15%); Wellington County (20%); City of Kawartha Lakes (30%); Haldimand County (32%); and Simcoe County (32%). This indicator tracks municipal progress toward the Growth Plan’s intensification targets.
How was it measured?
The ministry used 2012 property assessment data, together with a data layer that shows areas inside and outside of the built-up area, to calculate the percentage of new residential dwellings developed within the built-up area
Results
Initial findings over four years indicate that many municipalities are achieving or exceeding their required intensification target ahead of the 2015 target date. Between 2007 and 2010, upper- and single-tier municipalities across the region achieved an average annual intensification rate of 60 per cent. The intensification rate for the region excluding Toronto is 44 per cent.
Considerations
Intensification rates can vary widely year-over-year due to construction cycles. Therefore, a four-year period was considered for this initial baseline assessment. There is also a time lag between building construction and assessment. For this and other reasons, these figures may not correspond with municipal records. However, the use of the same data source through time will provide a picture of how intensification rates are changing in response to the policies.
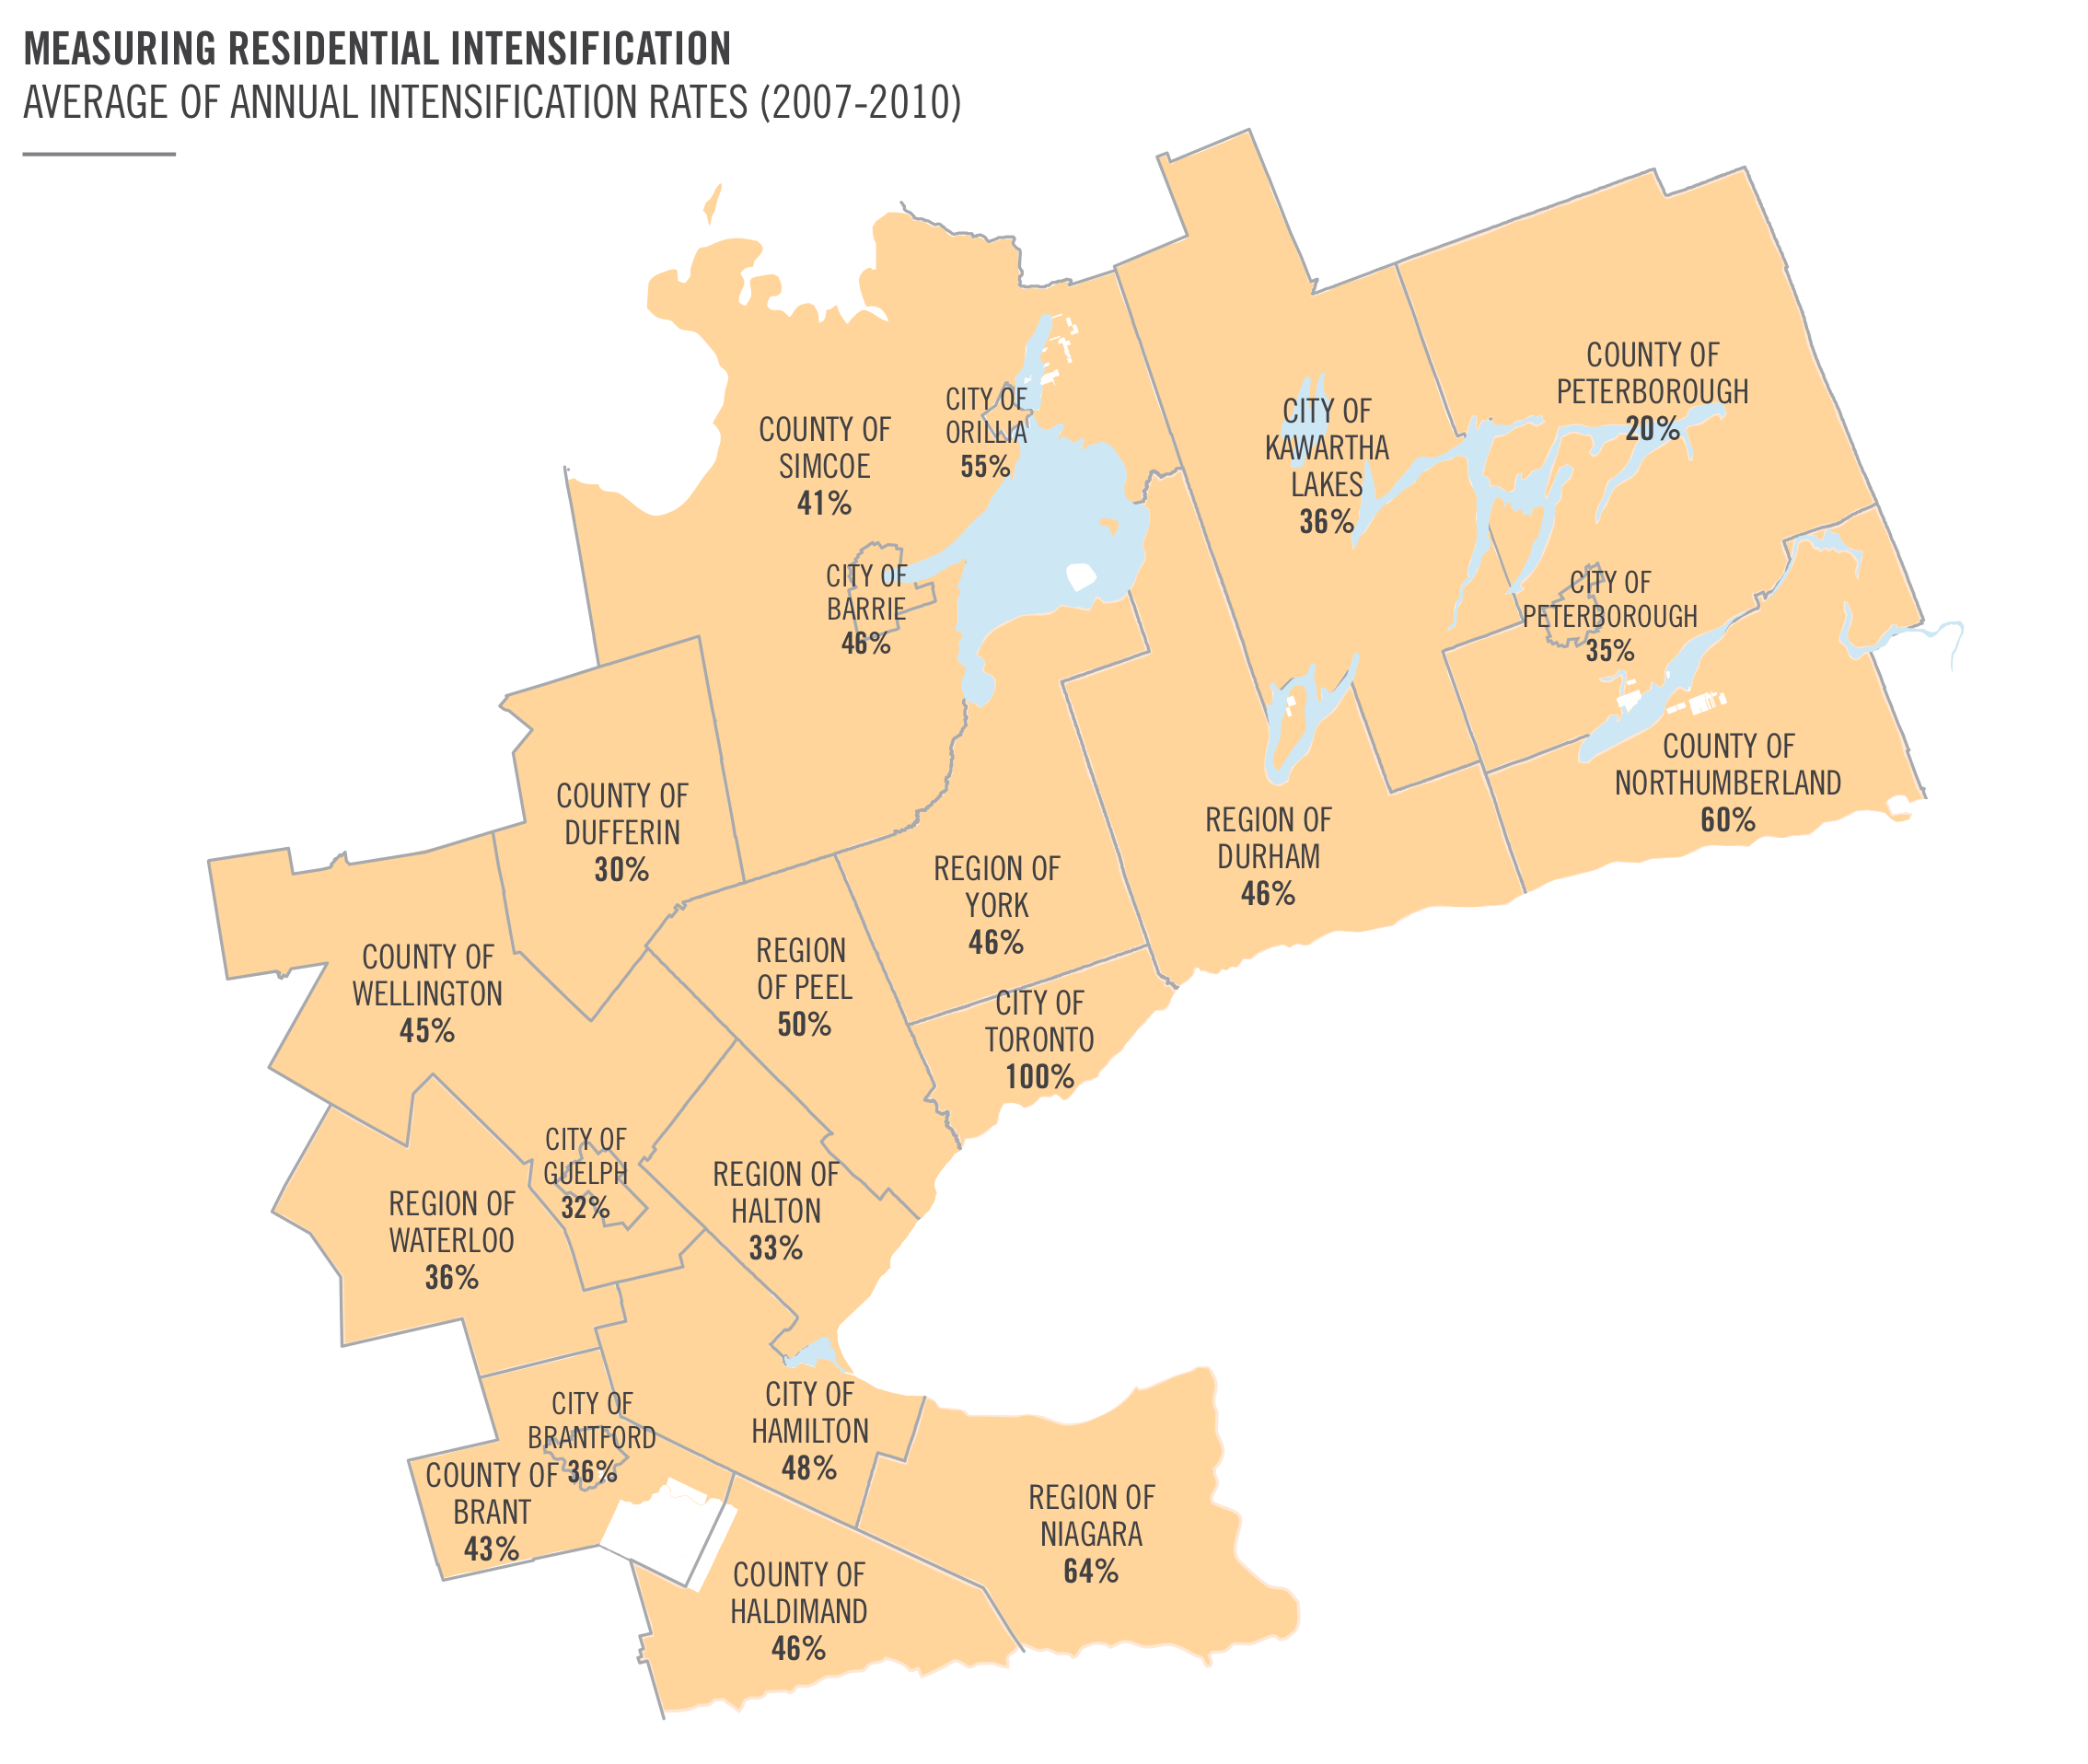
This map shows the average percentage of new residential development from 2007 to 2010 that is being built within the built-up area. The percentages are based on the ministry's analysis of MPAC (Municipal Property Assessment Corporation) data.
Urban Growth Centre Density
The Core Indicator
The number of people and jobs per hectare in the urban growth centres identified in the Growth Plan.
Related Supporting Indicator
The ratio of people to jobs in each urban growth centre.
Why It Matters
The Growth Plan identifies 25 existing downtowns or emerging centres as urban growth centres. Each centre has a minimum gross density target that must be achieved by 2031, ranging from 150 to 400 people and jobs combined per hectare, depending on the centre. Some municipalities have set higher targets than the minimum. Focusing growth to these areas supports the creation of regional focal points and more compact, mixed-use, transit-supportive and energy efficient communities in the region. All of these factors can help in the reduction of greenhouse gas emissions, and are also important in preparing for the impacts of a changing climate.
How was it measured?
The number of people and jobs per hectare for each urban growth centre was measured from customized data that Statistics Canada provided from the 2011 Census and National Household Survey.
Results
The results indicate that urban growth centres are making progress towards their targets. As of 2011, five years after the Growth Plan came into effect, and one fifth of the way to 2031, all but three urban growth centres had reached more than 20 per cent of their 2031 target densities, and three were already at or near their targets. A few centres are almost fully developed, while other centres are still at the early stages of development. Results are a baseline against which to assess further progress.
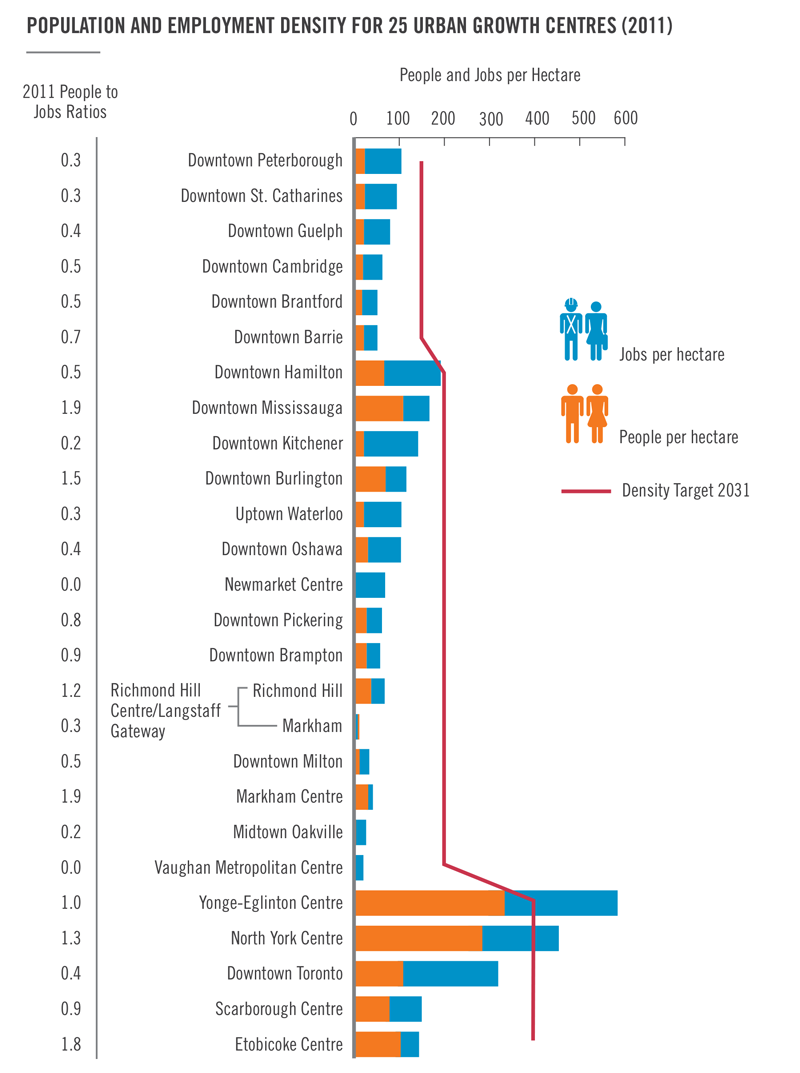
Note: A value of 1.0 indicates a ratio of one person to one job.
Considerations
Although data was available for 2006, Statistics Canada cautions against comparing 2006 and 2011 employment data, because of a change in methodology for collecting place of work data. For this reason, 2011 was used as the base year for this indicator. The density targets established in the Growth Plan for these urban growth centres are shown by the red line in the graph. The urban growth centres are at different stages of maturity, and have different characteristics.
Major Transit Station Area
The Core Indicator
The number of people and jobs per hectare within major transit station areas (MTSAs).
Why It Matters
Ensuring that existing and future transit is viable is critically important to the Growth Plan. MTSAs are defined in the Growth Plan as the land within a 500-metre radius (approximate ten minute walking distance) of an existing or planned higher order transit station in a settlement area, or of a bus depot within an urban core. The Growth Plan requires municipalities to plan for a mix of uses and to set minimum density targets for intensification areas, which by definition include MTSAs. The density targets are to be consistent with any transit-supportive land use guidelines developed by the Ministry of Transportation.
How was it measured?
Based on municipal official plans in 2012, a total of 333 MTSAs were identified in the Greater Golden Horseshoe. The areas were either mapped, or a 500-metre radius was drawn around them as a stand-in if mapping was not available. In many cases, MTSAs aligned with provincial GO stations. The analysis also included existing stations and stations under construction that were on higher order transit lines (subways, light rail transit or bus rapid transit), even if these were not identified in an official plan. Once stations were identified, 2011 Statistics Canada data was used to estimate the population and jobs per hectare in each MTSAs.
Results
This indicator provides a baseline for measuring further changes to densities in MTSAs going forward. The table shows how the density at MTSAs in 2011 compares to selected minimum transit-supportive density standards identified in the Ministry of Transportation’s Transit-Supportive Guidelines: 50 people and jobs per hectare for basic transit service; 160 people and jobs per hectare for dedicated rapid transit service (e.g., LRT); and 200 people and jobs per hectare for subway service.
MTSAs are organized by whether they are:
- an existing higher order transit station (organized by subway, BRT/LRT and GO bus and train); or
- planned higher order transit stations (includes MTSAs identified in a municipal official plan or under construction).
The results indicate that many MTSAs have the potential for significant intensification.
Considerations
Over the long term, this indicator will monitor how the densities at MTSAs compare to the target densities that municipalities will set in accordance with the requirements of the Growth Plan.
Some municipalities are still working to set the boundaries of their intensification areas and to establish density targets. This indicator can be recalculated once this work is finalized and the ministry has collected the information on MTSAs and target densities.
In establishing target densities for MTSAs, municipalities will consider each station’s long-term function within the municipal and regional transit network.
The density standards set out in MTO’s Transit Supportive Guidelines are not intended to apply to all stations on regional commuter lines. For example, a GO station that has been designed to serve a large, dispersed catchment area with base level service may not be considered a prime area for intensification over the life of the Growth Plan. For this reason, some municipalities may choose to assign density targets to GO station MTSAs that are below those outlined in the Transit-Supportive Guidelines for higher order transit, and this may be appropriate given their function. Other stations may be hubs for integrating regional and municipal transit, with frequent service, and the guidelines would call for much higher densities at these stations.
Finally, these results reflect that stations are at different stages of development and that it takes time to see change. For example, the current level of transit service at an MTSA may not support development of higher densities in the short term. However, as more investments are made in transit over time, and the surrounding areas are further developed, some of these stations would fulfill a vital transit function.
| Density Ranges (people and jobs per ha) | 0-49.9 | 50-159.9 | 160-199.9 | 200+ |
|---|---|---|---|---|
| Existing subway stations | 6 | 34 | 4 | 24 |
| Existing LRT/BRT stations | 11 | 10 | 1 | 0 |
| Existing GO train stations | 49 | 12 | 0 | 2 |
| Existing GO bus and local stations | 10 | 4 | 0 | 0 |
| Planned MTSAs | 68 | 90 | 3 | 5 |
| Total Stations | 144 | 150 | 8 | 31 |
| Percentage | 43.2% | 45.0% | 2.4% | 9.3% |
Note: Existing: means operating as of 2014
Based on Statistics Canada 2011 Census Population and NHS Place of Work data.
Designated Greenfield Density Area
The Core Indicator
Planned densities for designated greenfield areas.
Why It Matters
While a significant portion of the region’s growth is being directed to urban areas that have already been developed (built-up area), there is still a need for some new development in designated greenfield areas (DGA). The Growth Plan requires that designated greenfield areas of each upper- and single-tier municipality will be planned to achieve a minimum density of 50 people and jobs combined per hectare. This density tends to support walking, cycling and transit, a diverse mix of land uses, high-quality public open space and reduced greenhouse gas emissions. The Growth Plan permits the minister to approve an alternative density target under certain circumstances.
How Was It Measured?
Planned densities for the DGA of each upper- and single-tier municipality were taken from adopted upper- and single tier official plans, some of which are not yet in effect.
Results
Planned densities across the DGA are shown at right.
Planned densities for upper and single-tier municipalities meet the targets in the Growth Plan. Municipalities with approved alternative minimum density targets are planning to achieve those densities.
| Municipality | Planned Density (People and Jobs Combined per Hectare) |
|---|---|
| City of Hamilton | 50 |
| Region of Durham | 50 |
| Region of Halton | 50 |
| Region of Peel | 50 |
| Region of York | 50 |
| Municipality | Planned Density (People and Jobs Combined per Hectare) |
|---|---|
| City of Barrie | 50 |
| City of Brantford | 50 |
| City of Guelph | 50 |
| City of Kawartha Lakes | 40* |
| City of Orillia | 42* |
| City of Peterborough | 50 |
| County of Brant | 40* |
| County of Dufferin | 44* |
| County of Haldmimand | 29* |
| County of Northumberland | 30* |
| County of Peterborough | 40* |
| County of Simcoe | 39* |
| County of Wellington | 40* |
| Region of Niagara | 50 |
| Region of Waterloo | 50 |
Note: City of Toronto has no designated greenfield areas.
*Values with an asterisk show municipalities in the outer ring for which an alternative density target was approved by the Minister.
Related Supporting Indicator
Characteristics of the developing DGA based on lot sizes, mix of housing and estimated densities.
Why It Matters
The planned densities shown in the table on page 12 are to be achieved across the entire DGA of the upper or single-tier municipality. Each new development in the DGA contributes to the overall planned density, and the ministry is interested in tracking the density and other characteristics of this emerging development. Therefore, we have estimated the density of the existing developing DGA, and assessed the housing mix and lot sizes of the residential development. This provides a snapshot of what the developing DGA looks like today as it progresses towards the planned densities.
How Was It Measured?
The developing DGA includes lands that were built on, or were in the process of being built up to 2011.
The limits of the developing DGA were approximated by selecting and aggregating census dissemination blocks (DBs) with a perimeter size less than 1750 metres. Dissemination blocks are used by Statistics Canada to collect data on population and employment, and this size was chosen based on tests to see which would best approximate developing areas in the DGA.
Statistics Canada provided population counts and employment estimates for the developing DGA, and densities were calculated. MPAC property attributes were used to calculate the percentage of single-detached dwellings, semidetached dwellings, row houses and apartments in the developing DGA, and Land Information Ontario parcel fabric was used to calculate average lot areas by dwelling type.
Results
The lands identified as the developing DGA constitute a very small proportion (less than 9 per cent) of the total DGA. Of the parcels in the developing DGA across all Greater Golden Horseshoe municipalities, 95 per cent were developed between 2006 and 2011. The majority of this development was based on approvals that were granted before the Growth Plan came into effect.
On average, lot sizes in the developing DGA as of 2011 are smaller than residential development built in previous decades across the Greater Golden Horseshoe.
Since 1986, there has been a longterm decline in lot sizes across the Greater Golden Horseshoe. However, lot sizes in the developing DGA between 2006 and 2011 are smaller than lot sizes from previous decades.
Estimated densities of existing development vary considerably. Estimated densities across the entire developing DGA for the inner ring were 51 people and jobs combined per hectare, and across the outer ring were 23 people and jobs combined per hectare. Because of the lag between approvals and construction, this development likely reflects approvals that were granted before the Growth Plan came into effect.
Developing Designated Greenfield Areas
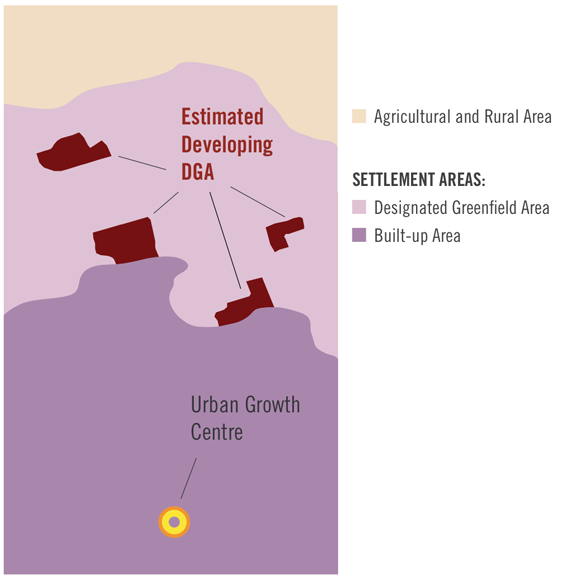
As the illustration shows, development can occur either as intensification within the built-up area of a municipality, or as new development within designated greenfield areas. Development does not always happen evenly, and it is built out over time. This indicator measures the estimated developing DGA, which can have varying sizes and shapes, as shown in this illustration.
Considerations
Density numbers are based on the best data that is available for the entire area as of 2011: Census population counts and National Household Survey place of work estimates.
By using a 1750-metre perimeter, this approach focused on smaller dissemination blocks that were most likely to be fully built or development ready. Larger blocks were found to often contain vacant land, and so were excluded, but this may also have excluded some built areas.
The estimated density figures for the developing DGA are gross. The methodology does not yet accommodate netting out natural heritage features and areas as is permitted in the Growth Plan. The developing DGA may contain some vacant land, and may exclude some parks, or open areas such as stormwater management ponds.
Only a small portion of the DGA has been developed, and densities are based on a very small area. One or two developments can have a disproportionate impact on the density results.
Single- and semi-detached dwellings tend to be built before multiple family residential development and associated employment uses. As more multiple-family residential units and associated employment uses are built within the developing DGA, estimated densities may increase.
Characteristics of Developing the DGA – Inner Ring
The sets of charts and tables on this page give a snapshot of the characteristics of development. The tables show the size of the developing DGA and estimated densities.
Housing Mix - Developing DGA Housing Mix in the Inner Ring, 2011
Single
Semi
Row
Apartment
Lot Sizes - Inner-Ring Median Developing DGA Lot Sizes Compared to Historic Lot Sizes (Square Metres)
Note that 5% of these lots were developed before 2006.
Singles
1986-1995
1996-2005
Developing DGA 2006-2011
Semis
1986-1995
1996-2005
Developing DGA 2006-2011
Row
1986 - 1995
1996-2005
Developing DGA 2006-2011
| Municipality | Developing DGA (ha) | Percentage of Total DGA | Esimated People | Estimated Jobs | Estimated Density (people and jobs per ha) |
|---|---|---|---|---|---|
| City of Hamiliton | 219 | 4.8% | 7,400 | 475 | 36 |
| Region of Durham | 409 | 3.1% | 15,210 | 970 | 40 |
| Region of Halton | 310 | 2.6% | 17,430 | 1,130 | 60 |
| Region of Peel | 671 | 6.7% | 60 | 38,105 | 2,215 |
| Region of York | 1,073 | 5.6% | 48,975 | 3,875 | 49 |
Characteristics of Developing the DGA – Outer Ring
Housing Mix - Developing DGA Housing Mix in the Outer Ring, 2011
Single
Semi
Row
Apartment
Lot Sizes - Outer-Ring Median Developing DGA Lot Sizes Compared to Historic Lot Sizes (Square Metres)
Note that 5% of these lots were developed before 2006.
Singles
1986-1995
1996-2005
Developing DGA 2006-2011
Semis
1986-1995
1996-2005
Developing DGA 2006-2011
Row
1986 - 1995
1996-2005
Developing DGA 2006-2011
| Municipality | Developing DGA (ha) | Percentage of Total DGA | Esimated People | Estimated Jobs | Estimated Density (people and jobs per ha) |
|---|---|---|---|---|---|
| City of Barrie | 212 | 8.3% | 4,435 | 195 | 38 |
| City of Brantford | 62 | 3.8% | 2,290 | 130 | 39 |
| City of Guelph | 156 | 7.1% | 51,60 | 235 | 35 |
| City of Kawathra Lakes | 92 | 5.8% | 665 | 65 | 8 |
| City of Orillia | 2 | 0.3% | 105 | 0 | 55 |
| City of Peterborough | 76 | 5.1% | 1,615 | 120 | 23 |
| County of Brant | 18 | 0.7% | 335 | 65 | 22 |
| County of Dufferin | 30 | 3.0% | 750 | 20 | 25 |
| County of Northumberland | 99 | 3.8% | 1,090 | 115 | 12 |
| County of Peterborough | 73 | 2.8% | 605 | 15 | 8 |
| County of Simcoe | 432 | 3.7% | 7,280 | 600 | 18 |
| County of Wellington | 100 | 3.9% | 945 | 25 | 10 |
| Haldimand County | 28 | 1.4% | 565 | 10 | 20 |
| Region of Niagara | 242 | 3.4% | 3,800 | 570 | 18 |
| Region of Waterloo | 488 | 6.6% | 14,180 | 935 | 31 |
Footnotes
- footnote[3] Back to paragraph This includes settlement areas with both a delineated and an undelineated built boundary.
- footnote[4] Back to paragraph Ministry of Transportation’s minimum density thresholds apply to areas within 400-800 metres of a transit station that is capable of supporting different types and levels of transit service.