Overview
How are we doing?
The Growth Plan for the Greater Golden Horseshoe was created in 2006 to guide where and how growth should occur in the region. The Growth Plan’s vision for 2041 calls for compact development that makes the best use of our limited land supply and offers a diversity of choices for living, working and enjoying culture. A fast, reliable and integrated transportation system will keep people and goods moving, and the Growth Plan, together with the plans of the Greenbelt, will foster a healthy natural environment and protect vital agricultural lands and natural systems. It is still early days in the implementation of the Growth Plan, and this document introduces and provides results for 14 performance indicators that will help track implementation of the plan over time. These indicators work with indicators for the Greenbelt Plan to provide a picture of how growth is taking shape in the region.
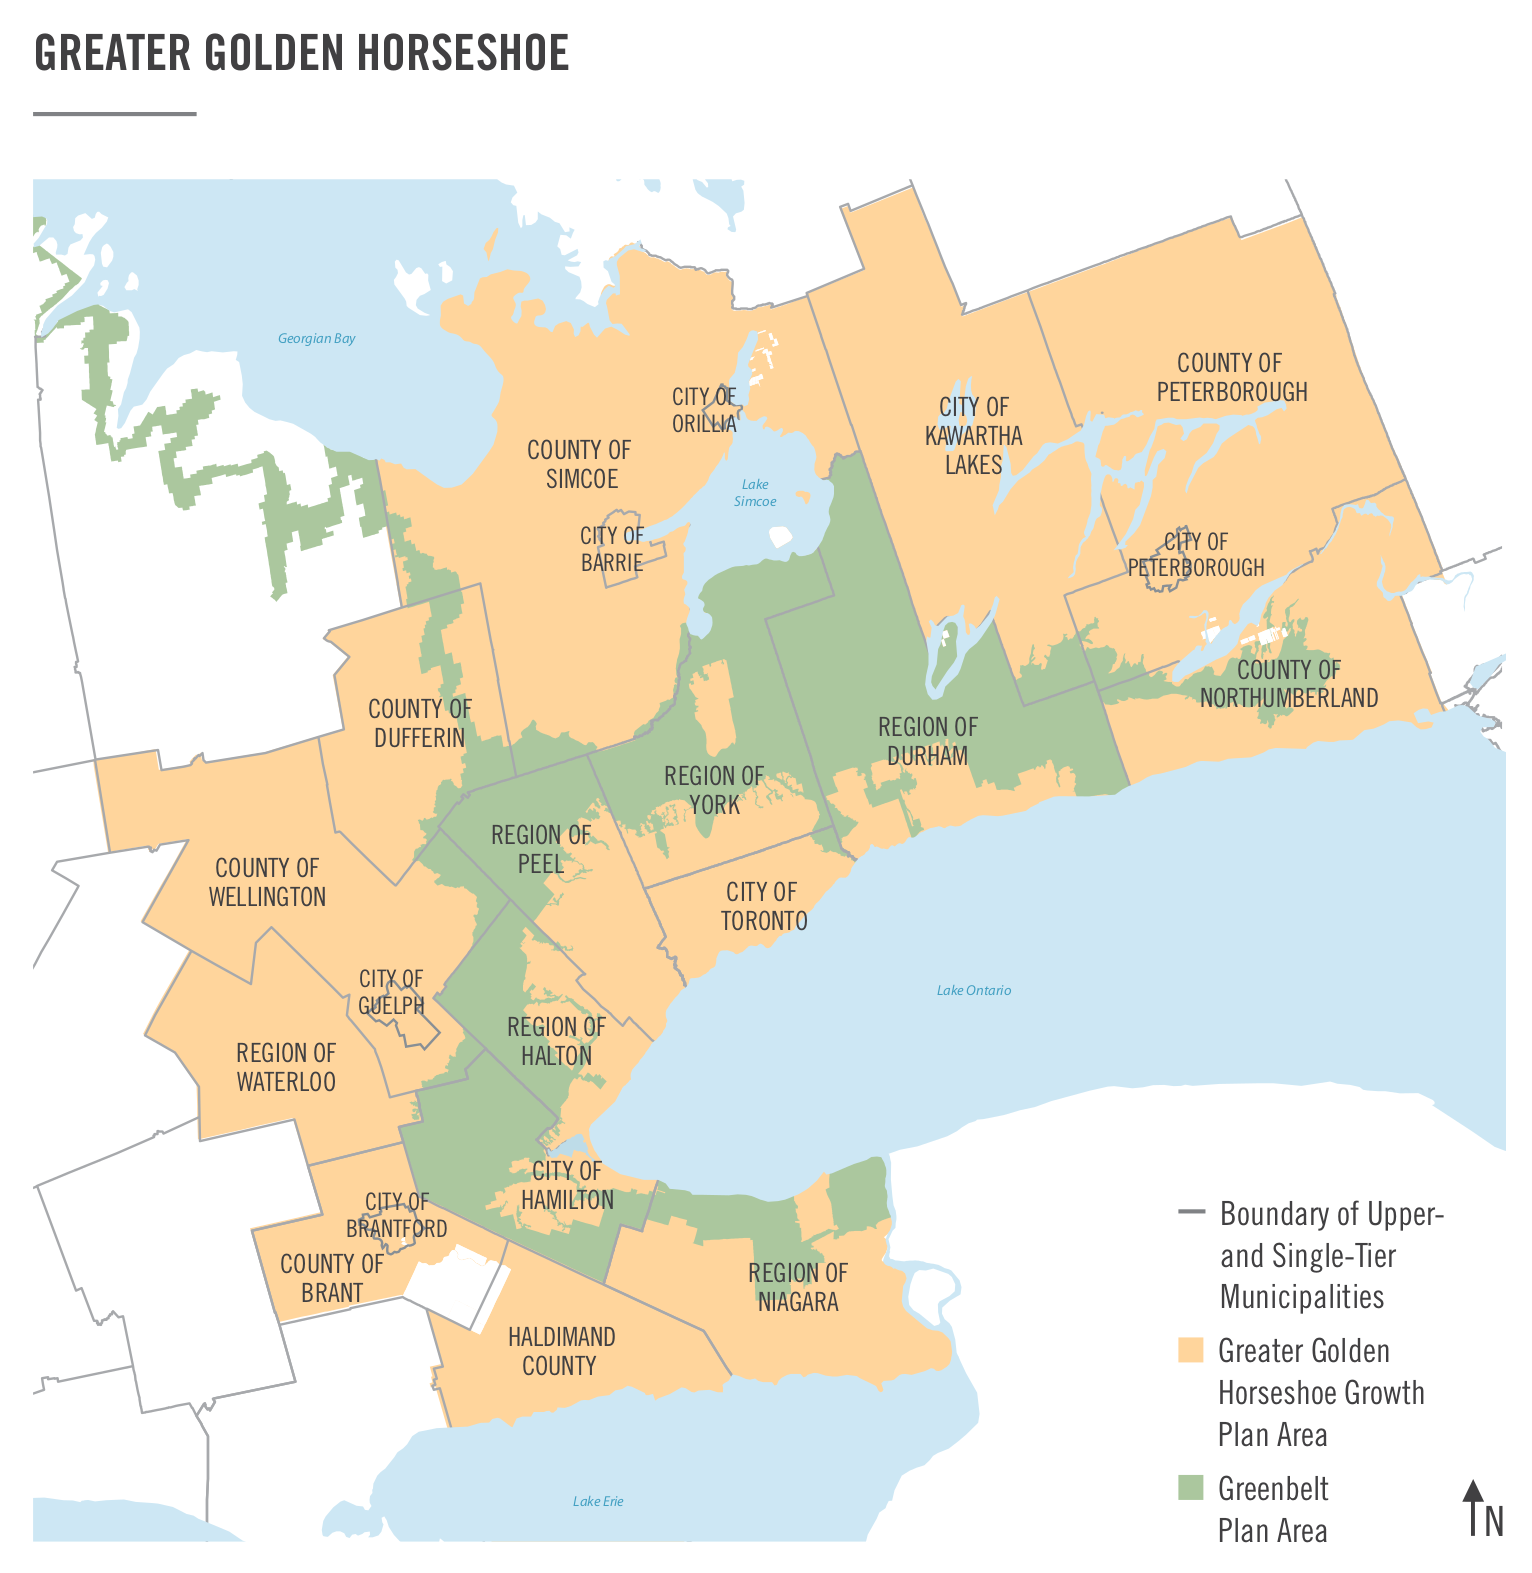
Source: Schedule 1 of the Growth Plan
Planning for growth
The Greater Golden Horseshoe is a dynamic and diverse area and one of the fastest growing regions of North America. The region is critical to the economic success of Ontario and Canada, generating a full two-thirds of the province’s gross domestic product and one-quarter of the nation’s.
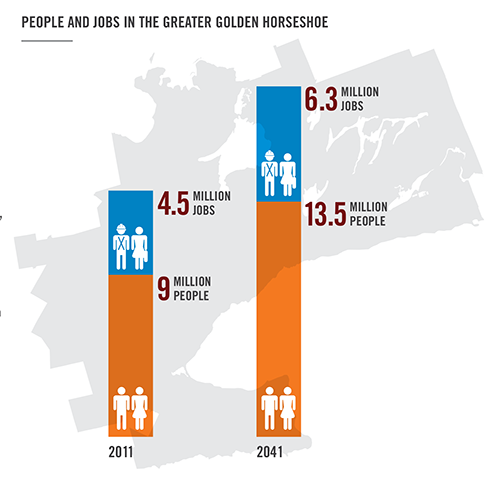
People from across the country and from around the world move to communities in the region every day. At least one in every three new immigrants to Canada settles in the Greater Golden Horseshoe. In 2011, the region was home to approximately 9 million people and 4.5 million jobs. By 2041, the Growth Plan forecasts 13.5 million people and 6.3 million jobs – an increase of 50 per cent and 40 per cent, respectively. With such an increase comes a greater demand for supporting infrastructure, such as transit, roads, sewers and energy, and a full range of community amenities.
Given this tremendous growth, it is critical that we plan for it in a manner that builds on the region’s successes and takes advantage of its many opportunities. If we do not manage strategically and effectively the growth that the region will attract, the area will experience more traffic congestion, more pollution, greater infrastructure challenges, lost farm land and green spaces, and adverse health impacts.
In 2011, the region was home to approximately 9 million people and 4.5 million jobs. By 2041, that is forecast to increase to 13.5 million people and 6.3 million jobs – an increase of 50 per cent and 40 per cent, respectively.
Guiding growth
To respond to the challenges presented by extraordinary population growth and the prospect of accelerating urban sprawl, the Ontario government released the Growth Plan for the Greater Golden Horseshoe in 2006. The Growth Plan guides where and how growth should occur in the region and ensures that communities are planned and built to be sustainable and prosperous. The Growth Plan is an award-winning economic and land use planning initiative that sets a framework for development and environmental protection for 110 municipalities.
Built on an unprecedented consensus across government, the building industry, environmental groups and other key stakeholders, it has established a new standard for future urban form and more complete communities.
The Growth Plan works with other provincial planning initiatives, such as the Provincial Policy Statement, 2014, the Greenbelt Plan, 2005, the Oak Ridges Moraine Conservation Plan, 2002, the Niagara Escarpment Plan and Metrolinx’s Big Move. Smart design led by the policies in the Growth Plan can help us move toward low carbon communities, reduced emissions and improved climate resilience. Ontario has set a target to reduce its emissions to 15 per cent below 1990 levels by 2020 and 80 per cent below by 2050. Together these initiatives set a long-term, strategic approach for guiding growth and development in the region, while supporting and promoting economic prosperity, protecting the environment and helping communities achieve their priorities for their residents.
Just as the Growth Plan works with these other provincial planning initiatives to protect important areas of the Greater Golden Horseshoe while accommodating projected growth, the Growth Plan indicators are intended to be read with the indicators for these other initiatives.
The Growth Plan contains a series of policies and targets and is organized around the following guiding principles:
- Build compact, vibrant and complete communities
- Plan and manage growth to support a strong and competitive economy Protect, conserve, enhance and wisely use the valuable natural resources of land, air and water for current and future generations
- Optimize the use of existing and new infrastructure to support growth in a compact, efficient form
- Provide for different approaches to managing growth that recognize the diversity of communities in the Greater Golden Horseshoe Promote collaboration among all sectors – government, private and non-profit – and residents to achieve the vision.
Measuring progress
The Growth Plan provides policies that municipalities must follow and targets they must achieve by specific future dates.
Section 5.4.3 of the Growth Plan requires the development of a set of indicators to measure implementation of its policies over time. Indicators and their results will also help inform mandated reviews of the Growth Plan.
Some development in the region since the plan was approved in 2006 has been based on approvals received prior to the Growth Plan. Decisions on other development applications in process at the time of the Growth Plan’s approval were transitioned and did not have to conform to the Growth Plan.
As a result, assessment of performance is challenging at this early stage. Therefore, many of the indicators establish a baseline and will be used in the years ahead to assess implementation of the plan’s policies.
Developing the indicators
Determining ways to evaluate public policy and the impacts of any policy initiative accurately is both critically important and inherently complex.
To develop the indicators, staff reviewed national and international best practices, met with experts and stakeholders, and developed a set of evaluation criteria. In addition to measuring the Growth Plan’s targets and policies, indicators were designed to measure outcomes and to be: easily understood; based on credible data sources available across the region; repeated easily; and manageable in scale, scope and cost.
There are challenges in finding data that is consistent and accurate across all 110 municipalities in the Greater Golden Horseshoe. The indicators reflect the data sources that are currently available to the provincial government. The majority of the data comes from five sources: Statistics Canada, the Municipal Property Assessment Corporation (MPAC), Land Information Ontario, the Transportation Tomorrow Survey, and mapping of Growth Plan geographies from municipal official plans.
Additional sources of data will be explored in the future to continually refine and improve the indicators.
An initial set of indicators was proposed in early 2014. The ministry consulted with other ministries, municipalities, stakeholders and other interested individuals on the proposed indicators, and made changes and additions based on those discussions. For example, two new environmental indicators were introduced, other indicators were amended to reflect new data and analysis, and the designated greenfield area density indicator was significantly revised in partnership with a municipal working group.
The 14 indicators are organized around four key themes:
- Building compact and efficient communities
- Creating vibrant and complete communities
- Planning and managing growth to support a strong and competitive economy
- Protecting, conserving, enhancing and wisely using natural resources
Reporting on initial results or baseline data
The indicators in this document are divided into two categories: core indicators and supporting indicators. Early results, or baseline data, are included with the indicators to help explain how they work.
Core indicators are directly linked to specific policies set out in the Growth Plan that have distinct quantifiable goals. The four core indicators relate to the Growth Plan’s:
- residential intensification target,
- urban growth centre density target,
- designated greenfield area density target and
- policies regarding densities of major transit station areas.
The purpose of the core indicators is to track whether growth is occurring as planned in key areas identified in the Growth Plan. supporting indicators help measure progress in relation to the Growth Plan’s more qualitative policies (e.g., the location of major office buildings, planning for a mix of housing), or in relation to the vision and principles embedded in multiple policies throughout the plan (e.g., complete communities). The purpose of the supporting indicators is to track whether the elements and character of urban growth in the region generally reflect the broad policies and vision of the Growth Plan.
Reporting frequency
The ministry proposes to report on the results of the data analysis for these performance indicators every five years, following the release of Census/National Household Survey data. Many of the indicators in this document are based on this data, and it is collected every five years (e.g., 2006, 2011, 2016). In addition, it takes time for land use planning policies and decisions to result in actual change or development “on the ground”, so it is important to allow for a reasonable interval between reporting periods on indicator results. The ministry will continue to explore ways to improve the indicators through methodological changes or new data sources, and will also consider new indicators.
Footnotes
- footnote[1] Back to paragraph Calculated from statistics Canada’s Metropolitan Gross domestic Product, 2014 and Conference Board of Canada’s Metropolitan Outlook 1 & 2, 2014
- footnote[2] Back to paragraph In 2007, the Growth Plan won the Daniel Burnham award (American Planning association), the award for Planning Excellence (Canadian Institute of Planners) and the Leonard Gertler award of distinction (Ontario Professional Planners Institute).