This page was published under a previous government and is available for archival and research purposes.
Air toxics – select VOCs
Volatile organic compounds (VOCs) are organic chemical compounds that may evaporate under normal ambient conditions of temperature and pressure. VOCs are precursors of ground-level ozone and PM2.5. VOCs are emitted into the atmosphere from a variety of emission sources, including vehicles, fossil fuel combustion, steel-making, petroleum refining, fuel-refilling, industrial and residential solvent use, paint application, manufacturing of synthetic materials (e.g. plastics, carpets), food processing, agricultural activities and wood processing and burning. As stated in Section 2.0, transportation sectors accounted for approximately 28% of VOCs and the second largest source was general solvent use accounting for approximately 26%. (Refer to Figure 7 for the estimates of Ontario’s VOCs emissions from point, area and transportation sources).
VOC Monitoring
Specialized, non-routine monitoring and analytical techniques are required to measure VOCs because they are usually present in the atmosphere in a gaseous form at ultra-trace concentrations. VOC samples are collected by automatically drawing ambient air into empty stainless steel canisters over a 24-hour period (midnight to midnight), following the National Air Pollution Surveillance (NAPS) sampling schedule (typically every sixth day) for urban sites. Concentrations for up to 161 selected VOCs are reported for each sample. For the purposes of this report, commonly detected VOCs (benzene, toluene, ethylbenzene, xylene, and 1,3-butadiene) measured at seven AQHI air monitoring stations (Windsor West, Sarnia, London, Kitchener, Hamilton Downtown, Newmarket and Ottawa) between 2007 and 2016 are included in this discussion. Data from these sites are provided by Environment and Climate Change Canada as part of a co-operative federal-provincial program under NAPS and are available online. Annual 2016 statistics for the six select VOCs are presented in Tables A22-A27 of the Appendix.
Benzene, Toluene, Ethylbenzene, Xylene (BTEX)
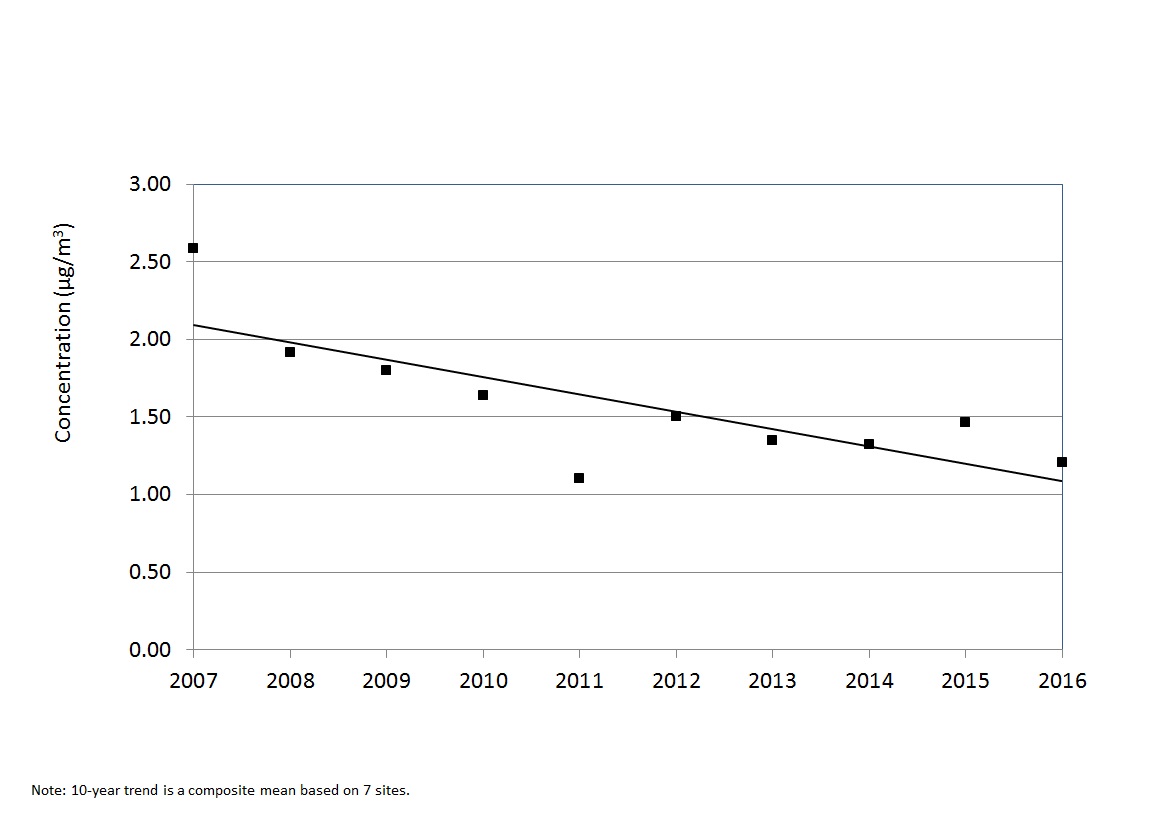
Benzene is a VOC, which is primarily used in the production of plastics and other chemical products. Large quantities of benzene are obtained from petroleum, either by direct extraction from certain types of crude oils or by chemical treatment of gasoline. Benzene is classified as a human carcinogen (USEPA, 2016).
In 2016, benzene annual means ranged from 0.34 µg/m3 at Newmarket to 0.70 µg/m3 in Sarnia. Ontario’s 24-hour AAQC for benzene of 2.3 µg/m3 was only exceeded at the Sarnia AQHI air monitoring station on one occasion. The 24-hour maximum benzene concentration reported at Sarnia was 2.5 µg/m3.
Of the seven monitoring locations, the Ontario annual AAQC for benzene of 0.45 µg/m3 was exceeded at three AQHI air monitoring stations – Windsor West, Sarnia, and Hamilton Downtown. The annual mean for benzene reported at Windsor West, Sarnia and Hamilton Downtown were 0.52 µg/m3, 0.70 µg/m3 and 0.68 µg/m3, respectively. Over the 10-year period from 2007 to 2016, benzene concentrations in Ontario have decreased 28% as shown in Figure 25.
Figure 25: Trend of Benzene Annual Means Across Ontario (2007-2016)
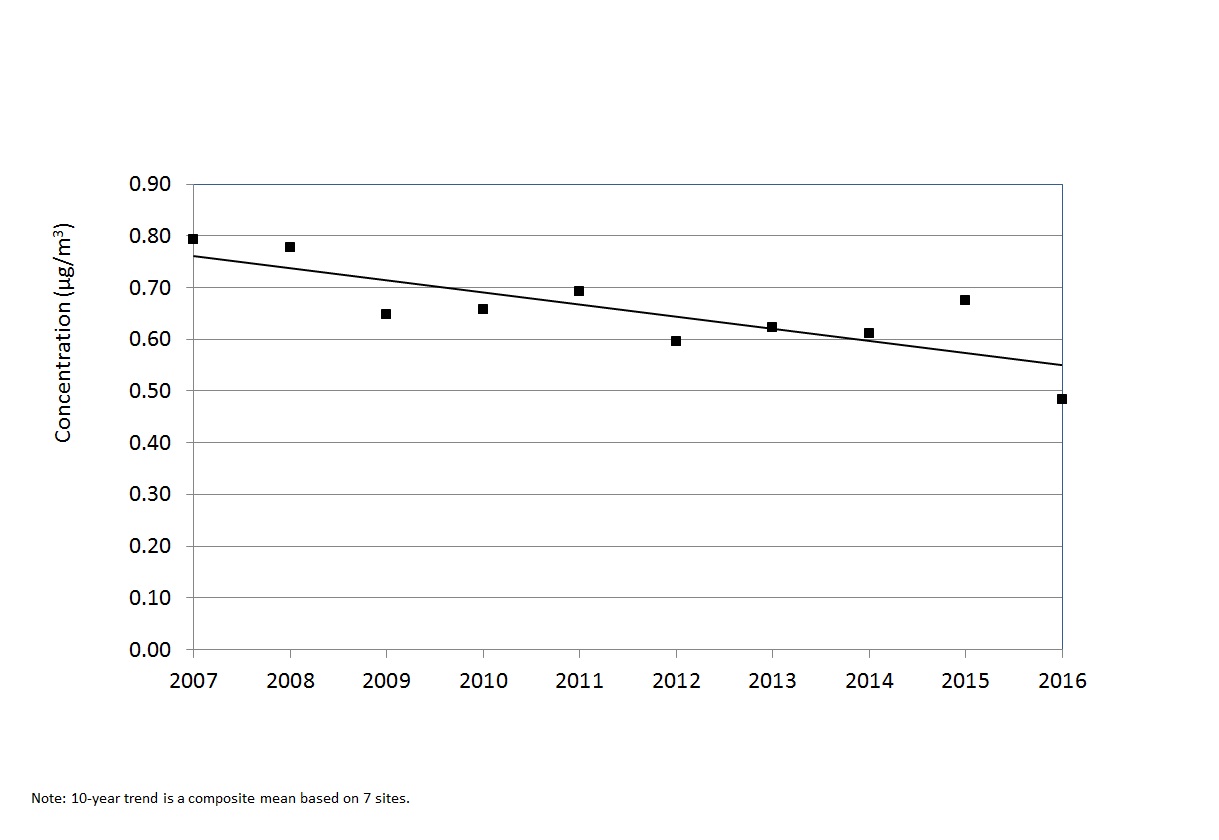
Toluene is a VOC used to make chemicals, explosives, dyes and many other compounds. It is used as a solvent for inks, paints, lacquers, resins, cleaners, glues and adhesives. Toluene is found in gasoline and aviation fuel. Studies reveal that toluene affects the central nervous system of humans and animals; however, there is little evidence to classify it as a carcinogen (USEPA, 2016).
In 2016, the highest 24-hour maximum toluene concentration (12.2 µg/m3) was measured at the Sarnia AQHI air monitoring station. The Ontario 24-hour AAQC for toluene of 2,000 µg/m3 was not exceeded at any of the AQHI air monitoring stations. Toluene annual means ranged from 0.73 µg/m3 at the London AQHI air monitoring station to 1.78 µg/m3 at the Sarnia AQHI air monitoring station. Figure 26 shows a 48% decrease in toluene annual mean concentrations from 2007 to 2016.
Figure 26: Trend of Toluene Annual Means Across Ontario (2007-2016)
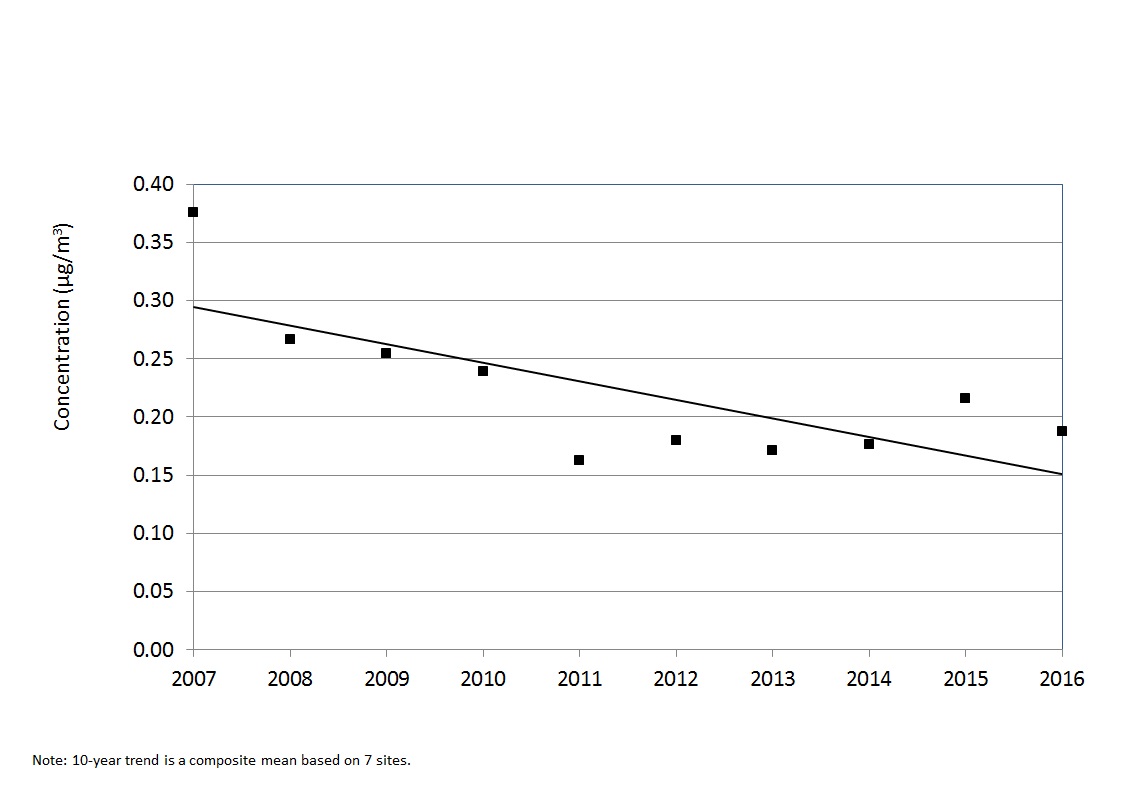
Ethylbenzene, a VOC, is a colourless liquid that smells like gasoline and is mainly used in the manufacture of styrene. Exposure to ethylbenzene occurs from the use of consumer products, fuel, pesticides, solvents, carpet glues, varnishes, paints and tobacco smoke. In humans, acute exposure results in respiratory effects; limited information is available on the carcinogenic effects of ethylbenzene (USEPA, 2016).
In 2016, Sarnia recorded the highest 24-hour maximum ethylbenzene concentration (1.5 µg/m3). The Ontario 24-hour AAQC for ethylbenzene of 1,000 µg/m3 was not exceeded at any of the AQHI air monitoring stations. Ethylbenzene annual means ranged from 0.11 µg/m3 at the London AQHI air monitoring station to 0.28 µg/m3 at the Sarnia AQHI air monitoring station. There has been a 49% decrease in ethylbenzene annual mean concentrations from 2007 to 2016 as shown in Figure 27.
Figure 27: Trend of Ethylbenzene Annual Means Across Ontario (2007-2016)
Xylene, a VOC, is a colourless, sweet-smelling liquid or gas occurring naturally in petroleum, coal and wood tar; it is also used as a solvent in the printing, rubber, paint and leather industries. Xylene, also referred to as mixed xylenes, is a mixture of three isomers: ortho-, meta- and para-xylene, commonly known as o-, m- and p-xylene, which have the same molecular formula but different chemical structure, meaning the arrangement of their atoms are different. There is no information on the carcinogenic effects of mixed xylenes on humans (USEPA, 2016).
In 2016, m- and p-xylene annual means ranged from 0.27 µg/m3 at the London AQHI air monitoring station to 0.64 µg/m3 at the Windsor West AQHI air monitoring station. The annual mean concentrations of o-xylene ranged from 0.11 µg/m3 at London to 0.23 µg/m3 in Windsor West. As shown in Figure 28, there has been a 53% decrease in m- and p-xylene annual mean concentrations from 2007 to 2016. Similarly, in Figure 29, o-xylene annual mean concentrations decreased 43% over the same 10-year period.
Figure 28: Trend of m- and p-xylene Annual Means Across Ontario (2007-2016)
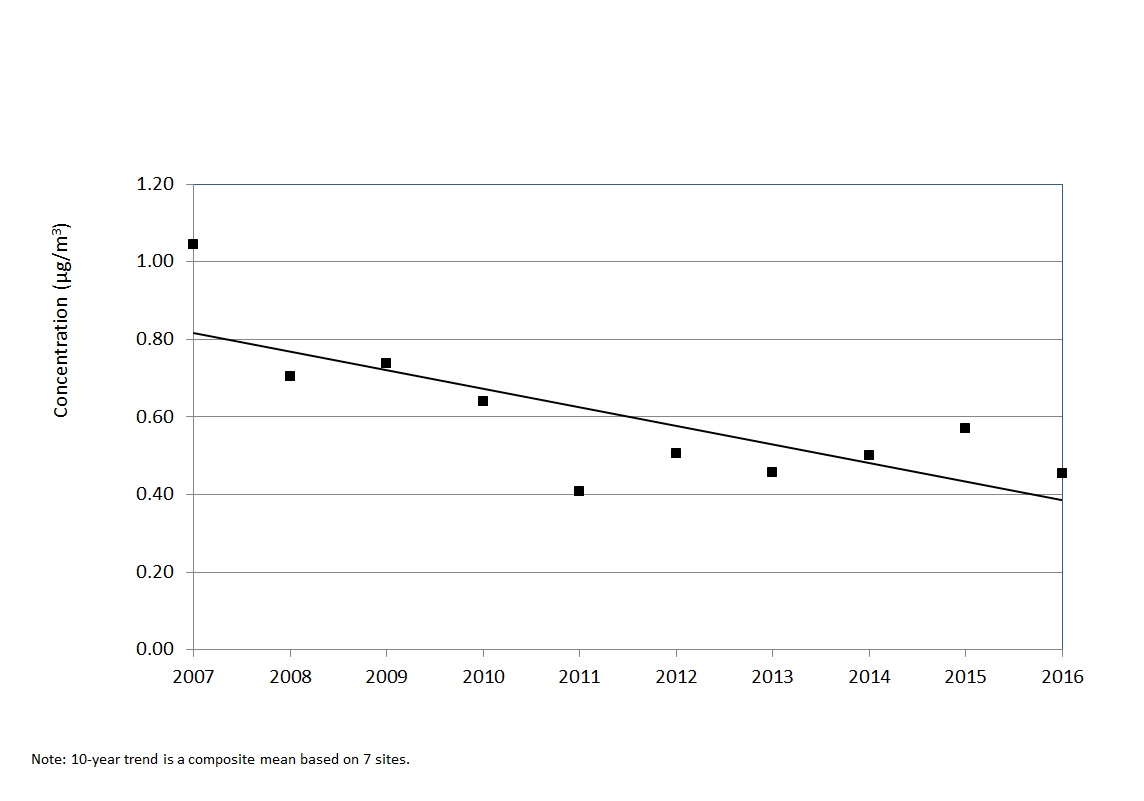
Figure 29: Trend of o-xylene Annual Means Across Ontario (2007-2016)
1,3-Butadiene
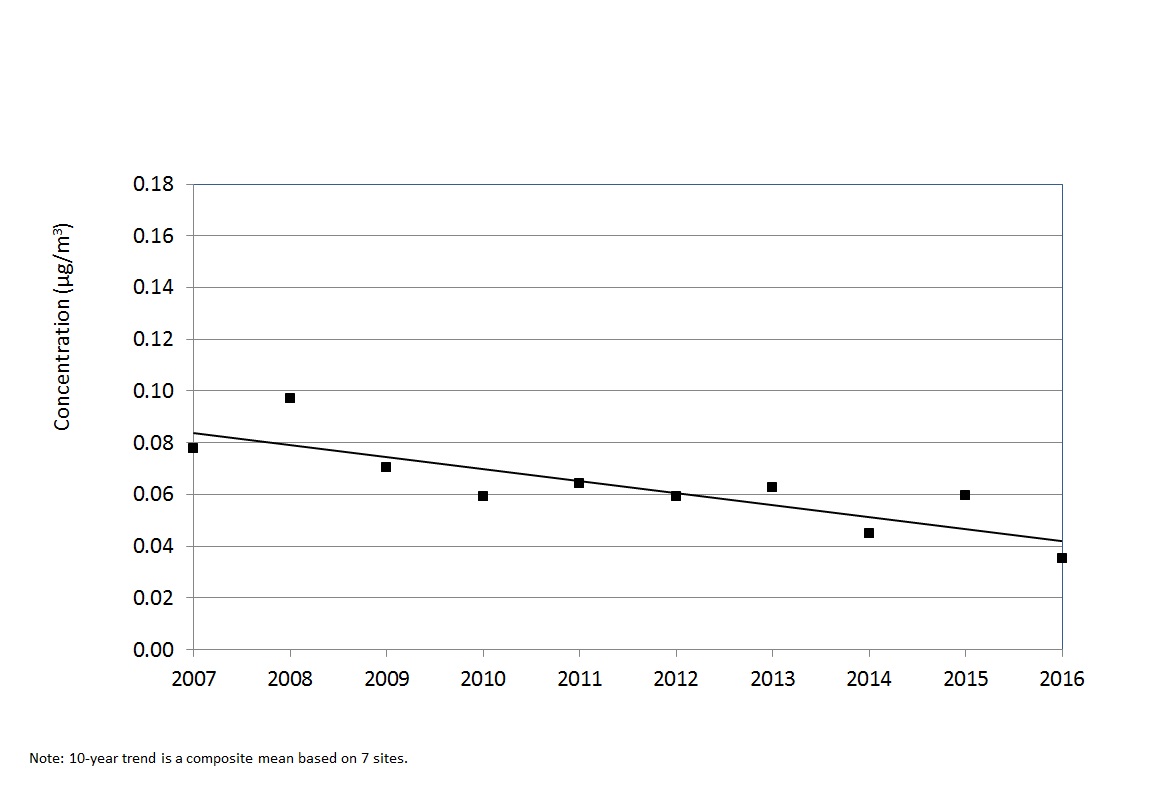
1,3-Butadiene, a VOC, is a colourless gas with a mild gasoline-like odour. It is released into the air through motor vehicle exhaust, manufacturing and processing facilities, forest fires or other combustion, and cigarette smoke. Acute exposure to 1,3-butadiene by inhalation in humans results in irritation of the eyes, nasal passages, throat and lungs; in addition, 1,3-butadiene is carcinogenic in humans by inhalation (USEPA, 2016).
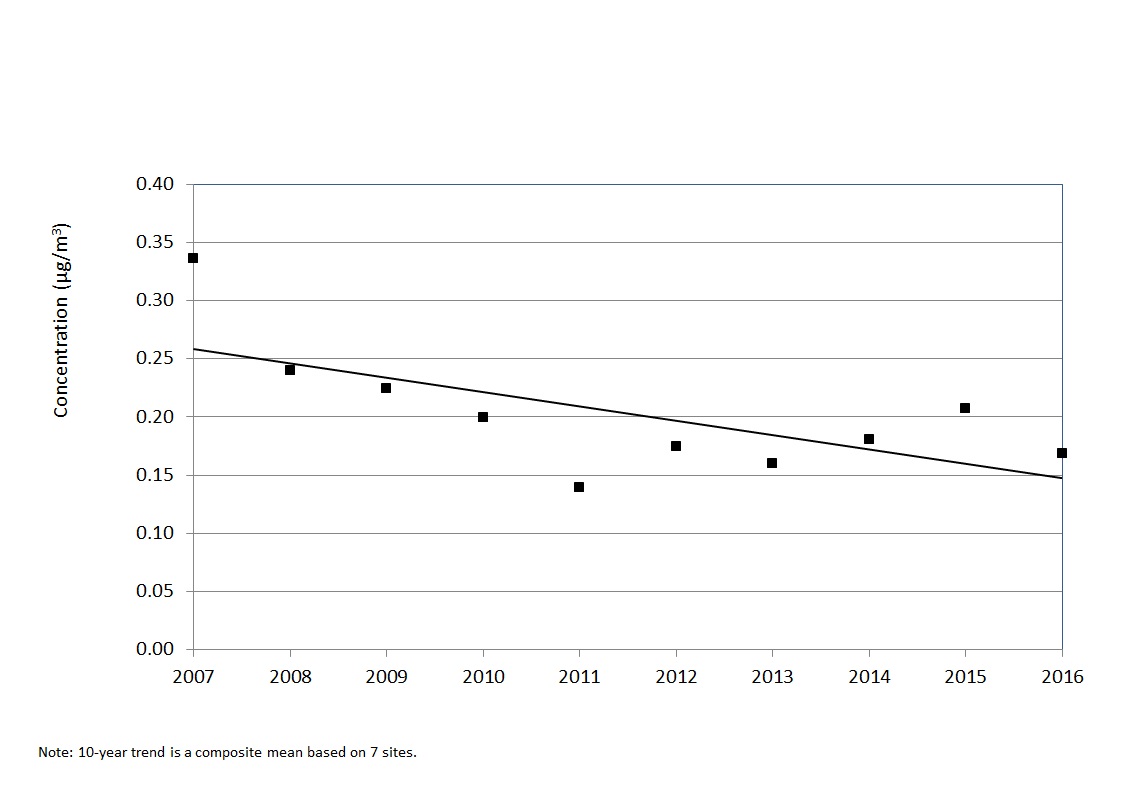
In 2016, 1,3-butadiene annual means ranged from 0.02 µg/m3 reported at two sites – the London and the Newmarket AQHI air monitoring stations – to 0.09 µg/m3 at the Sarnia AQHI air monitoring station. The Ontario annual AAQC for 1,3-butadiene of 2 µg/m3 was met at each of the seven AQHI air monitoring stations. Over the 10-year period, 2007 to 2016, 1,3-butadiene concentrations have decreased 50% as shown in Figure 30.
Figure 30: Trend of 1,3-Butadiene Annual Means Across Ontario (2007-2016)