This page was published under a previous government and is available for archival and research purposes.
Fine particulate matter
Airborne particulate is the general term used to describe a mixture of microscopic solid particles and liquid droplets suspended in air. Particulate matter (PM) includes aerosols, smoke, fumes, dust, fly ash and pollen. Its composition is complex and varies with origin, residence time in the atmosphere, time of year and environmental conditions. Particulate matter is classified according to its size, since different health effects are associated with particles of different diameters. Fine particulate matter, denoted as PM2.5, is less than 2.5 micrometres in diameter, approximately 30 times smaller than the average diameter of a human hair.
Fine particulate matter can have various negative health effects, especially on the respiratory and cardiovascular systems. Particulate matter increases respiratory symptoms, such as irritation of the airways, coughing or difficulty breathing. People with heart or lung disease, children and older adults are particularly sensitive to this pollutant.
Major components of PM2.5 in Ontario are typically nitrates, sulphates, organic matter and particle-bound water. Higher nitrate levels are common in the cooler months whereas sulphates are more elevated during warm temperatures. Fine particulate matter may be emitted directly into the atmosphere as a by-product of fuel combustion or it may be formed indirectly in the atmosphere through a series of complex chemical reactions. Major sources of PM2.5 include motor vehicles, smelters, power plants, industrial facilities, residential fireplaces and wood stoves, agricultural burning and forest fires.
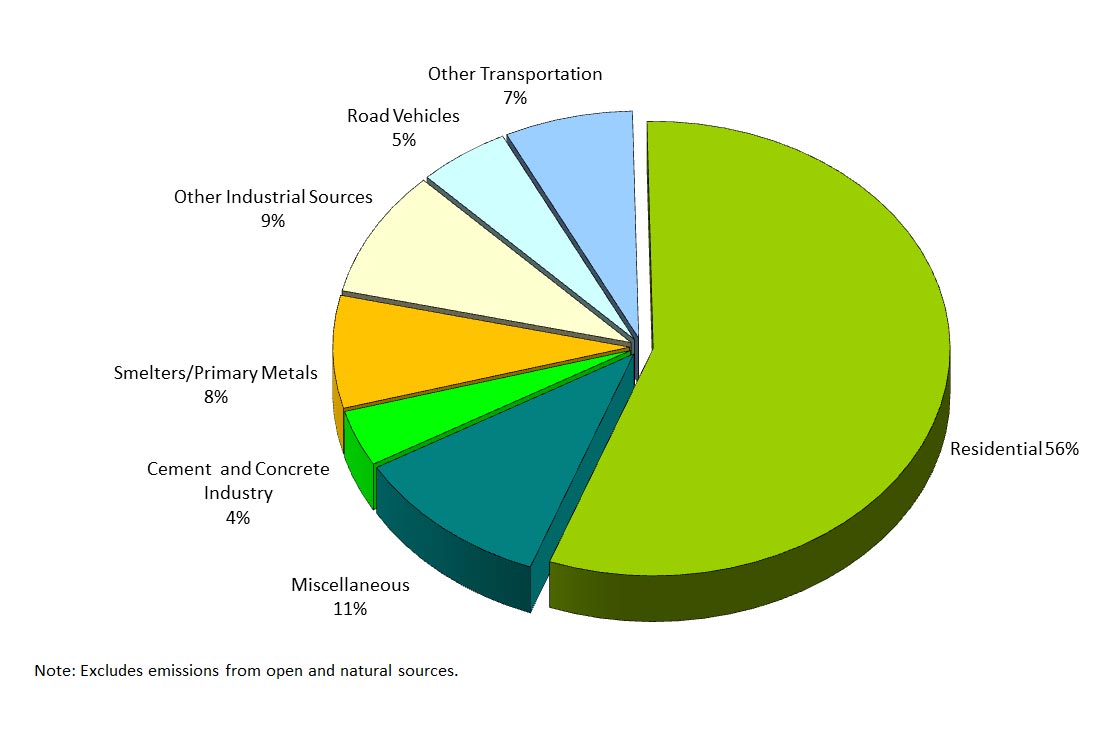
The 2016 estimates for Ontario’s PM2.5 emissions from point, area and transportation sources (excluding emissions from open and natural sources) indicate that residential fuel combustion accounted for 56%, as shown in Figure 4. The major contributor to residential emissions is fuel wood combustion in fireplaces and wood stoves. Industrial processes and transportation sectors accounted for 21% and 12%, respectively (Air Pollutant Emission Inventory 1990-2016, 2016).
Figure 4: Ontario PM2.5 Emissions by Sector
(2016 Estimates for Point/Area/Transportation Sources)
In 2016, 39 AQHI air monitoring stations measured PM2.5; annual mean concentrations ranged from 4.4 µg/m3 in Petawawa to 8.5 µg/m3 in Windsor. The PM2.5 24-hour maximum concentrations ranged from 13 µg/m3 in Thunder Bay to 31 µg/m3 recorded at Cornwall. Only three air monitoring stations measured daily averages above Ontario’s 24-hour PM2.5 reference level of 28 µg/m3: Hamilton Downtown exceeded the PM2.5 reference level on two occasions, and Cornwall and Ottawa Central both exceeded the PM2.5 reference level on only one occasion.
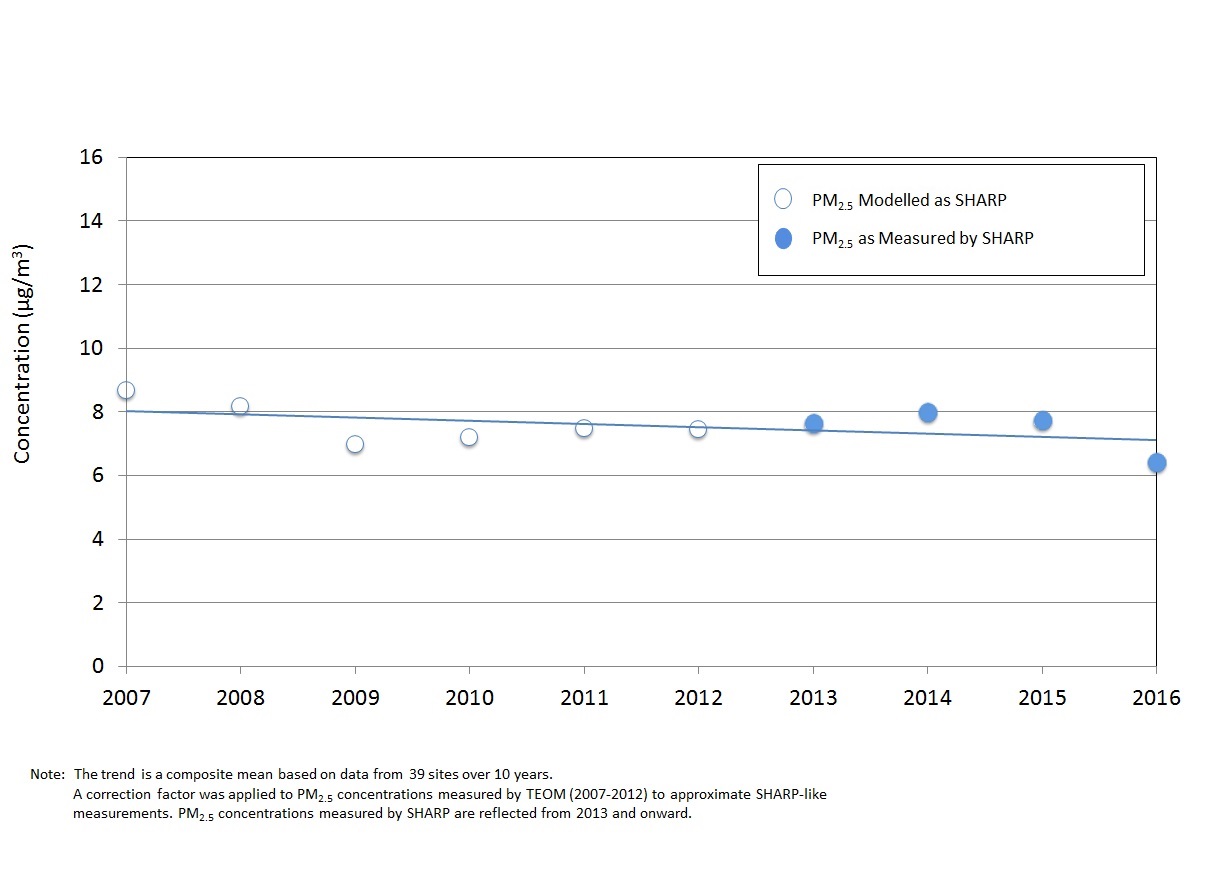
In 2013, as part of a national initiative funded by Environment and Climate Change Canada, Ontario replaced its Tapered Element Oscillating Microbalance (TEOM) monitors with the Synchronized Hybrid Ambient Real-time Particulate (SHARP) instrument across its ambient air monitoring network and started reporting with this new technology. While annual means and maximums are reported for 2016, 10-year trends for the entire ambient air monitoring network cannot be determined since the 2013 to 2016 PM2.5 dataset is not directly comparable to data collected using the older technology. It is however possible to apply an approximate correction factor to the TEOM data to generate an approximate 10-year trend. Applying the approximate correction factor to the TEOM data shows a 12% decrease in PM2.5, from 2007 to 2016 as shown in Figure 5.
Figure 5: Trend of PM2.5 Annual Means Across Ontario (2007-2016)
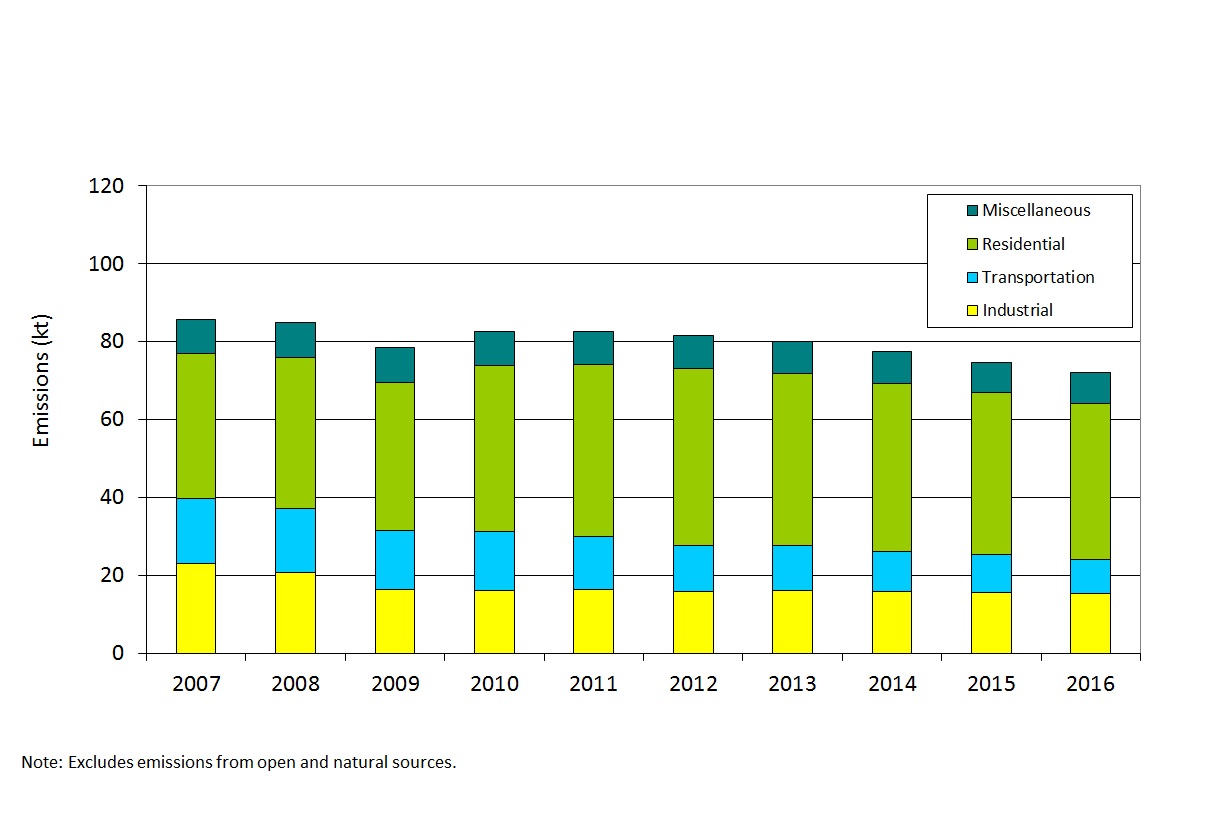
Provincial PM2.5 emissions have decreased approximately 16% from 2007 to 2016 as shown in Figure 6. Fine particulate matter emissions from electric utilities and industrial processes have been reduced approximately 33% during this period. Emissions from the transportation sector decreased 48% with the phase-in of new vehicles/engines having more stringent emission standards over the same period (Air Pollutant Emission Inventory 1990-2016, 2016).
Figure 6: Ontario PM2.5 Emission Trend (2007-2016)