This page was published under a previous government and is available for archival and research purposes.
Ground-level ozone
Ground-level ozone is a gas formed when NOx and VOCs react in the presence of sunlight. Nitrogen oxides are comprised of NO2 and nitric oxide (NO). Nitric oxide reacts quickly with ground-level ozone to form NO2 (known as scavenging). Nitrogen dioxide efficiently absorbs sunlight in summer and then breaks down to generate oxygen atoms (O) and NO. These oxygen atoms then react rapidly with molecular oxygen (O2) to produce ground-level ozone. These series of reactions, however, experience interference with other chemicals, such as VOCs. Ground-level ozone increases when VOCs are present and react with NO reducing the scavenging effect.
Ozone is a colourless, odourless gas at typical ambient concentrations, and is a major component of smog. The formation and transport of ozone is strongly dependent on weather conditions and emissions of chemicals that contribute to the formation of ozone, such as NOx and VOCs. Changing weather patterns contribute to differences in ozone concentrations hour-to-hour, day-to-day, season-to-season, and year-to-year. In Ontario, the highest concentrations of ground-level ozone are typically recorded on hot and sunny days mainly from May to September, between noon and early evening.
Ozone irritates the respiratory tract and eyes. Exposure to ozone in sensitive people can result in chest tightness, coughing and wheezing. Children who are active outdoors during the summer, when ozone levels are highest, are particularly at risk. Individuals with pre-existing respiratory disorders, such as asthma and chronic obstructive pulmonary disease (COPD), are also at risk. Ozone is associated with increased hospital admissions and premature deaths. Ozone may also be harmful to vegetation causing losses in agricultural crops each year in Ontario, with visible leaf damage in many crops, garden plants and trees, especially during the summer months. While ozone at ground level is a significant environmental and health concern, the naturally occurring ozone in the stratosphere, 10 to 40 kilometres (km)above the earth’s surface, is beneficial as it shields the earth from harmful ultraviolet radiation.
Figure 7: Ontario VOCs Emissions by Sector
(2016 Estimates for Point/Area/Transportation Sources)

Figure 7 shows the 2016 estimates of Ontario’s VOCs emissions from point, area and transportation sources. The transportation sectors accounted for approximately 28% of VOCs and the second largest source was general solvent use, accounting for approximately 26%. (Air Pollutant Emission Inventory 1990-2016, 2016).
In 2016, ozone was monitored at the ministry’s 39 AQHI air monitoring stations. The highest annual mean was 33.1 parts per billion (ppb), measured at Tiverton, a transboundary-influenced site on the eastern shore of Lake Huron. The lowest annual mean, 22.1 ppb, was measured at Toronto West, an urban site located near a major transportation corridor, Highway 401, and directly impacted by local NO emissions from vehicles. Generally, ozone concentrations are lower in urban areas because ozone is depleted by reacting with NO emitted by vehicles and other local combustion sources.
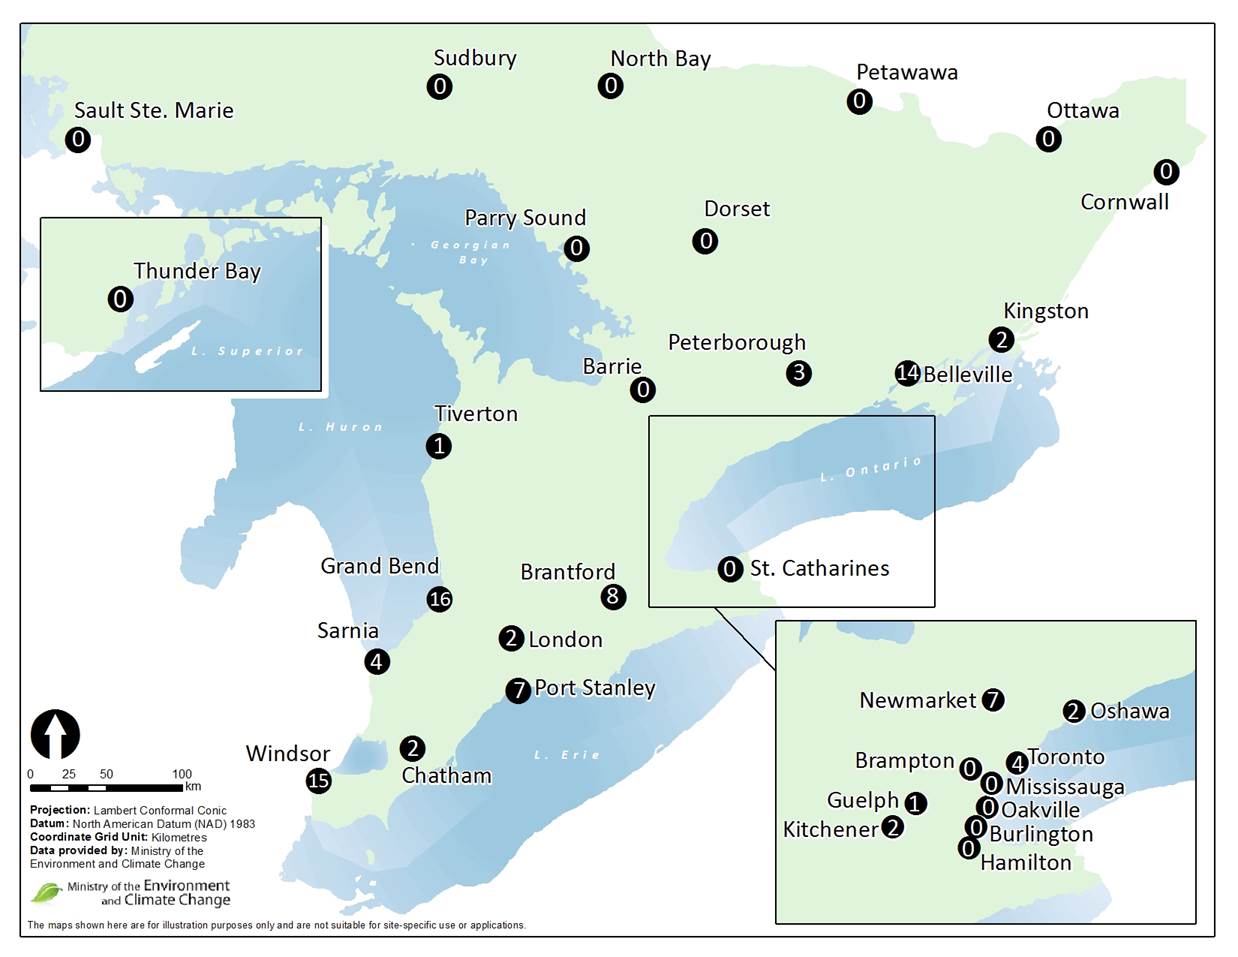
The maximum one-hour ozone concentrations ranged from 62 ppb recorded in Thunder Bay, to 99 ppb recorded in Toronto East. In 2016, 19 air monitoring sites situated in 16 locations across the province measured ozone levels above Ontario’s one-hour AAQC of 80 ppb for at least one hour as shown in Figure 8. Ontario’s one-hour AAQC for ozone was exceeded the most often at Grand Bend on 16 occasions.
The ozone exceedances reported in southwestern Ontario, on the eastern shore of Lake Huron and on the northern shore of Lake Erie, typically result from transboundary flow of pollutants. As stated in the Ministry’s 2005 Transboundary Air Pollution in Ontario report, elevated ozone levels in southwestern Ontario are generally attributed to the long-range transport of pollutants from the United States (Yap et al, 2005).
Figure 8: Geographical Distribution of the Number of Hours Above the 1-Hour Ozone AAQC Across Ontario in 2016
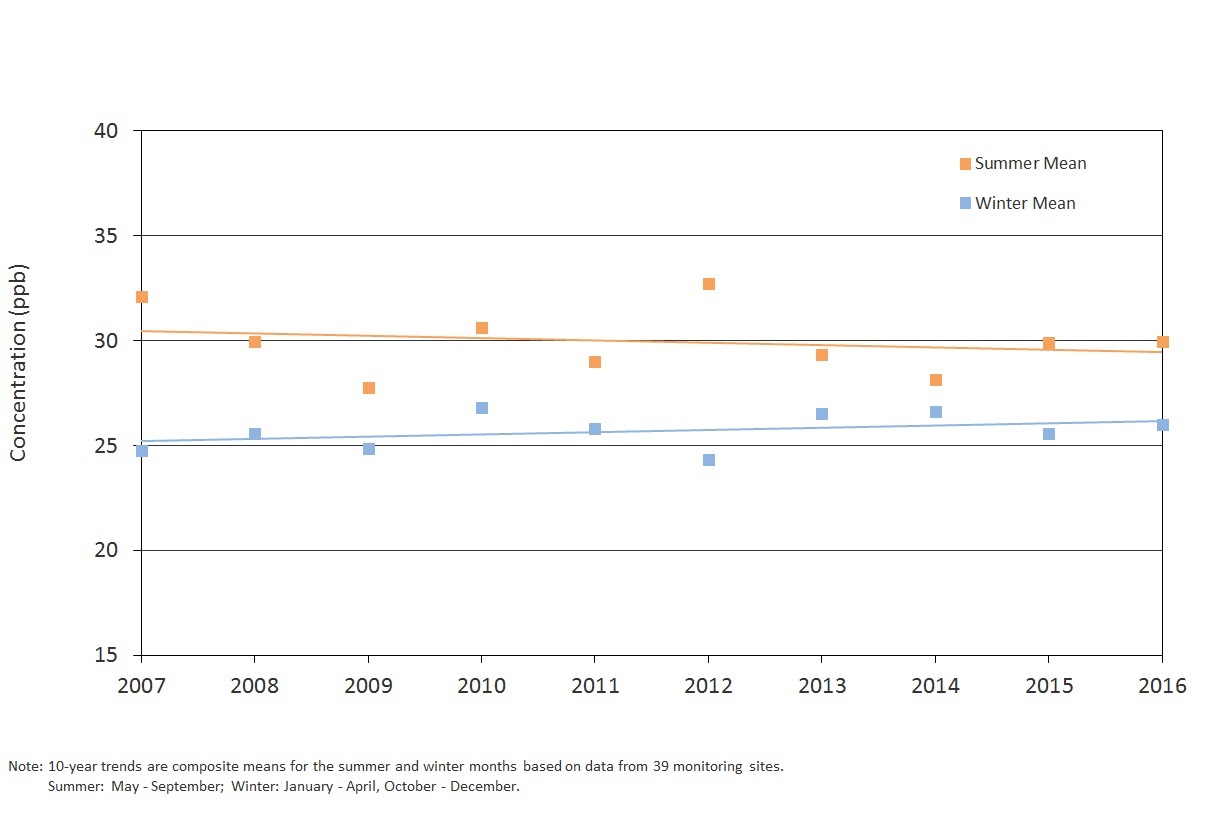
The ozone annual means presented in Figure 9 show an increasing trend of 1% for the 10-year period from 2007 to 2016. The trend for ozone summer means and ozone winter means are shown in Figure 10. The ozone summer means trend decreased by 3% from 2007 to 2016, whereas the ozone winter means have increased by 4% over the same 10-year period. The decrease in summer means over the past 10 years is largely due to the progressive reductions of NOx emissions in Ontario and the U.S. resulting in the decrease in local ozone formation and transboundary influences especially during the summer months. Summer ozone, however, continues to exceed the Ontario AAQC during the warmer months and remains a challenge in areas of the province. The increases in the ozone winter means are mainly attributed to the rising global background concentrations (Reid et al, 2008) and reduced scavenging effect. Industrial activities in Europe, the U.S. and rapidly growing Asia contribute to this global background (Reid et al, 2008; Parrish et al, 2012). In general, even with the increase in ozone winter means, ozone concentrations during the winter months continue to remain well below the Ontario AAQC of 80 ppb.
Figure 9: Trend of Ozone Annual Means Across Ontario (2007-2016)
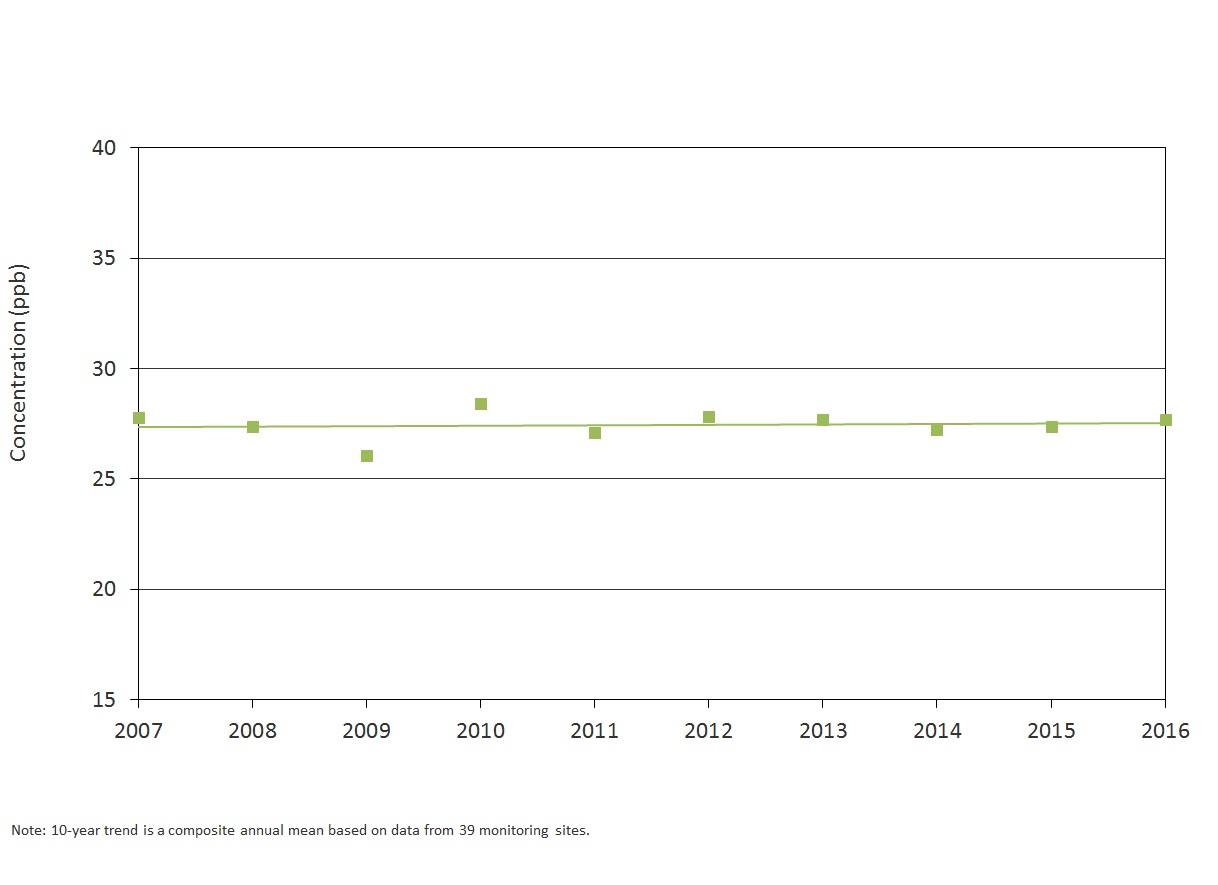
Figure 10: Trend of Ozone Summer and Winter Means Across Ontario (2007-2016)
Comparison of Smog Episodes with Similar Meteorological Conditions – 2005 vs. 2016
Smog is a contraction of smoke and fog, and includes ground-level ozone, PM2.5 and other pollutants. In Ontario, the traditional summer smog season is defined as the period between May and September, and usually driven by ground-level ozone and PM2.5. Elevated levels of ozone and PM2.5 are typically due to regional weather patterns that affect the lower Great Lakes region. Such weather patterns are invariably associated with slow moving high pressure cells across the region and result in the long-range transport of smog pollutants from neighbouring U.S. industrial and urbanized states during warm south to southwesterly air flow conditions.
Smog episodes are highly dependent on meteorological conditions which vary from year to year. The summers in 2005 and 2016 both recorded warmer than normal temperatures combined with southwesterly air flows – ideal weather conditions for smog episodes to occur. During smog season, Ontario recorded 30 and 25 hot days (a hot day is a day where the maximum temperature recorded is greater than 30°C) in 2005 and 2016, respectively. Meteorological observations were similar for the summers of 2005 and 2016; however, there are noticeable differences in the general characteristics of smog events between these two years.
Smog episodes in the summer of 2005 were frequent, commonly multi-day events that were dominated by elevated concentrations of ozone and PM2.5. In 2016, the summer smog events were less frequent, shorter, less intense and only subject to ozone. The time of day at which elevated ozone concentrations occurred also differed between the two years. For instance, in 2005, elevated ozone concentrations would emerge in the early afternoon and last longer, whereas in 2016, elevated ozone concentrations materialized in late afternoon for only short time periods.
The number of exceedances of Ontario’s Ambient Air Quality Criteria (AAQC) for ozone occurred more often in 2005. Port Stanley recorded the most instances (172) above the Ontario AAQC in 2005; 166 of those instances occurred between May to September 2005. In the summer of 2016, Grand Bend recorded the most instances (16) above the Ontario AAQC. Due to the absence of elevated PM2.5 concentrations in the summer of 2016, this section compares select ozone events in the summers of 2005 and 2016 when meteorological conditions were similar.
Case Study 1: June 7-14, 2005 vs. June 18-20, 2016
The ozone events of June 7-14, 2005 and June 18-20, 2016 shared a very similar meteorological pattern. A high pressure ridge moved eastward over southern Ontario followed by a low pressure trough that moved over northern Ontario causing sunny skies and winds over southern Ontario from the southwest with increasing temperatures. These weather conditions are ideal for elevated ozone concentrations; however, the ozone levels observed in the 2005 episode were more intense and widespread when compared to the 2016 episode. The event in 2005 persisted for eight days driven by elevated ozone levels as well as PM2.5 concentrations, whereas the event in 2016 lasted only three days due only to elevated ozone.
Figure 11: Daily Pattern of Ozone at Grand Bend
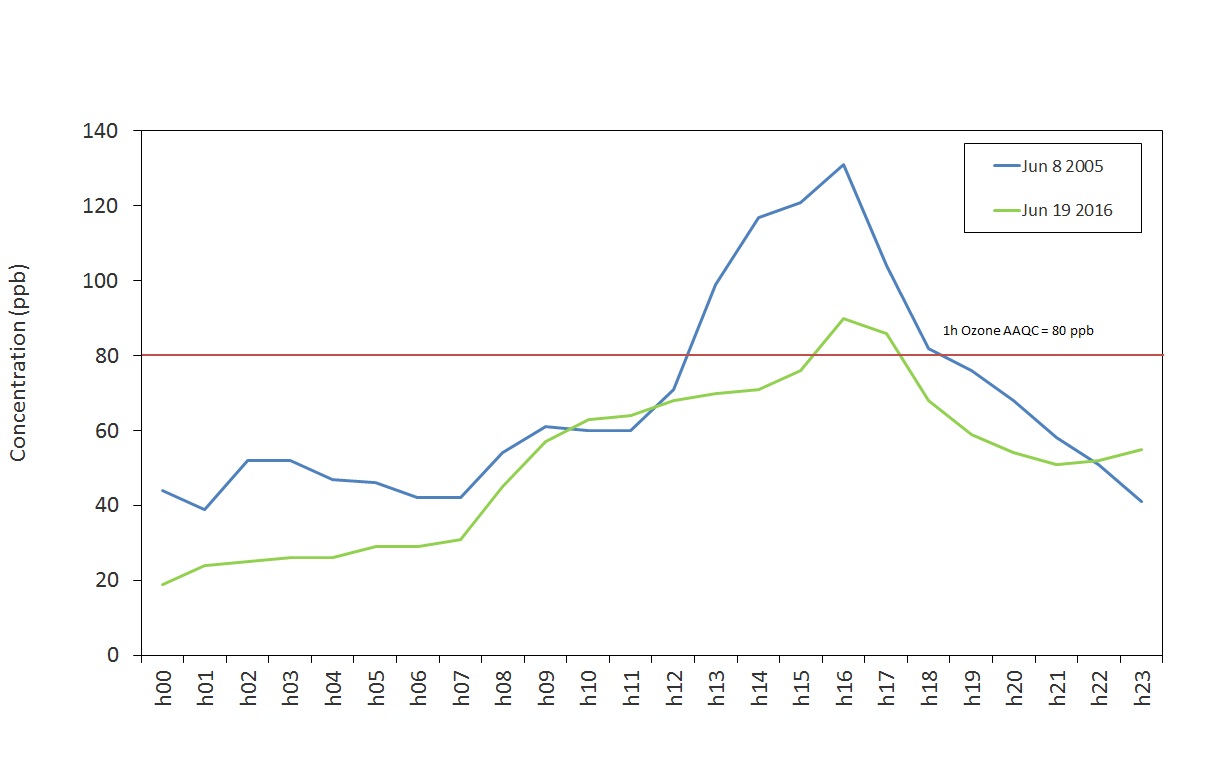
Figure 12: Hourly Temperatures at Grand Bend
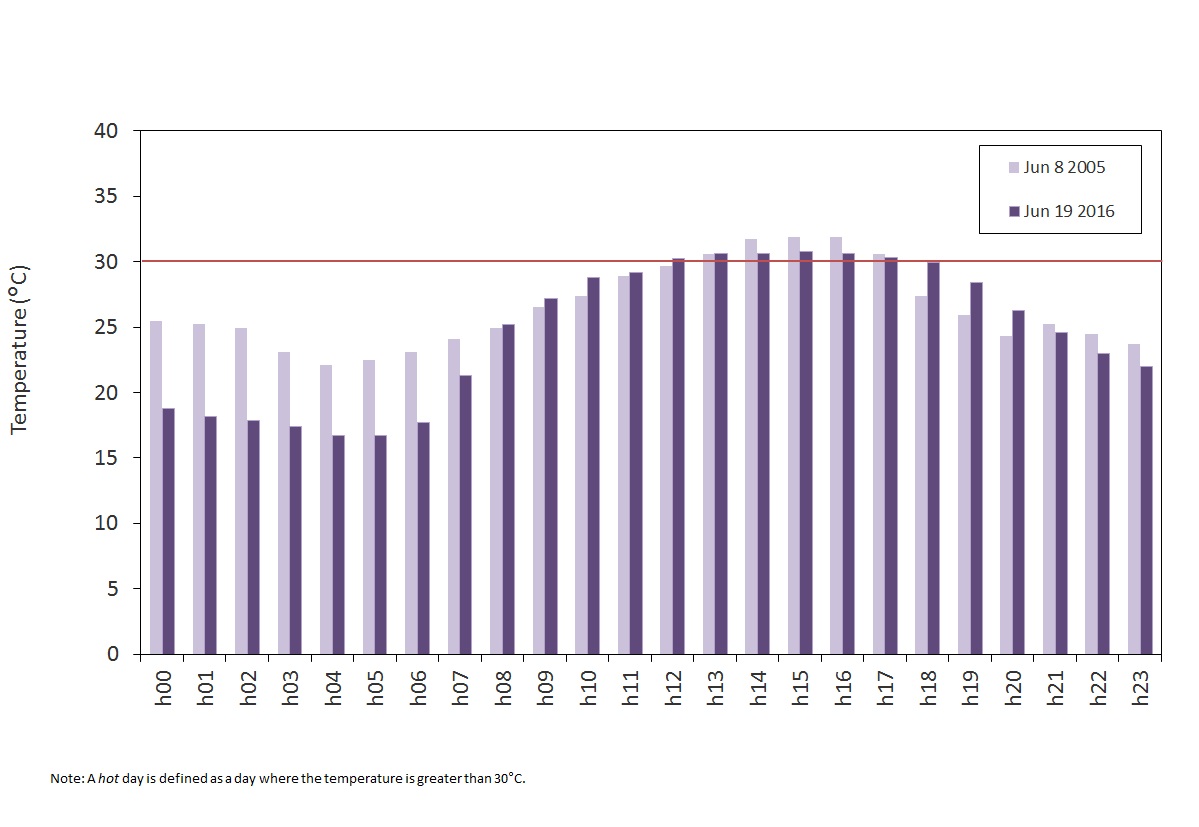
Twenty-five air monitoring stations exceeded Ontario’s one-hour AAQC on at least one occasion during the June 7-14, 2005 event; while only five air monitoring stations exceeded the AAQC for ozone from June 18-20, 2016. The highest one-hour ozone concentration recorded during each of the two events was 131 ppb measured at Grand Bend and 99 ppb measured in Toronto for June 7-14, 2005 and June 18-20, 2016, respectively. The daily patterns for the ozone maximum concentrations recorded at Grand Bend are shown in Figure 11 for June 8, 2005 and June 19, 2016 - the second day of both episodes. This figure highlights the differences in the ozone peak levels starting in the afternoon hours.
On June 8, 2005, ozone at Grand Bend reached 131 ppb and exceeded the Ontario AAQC for six consecutive hours; on June 19, 2016, ozone climbed to 90 ppb and was in exceedance of the Ontario AAQC for only two hours. Typically, ozone is at its highest between noon and early evening and that is evident in the daily pattern. Even though the ozone maximums both occurred at 4 p.m., it took more time for ozone to develop on June 19, 2016. As shown in Figure 12, temperatures exceeded 30°C for both events, yet the duration of elevated ozone and peak concentrations were more intense in 2005.
Case Study 2: June 24-29, 2005 vs. August 10-11, 2016
The ozone events of June 24-29, 2005 and August 10-11, 2016 shared a very similar meteorological pattern. A high pressure ridge over the northeastern U.S. and southern Ontario followed by a low pressure trough over northern Ontario, resulted in southwesterly winds and a flow of very warm and humid air across southern Ontario. The June 24-29, 2005 episode was persistent and widespread across the province, while the August 10-11, 2016 episode was brief and occasional. The one-hour ozone maximum concentrations recorded during the 2005 and 2016 episodes in Case Study 2 are displayed in Figure 13. The one-hour ozone maximums recorded in 2005 were significantly higher than those recorded in 2016. The highest one-hour ozone concentration was 125 ppb at Grand Bend during the 2005 episode and 96 ppb at Belleville during the 2016 episode.
Figure 13: Geographical Distribution of One-Hour Ozone Maximums Recorded Across Ontario During Two Episodes (June 24-29, 2005 and August 10-11, 2016)
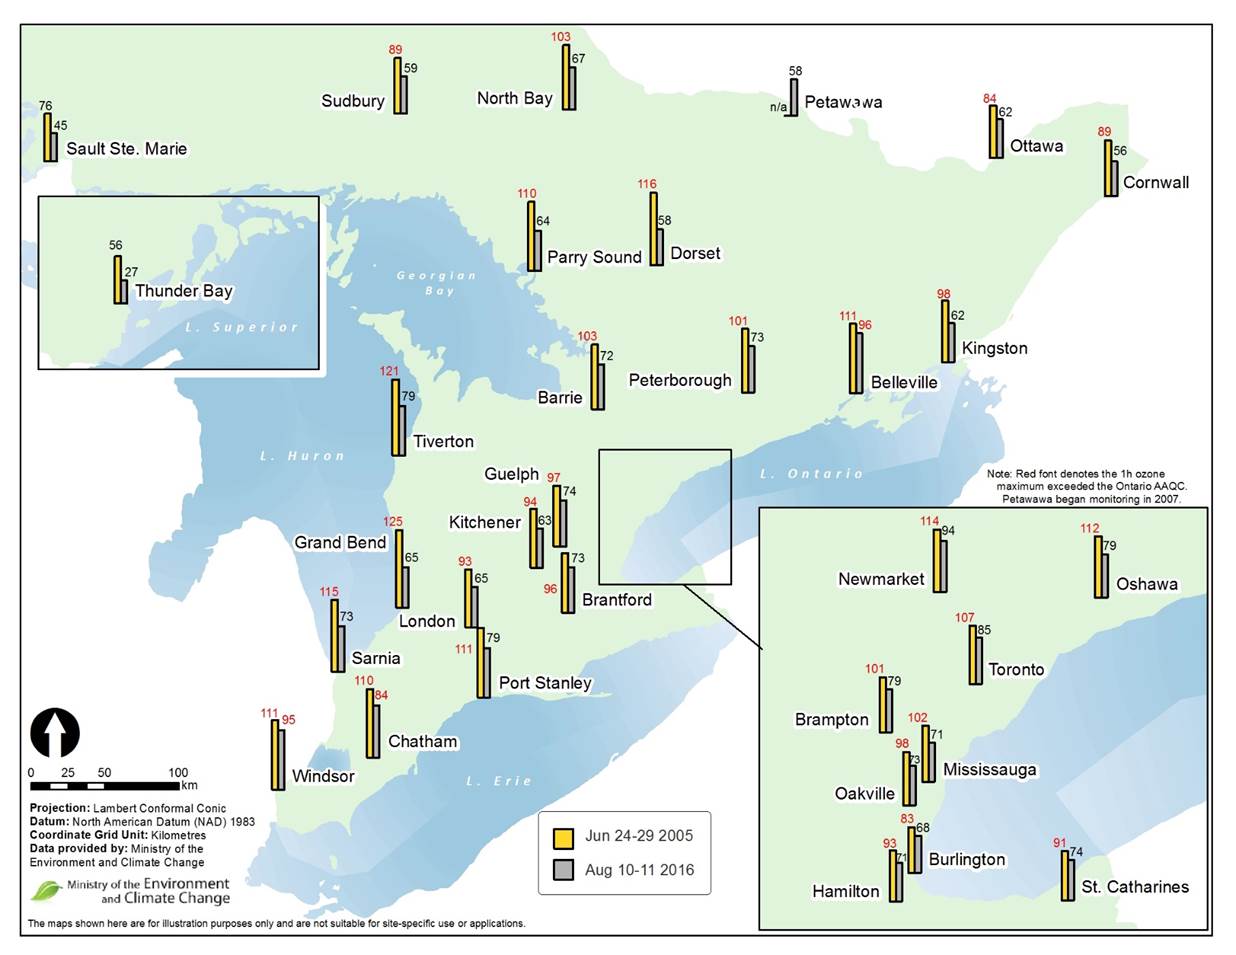
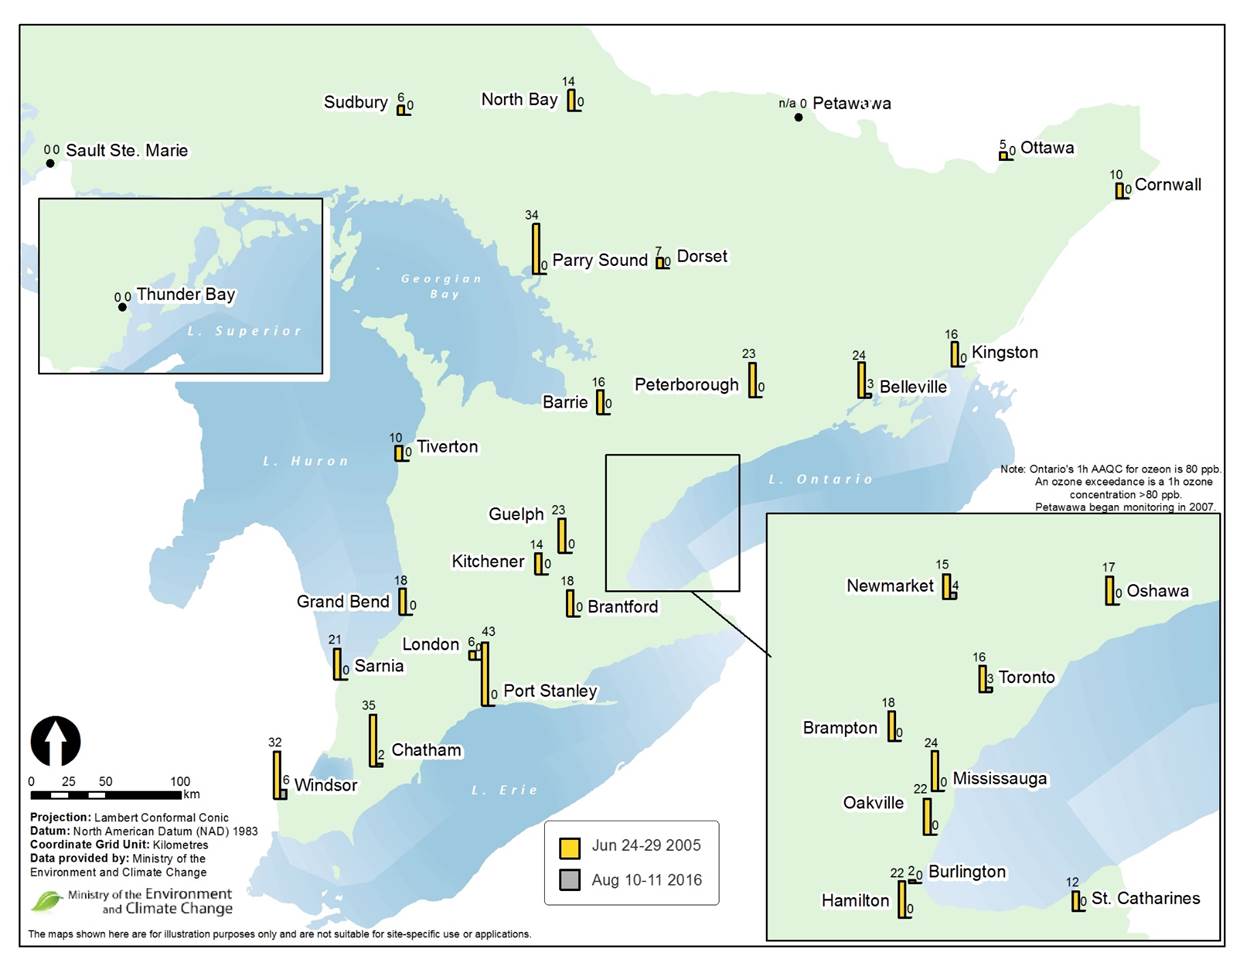
Figure 14 displays the geographical distribution of one-hour ozone exceedances for the duration of the ozone events in Case Study 2. With the exception of Sault Ste. Marie and Thunder Bay, Ontario’s AAQC was exceeded at all air monitoring locations across the province during the 2005 episode showing that elevated ozone was widespread. Over the two-day episode in 2016, only five air monitoring stations exceeded the ozone AAQC during this time.
Figure 14: Geographical Distribution of One-Hour Ozone Exceedances Across Ontario During Two Episodes (June 24-29, 2005 and August 10-11, 2016)
In summary, the 2005 and 2016 episodes, illustrated in Case Studies 1 and 2, shared very similar meteorological patterns, and experienced weather conditions conducive to ozone formation as southwesterly flows of warm air travelled across southern Ontario. Ozone episodes were short-lived and less widespread with lower maximums in 2016 - an obvious contrast to the observations in 2005, thus implying that the formation of ozone has decreased over time. The similarity in meteorological conditions between the episodes in the two case studies suggests that the reduction in emissions of ozone precursors (nitrogen oxides and volatile organic compounds) over the past 10 years in Ontario and the U.S. has contributed to the substantial decrease in ozone concentrations. However, additional analyses of the 2005 and 2016 data are needed to better understand the differences in smog formation between these two time periods.