This page was published under a previous government and is available for archival and research purposes.
Nitrogen dioxide
Nitrogen dioxide is a reddish-brown gas with a pungent odour, which transforms in the atmosphere to form gaseous nitric acid and nitrates. It plays a major role in atmospheric reactions that produce ground-level ozone, a major component of smog. Nitrogen dioxide also reacts in the air and contributes to the formation of PM2.5 (Seinfeld and Pandis, 2006). All combustion in air produces nitrogen oxides (NOx), of which NO2 is a component. Major sources of NOx emissions include the transportation sector, industrial processes and utilities.
Nitrogen dioxide can irritate the lungs and lower resistance to respiratory infection. People with asthma and bronchitis have increased sensitivity to NO2. Nitrogen dioxide chemically transforms into nitric acid in the atmosphere and, when deposited, contributes to the acidification of lakes and soils in Ontario. Nitric acid can also corrode metals, fade fabrics, degrade rubber, and damage trees and crops.
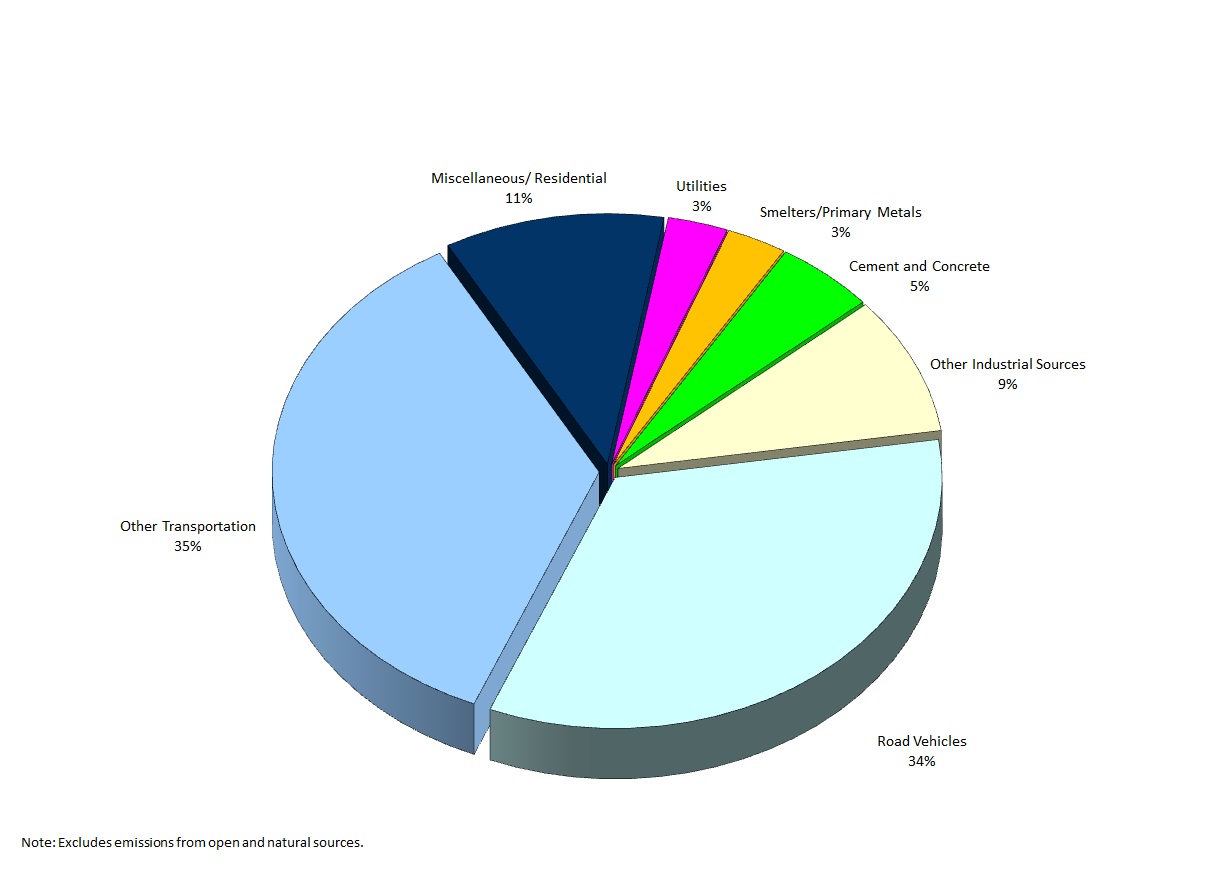
Figure 1 shows the estimates for Ontario’s NOx emissions from point, area and transportation sources. The transportation sectors accounted for approximately 69% of NOx emissions (Air Pollutant Emission Inventory 1990-2016, 2016).
Figure 1: Ontario Nitrogen Oxides Emissions by Sector
(2016 Estimates for Point/Area/Transportation Sources)
There were no exceedances of the provincial one-hour and 24-hour AAQC for NO2, 200 ppb and 100 ppb, respectively, at any of the 39 AQHI air monitoring stations in Ontario during 2016. The Toronto West air monitoring station, located in an area of Toronto influenced by significant vehicular traffic, recorded the highest NO2 annual mean (15.7 ppb) during 2016; whereas Tiverton, a rural site, recorded the lowest NO2 annual mean (1.8 ppb). The highest NO2 means were recorded in large urbanized areas, such as the Greater Toronto Area of southern Ontario. The Toronto East station recorded the highest one-hour NO2 concentration (68 ppb), and Toronto West recorded the highest 24-hour NO2 concentration (41 ppb).
The NO2 annual mean concentrations across Ontario have decreased 30% from 2007 to 2016, as displayed in Figure 2. The NOx emission trend from 2007 to 2016 indicates a decrease of approximately 38% as shown in Figure 3 (Air Pollutant Emission Inventory 1990-2016, 2016). Ontario’s emissions trading regulations on sulphur dioxide and nitrogen oxides (O. Reg. 397/01 and O. Reg. 194/05) have contributed to the reduction in nitrogen oxides emissions in recent years. Nitrogen oxides emissions from on-road vehicles have also decreased due to the phase-in of new vehicles having more stringent emission standards. The implementation of the Ontario Drive Clean program in southern Ontario in 1999 has also helped further reduce the NOx emissions from light duty gasoline vehicles.
Figure 2: Trend of NO2 Annual Means Across Ontario (2007-2016)
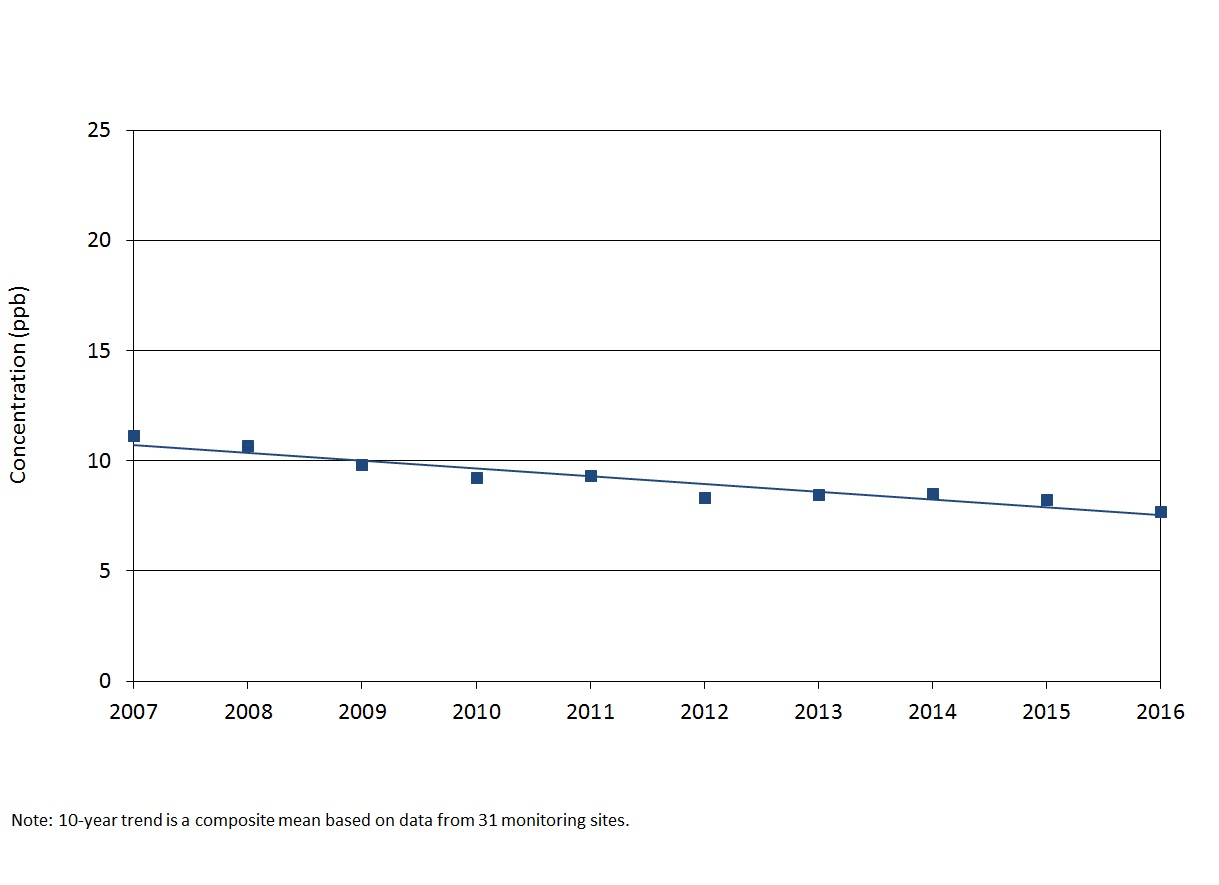
Figure 3: Ontario NOx Emission Trend (2007-2016)
